External Email - Use Caution
Hi Valentina,
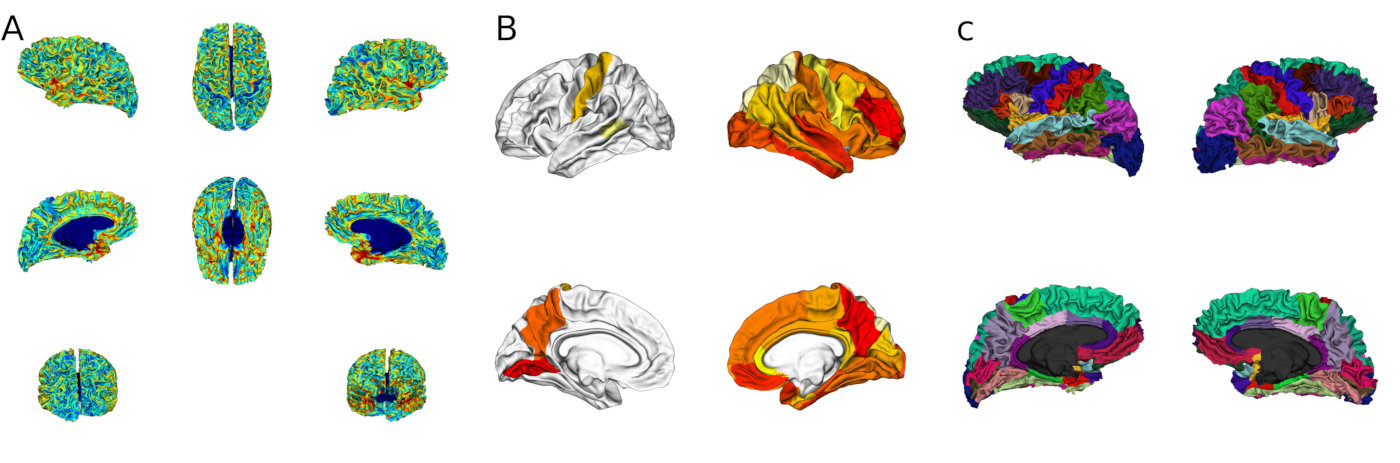
Just to be sure I get what you are asking: do you want a visualization like subfigure B in this image?
https://raw.githubusercontent.com/dfsp-spirit/fsbrain/master/web/fsbrain_vis_overview.jpg
So you have one value per Desikan atlas region that you want to show?
Best,
Tim
> On February 14, 2020 at 11:49 AM Valentina Mancini <Valentina.Mancini@unige.ch> wrote:
>
>
> External Email - Use Caution
>
> Dear Freesurfer experts,
>
>
> we used the Desikan and Killiany atlas to build individual head models in order to project surface EEG data in the inverse space.
>
>
> We would like to plot on the cortical surface the regions of the D&K atlas where we find a different functional activation.
>
> As I understand, there is a way to plot statistically significant results with tksurfer, but in our case we cannot show our statistical values because we should take into account also epochs and frequency and we can do that only with a time-frequency plot.
>
>
> Is there a simple way to get a figure of the cortical surface with a set of predetermined regions of the D&K atlas highlighted only for visualization purpose?
>
>
>
> Best regards,
>
>
>
> Valentina Mancini
> _______________________________________________
> Freesurfer mailing list
> Freesurfer@nmr.mgh.harvard.edu
>
https://mail.nmr.mgh.harvard.edu/mailman/listinfo/freesurfer
_______________________________________________
Freesurfer mailing list
Freesurfer@nmr.mgh.harvard.edu
https://mail.nmr.mgh.harvard.edu/mailman/listinfo/freesurfer