
External Email - Use Caution
Dear Freesurfer Mailing List,
I have completed an LME analysis in matlab and have generated a number of different cluster summary files for my various contrasts. In many of resulting cluster summary files the 'Max' value for the largest cluster which encompasses most of the brain surface is reported as infinity ('-inf'). Please find an example file attached. As I was hoping to use these values to generate effect size estimates, can you please tell me what alternate value I could substitute here for 'Max'?
Kind regards,
Bronwyn Overs
Research Assistant
Neuroscience Research Australia Margarete Ainsworth Building Barker Street Randwick Sydney NSW 2031 Australia M 0411 308 769 T +61 2 9399 1725
[ http://neura.edu.au/ | neura.edu.au ]
[ https://twitter.com/neuraustralia | Twitter ] | [ https://www.facebook.com/NeuroscienceResearchAustralia | Facebook ] | [ http://www.neura.edu.au/help-research/subscribe | Subscribe ]

It looks like you have one gigantic cluster with a value of -inf at vertex 41. How did you generate /fsdata/lme/thickness/rh.thickness.B1B7.mgh ? Have you looked at it in freeview?
On 11/11/2019 7:39 PM, Bronwyn Overs wrote:
External Email - Use Caution
Dear Freesurfer Mailing List,
I have completed an LME analysis in matlab and have generated a number of different cluster summary files for my various contrasts. In many of resulting cluster summary files the 'Max' value for the largest cluster which encompasses most of the brain surface is reported as infinity ('-inf'). Please find an example file attached. As I was hoping to use these values to generate effect size estimates, can you please tell me what alternate value I could substitute here for 'Max'?
Kind regards,
Bronwyn Overs
Research Assistant
[cid:part1.B9307C7A.2CF4D079@mgh.harvard.edu]
Neuroscience Research Australia Margarete Ainsworth Building Barker Street Randwick Sydney NSW 2031 Australia M 0411 308 769 T +61 2 9399 1725
neura.edu.au http://neura.edu.au/
Twitterhttps://twitter.com/neuraustralia | Facebookhttps://www.facebook.com/NeuroscienceResearchAustralia | Subscribehttp://www.neura.edu.au/help-research/subscribe
_______________________________________________ Freesurfer mailing list Freesurfer@nmr.mgh.harvard.edumailto:Freesurfer@nmr.mgh.harvard.edu https://mail.nmr.mgh.harvard.edu/mailman/listinfo/freesurfer
External Email - Use Caution
Hi Douglas,
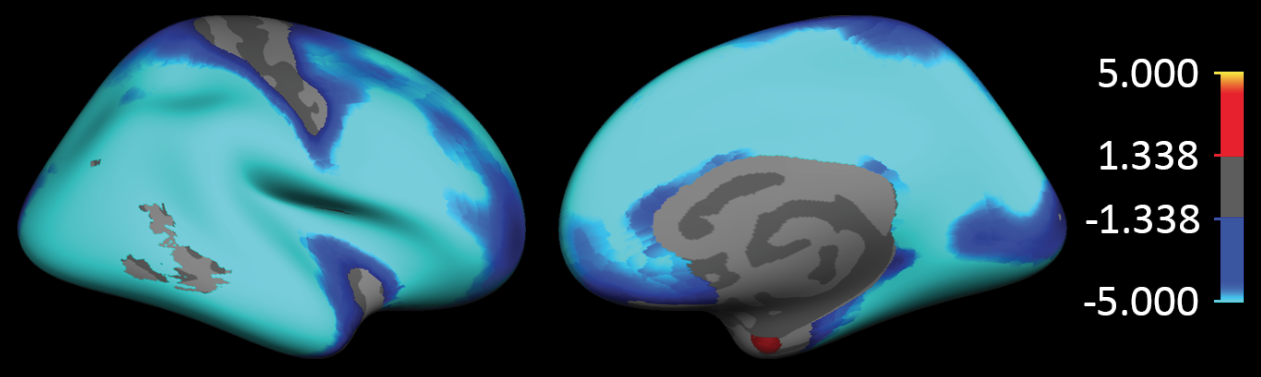
Yes I have looked at it in Freeview and I have attached a screenshot for your reference.
The /fsdata/lme/thickness/rh.thickness.B1B7.mgh file was generated with a mass-univariate spatiotemporal model using 'lme_mass_fit_EMinit' and then FDR correction was applied across both hemispheres (lme_mass_FDR). I have provided analysis details and syntax below. The B1B7 contrast represents the affect of years in cases.
Sample: Our sample includes 112 controls subjects, and 106 cases. All subjects are aged between 12 and 30 years. 153 or these subjects have 2 time-points (77 control, 76 cases), while the remaining 65 individuals have only 1 MRI time-point. We also have mixed ethnicites - 165 Caucasians, 23 Asians, and 30 mixed (Asians-Caucasians).
The QDEC file contains the following 6 variables: 1. Y (years between scans) 2. A (baseline age) 3. G (group, 1=case, 0=control) 4. S (sex, 1=female, 0=male) 5. E1 (Ethnicity 1, 1=asian, 0=other) 6. E2 (Ethnicity 1, 1=mixed-asian-caucasian, 0=other)
Design matrix: [ones(length(M),1) M M(:,1).*M(:,3)] i.e. main effects for each of the qdec variables + an interaction term for years X group
DVs: Cortical thickness, area and volume
Model: Mass-univariate spatiotemporal model using 'lme_mass_fit_EMinit' CODE: % Read in surface files [Y,mri] = fs_read_Y(mgh); % Read in qdec file Qdec = fReadQdec(qdec); % Remove fsid from qdec Qdec = rmQdecCol(Qdec,1); % Store col 1 (fsid-base) in sID variable sID = Qdec(2:end,1); % Remove col 1 (fsid-base) from Qdec array Qdec = rmQdecCol(Qdec,1); % Convert Qdec to numeric matrix M M = Qdec2num(Qdec); % Sort data and evaluate design matrix [M,Y,ni] = sortData(M,1,Y,sID); X = eval([ones(length(M),1) M M(:,1).*M(:,3)]) % Compute vertex-wise temporal covariance estimates. [Th0, Re] = lme_mass_fit_EMinit(X,[1],Y,ni,cortex,3); %Segmentation and model fitting. [Rgs, RgMeans, stats] = fit(Th0, Re, [1], sphere, cortex, X, Y, ni); %Check surfaces. surfcomp(Th0, RgMeans, sphere, fig1, fig2)
Correction for multiple comparisons: FDR across both hemispheres CODE: P = [ F_lhstats.pval(lhcortex) F_rhstats.pval(rhcortex) ]; G = [ F_lhstats.sgn(lhcortex) F_rhstats.sgn(rhcortex) ]; [detvtx, sided_pval, pth] = lme_mass_FDR2(P,G,[],0.05,0); altfdr(r,2) = num2cell(abs(log10(lme_mass_FDR(P,0.05)))); pcor = -log10(pth); [~,~,dflh] = find(F_lhstats.df(2,:)); [~,~,dfrh] = find(F_rhstats.df(2,:)); dfmodelh(r,2) = {floor(mode(dflh))}; dfmoderh(r,2) = {floor(mode(dfrh))}; thrlh(r,2) = {pcor}; thrrh(r,2) = {pcor}; [~,dc] = size(detvtx); dvtx(r,2) = {dc};
Kind regards,
Bronwyn Overs
Research Assistant
Neuroscience Research Australia Margarete Ainsworth Building Barker Street Randwick Sydney NSW 2031 Australia M 0411 308 769 T +61 2 9399 1725
[ http://neura.edu.au/ | neura.edu.au ]
[ https://twitter.com/neuraustralia | Twitter ] | [ https://www.facebook.com/NeuroscienceResearchAustralia | Facebook ] | [ http://www.neura.edu.au/help-research/subscribe | Subscribe ]
From: "Greve, Douglas N.,Ph.D." DGREVE@mgh.harvard.edu To: "Freesurfer support list" freesurfer@nmr.mgh.harvard.edu Sent: Wednesday, November 13, 2019 2:44:25 AM Subject: Re: [Freesurfer] Max threshold marked as '-inf' in cluster summary file
It looks like you have one gigantic cluster with a value of -inf at vertex 41. How did you generate /fsdata/lme/thickness/rh.thickness.B1B7.mgh ? Have you looked at it in freeview?
On 11/11/2019 7:39 PM, Bronwyn Overs wrote:
External Email - Use Caution Dear Freesurfer Mailing List,
I have completed an LME analysis in matlab and have generated a number of different cluster summary files for my various contrasts. In many of resulting cluster summary files the 'Max' value for the largest cluster which encompasses most of the brain surface is reported as infinity ('-inf'). Please find an example file attached. As I was hoping to use these values to generate effect size estimates, can you please tell me what alternate value I could substitute here for 'Max'?
Kind regards,
Bronwyn Overs
Research Assistant
Neuroscience Research Australia Margarete Ainsworth Building Barker Street Randwick Sydney NSW 2031 Australia M 0411 308 769 T +61 2 9399 1725
[ http://neura.edu.au/ | neura.edu.au ]
[ https://twitter.com/neuraustralia | Twitter ] | [ https://www.facebook.com/NeuroscienceResearchAustralia | Facebook ] | [ http://www.neura.edu.au/help-research/subscribe | Subscribe ]
_______________________________________________ Freesurfer mailing list [ mailto:Freesurfer@nmr.mgh.harvard.edu | Freesurfer@nmr.mgh.harvard.edu ] [ https://mail.nmr.mgh.harvard.edu/mailman/listinfo/freesurfer | https://mail.nmr.mgh.harvard.edu/mailman/listinfo/freesurfer ]
_______________________________________________ Freesurfer mailing list Freesurfer@nmr.mgh.harvard.edu https://mail.nmr.mgh.harvard.edu/mailman/listinfo/freesurfer
I'll have to leave this one for Kersten as it appears that the LME stuff is generating and inf value
On 11/12/19 7:05 PM, Bronwyn Overs wrote:
External Email - Use Caution
Hi Douglas,
Yes I have looked at it in Freeview and I have attached a screenshot for your reference.
The /fsdata/lme/thickness/rh.thickness.B1B7.mgh file was generated with a mass-univariate spatiotemporal model using 'lme_mass_fit_EMinit' and then FDR correction was applied across both hemispheres (lme_mass_FDR). I have provided analysis details and syntax below. The B1B7 contrast represents the affect of years in cases.
Sample: Our sample includes 112 controls subjects, and 106 cases. All subjects are aged between 12 and 30 years. 153 or these subjects have 2 time-points (77 control, 76 cases), while the remaining 65 individuals have only 1 MRI time-point. We also have mixed ethnicites - 165 Caucasians, 23 Asians, and 30 mixed (Asians-Caucasians).
The QDEC file contains the following 6 variables:
- Y (years between scans)
- A (baseline age)
- G (group, 1=case, 0=control)
- S (sex, 1=female, 0=male)
- E1 (Ethnicity 1, 1=asian, 0=other)
- E2 (Ethnicity 1, 1=mixed-asian-caucasian, 0=other)
Design matrix: [ones(length(M),1) M M(:,1).*M(:,3)] i.e. main effects for each of the qdec variables + an interaction term for years X group
DVs: Cortical thickness, area and volume
Model: Mass-univariate spatiotemporal model using 'lme_mass_fit_EMinit' CODE: % Read in surface files [Y,mri] = fs_read_Y(mgh); % Read in qdec file Qdec = fReadQdec(qdec); % Remove fsid from qdec Qdec = rmQdecCol(Qdec,1); % Store col 1 (fsid-base) in sID variable sID = Qdec(2:end,1); % Remove col 1 (fsid-base) from Qdec array Qdec = rmQdecCol(Qdec,1); % Convert Qdec to numeric matrix M M = Qdec2num(Qdec); % Sort data and evaluate design matrix [M,Y,ni] = sortData(M,1,Y,sID); X = eval([ones(length(M),1) M M(:,1).*M(:,3)]) % Compute vertex-wise temporal covariance estimates. [Th0, Re] = lme_mass_fit_EMinit(X,[1],Y,ni,cortex,3); %Segmentation and model fitting. [Rgs, RgMeans, stats] = fit(Th0, Re, [1], sphere, cortex, X, Y, ni); %Check surfaces. surfcomp(Th0, RgMeans, sphere, fig1, fig2)
Correction for multiple comparisons: FDR across both hemispheres CODE: P = [ F_lhstats.pval(lhcortex) F_rhstats.pval(rhcortex) ]; G = [ F_lhstats.sgn(lhcortex) F_rhstats.sgn(rhcortex) ]; [detvtx, sided_pval, pth] = lme_mass_FDR2(P,G,[],0.05,0); altfdr(r,2) = num2cell(abs(log10(lme_mass_FDR(P,0.05)))); pcor = -log10(pth); [~,~,dflh] = find(F_lhstats.df(2,:)); [~,~,dfrh] = find(F_rhstats.df(2,:)); dfmodelh(r,2) = {floor(mode(dflh))}; dfmoderh(r,2) = {floor(mode(dfrh))}; thrlh(r,2) = {pcor}; thrrh(r,2) = {pcor}; [~,dc] = size(detvtx); dvtx(r,2) = {dc};
Kind regards,
Bronwyn Overs
Research Assistant
Neuroscience Research Australia Margarete Ainsworth Building Barker Street Randwick Sydney NSW 2031 Australia *M* 0411 308 769 *T* +61 2 9399 1725
neura.edu.au http://neura.edu.au/
Twitter https://twitter.com/neuraustralia | Facebook https://www.facebook.com/NeuroscienceResearchAustralia | Subscribe http://www.neura.edu.au/help-research/subscribe
*From: *"Greve, Douglas N.,Ph.D." DGREVE@mgh.harvard.edu *To: *"Freesurfer support list" freesurfer@nmr.mgh.harvard.edu *Sent: *Wednesday, November 13, 2019 2:44:25 AM *Subject: *Re: [Freesurfer] Max threshold marked as '-inf' in cluster summary file
It looks like you have one gigantic cluster with a value of -inf at vertex 41. How did you generate /fsdata/lme/thickness/rh.thickness.B1B7.mgh ? Have you looked at it in freeview?
On 11/11/2019 7:39 PM, Bronwyn Overs wrote:
        External Email - Use Caution

Dear Freesurfer Mailing List,

I have completed an LME analysis in matlab and have generated a
number of different cluster summary files for my various
contrasts. In many of resulting cluster summary files the 'Max'
value for the largest cluster which encompasses most of the brain
surface is reported as infinity ('-inf'). Please find an example
file attached. As I was hoping to use these values to generate
effect size estimates, can you please tell me what alternate value
I could substitute here for 'Max'?

Kind regards,


Bronwyn Overs

Research Assistant


Neuroscience Research Australia
Margarete Ainsworth Building
Barker Street Randwick Sydney NSW 2031 Australia
*M* 0411 308 769 *T* +61 2 9399 1725


neura.edu.au <http://neura.edu.au/>

Twitter <https://twitter.com/neuraustralia> | Facebook
<https://www.facebook.com/NeuroscienceResearchAustralia> |
Subscribe <http://www.neura.edu.au/help-research/subscribe>


_______________________________________________
Freesurfer mailing list
Freesurfer@nmr.mgh.harvard.edu  <mailto:Freesurfer@nmr.mgh.harvard.edu>
https://mail.nmr.mgh.harvard.edu/mailman/listinfo/freesurfer
Freesurfer mailing list Freesurfer@nmr.mgh.harvard.edu https://mail.nmr.mgh.harvard.edu/mailman/listinfo/freesurfer
Freesurfer mailing list Freesurfer@nmr.mgh.harvard.edu https://mail.nmr.mgh.harvard.edu/mailman/listinfo/freesurfer
External Email - Use Caution
Hi Kersten,
Following on from Douglas's reply, you may remember my analysis as I forwarded you some files in October (see [ https://www.mail-archive.com/freesurfer@nmr.mgh.harvard.edu/msg64148.html | https://www.mail-archive.com/freesurfer@nmr.mgh.harvard.edu/msg64148.html ] ). I followed your suggestions of removing the '--thmax 5' argument form 'mri_surfcluster', and now the labels generated by 'mri_label2label' overlap perfectly with the significance maps from the LME. However, now my largest clusters have a maximum threshold of '-inf' in my cluster summary files. Do you have any idea how to get around this problem so that I can use my max threshold values to calculate cluster-wise effect sizes?
Kind regards,
Bronwyn Overs
Research Assistant
Neuroscience Research Australia Margarete Ainsworth Building Barker Street Randwick Sydney NSW 2031 Australia M 0411 308 769 T +61 2 9399 1725
[ http://neura.edu.au/ | neura.edu.au ]
[ https://twitter.com/neuraustralia | Twitter ] | [ https://www.facebook.com/NeuroscienceResearchAustralia | Facebook ] | [ http://www.neura.edu.au/help-research/subscribe | Subscribe ]
From: "Greve, Douglas N.,Ph.D." DGREVE@mgh.harvard.edu To: "Freesurfer support list" freesurfer@nmr.mgh.harvard.edu, "Kersten Diers, DZNE" Kersten.Diers@dzne.de Sent: Thursday, November 14, 2019 4:23:12 AM Subject: Re: [Freesurfer] Max threshold marked as '-inf' in cluster summary file
I'll have to leave this one for Kersten as it appears that the LME stuff is generating and inf value
On 11/12/19 7:05 PM, Bronwyn Overs wrote:
External Email - Use Caution
Hi Douglas,
Yes I have looked at it in Freeview and I have attached a screenshot for your reference.
The /fsdata/lme/thickness/rh.thickness.B1B7.mgh file was generated with a mass-univariate spatiotemporal model using 'lme_mass_fit_EMinit' and then FDR correction was applied across both hemispheres (lme_mass_FDR). I have provided analysis details and syntax below. The B1B7 contrast represents the affect of years in cases.
Sample: Our sample includes 112 controls subjects, and 106 cases. All subjects are aged between 12 and 30 years. 153 or these subjects have 2 time-points (77 control, 76 cases), while the remaining 65 individuals have only 1 MRI time-point. We also have mixed ethnicites - 165 Caucasians, 23 Asians, and 30 mixed (Asians-Caucasians).
The QDEC file contains the following 6 variables:
- Y (years between scans)
- A (baseline age)
- G (group, 1=case, 0=control)
- S (sex, 1=female, 0=male)
- E1 (Ethnicity 1, 1=asian, 0=other)
- E2 (Ethnicity 1, 1=mixed-asian-caucasian, 0=other)
Design matrix: [ones(length(M),1) M M(:,1).*M(:,3)] i.e. main effects for each of the qdec variables + an interaction term for years X group
DVs: Cortical thickness, area and volume
Model: Mass-univariate spatiotemporal model using 'lme_mass_fit_EMinit' CODE: % Read in surface files [Y,mri] = fs_read_Y(mgh); % Read in qdec file Qdec = fReadQdec(qdec); % Remove fsid from qdec Qdec = rmQdecCol(Qdec,1); % Store col 1 (fsid-base) in sID variable sID = Qdec(2:end,1); % Remove col 1 (fsid-base) from Qdec array Qdec = rmQdecCol(Qdec,1); % Convert Qdec to numeric matrix M M = Qdec2num(Qdec); % Sort data and evaluate design matrix [M,Y,ni] = sortData(M,1,Y,sID); X = eval([ones(length(M),1) M M(:,1).*M(:,3)]) % Compute vertex-wise temporal covariance estimates. [Th0, Re] = lme_mass_fit_EMinit(X,[1],Y,ni,cortex,3); %Segmentation and model fitting. [Rgs, RgMeans, stats] = fit(Th0, Re, [1], sphere, cortex, X, Y, ni); %Check surfaces. surfcomp(Th0, RgMeans, sphere, fig1, fig2)
Correction for multiple comparisons: FDR across both hemispheres CODE: P = [ F_lhstats.pval(lhcortex) F_rhstats.pval(rhcortex) ]; G = [ F_lhstats.sgn(lhcortex) F_rhstats.sgn(rhcortex) ]; [detvtx, sided_pval, pth] = lme_mass_FDR2(P,G,[],0.05,0); altfdr(r,2) = num2cell(abs(log10(lme_mass_FDR(P,0.05)))); pcor = -log10(pth); [~,~,dflh] = find(F_lhstats.df(2,:)); [~,~,dfrh] = find(F_rhstats.df(2,:)); dfmodelh(r,2) = {floor(mode(dflh))}; dfmoderh(r,2) = {floor(mode(dfrh))}; thrlh(r,2) = {pcor}; thrrh(r,2) = {pcor}; [~,dc] = size(detvtx); dvtx(r,2) = {dc};
Kind regards,
Bronwyn Overs
Research Assistant
Neuroscience Research Australia Margarete Ainsworth Building Barker Street Randwick Sydney NSW 2031 Australia *M* 0411 308 769 *T* +61 2 9399 1725
neura.edu.au http://neura.edu.au/
Twitter https://twitter.com/neuraustralia | Facebook https://www.facebook.com/NeuroscienceResearchAustralia | Subscribe http://www.neura.edu.au/help-research/subscribe
*From: *"Greve, Douglas N.,Ph.D." DGREVE@mgh.harvard.edu *To: *"Freesurfer support list" freesurfer@nmr.mgh.harvard.edu *Sent: *Wednesday, November 13, 2019 2:44:25 AM *Subject: *Re: [Freesurfer] Max threshold marked as '-inf' in cluster summary file
It looks like you have one gigantic cluster with a value of -inf at vertex 41. How did you generate /fsdata/lme/thickness/rh.thickness.B1B7.mgh ? Have you looked at it in freeview?
On 11/11/2019 7:39 PM, Bronwyn Overs wrote:
External Email - Use Caution
Dear Freesurfer Mailing List,
I have completed an LME analysis in matlab and have generated a number of different cluster summary files for my various contrasts. In many of resulting cluster summary files the 'Max' value for the largest cluster which encompasses most of the brain surface is reported as infinity ('-inf'). Please find an example file attached. As I was hoping to use these values to generate effect size estimates, can you please tell me what alternate value I could substitute here for 'Max'?
Kind regards,
Bronwyn Overs
Research Assistant
Neuroscience Research Australia Margarete Ainsworth Building Barker Street Randwick Sydney NSW 2031 Australia *M* 0411 308 769 *T* +61 2 9399 1725
neura.edu.au http://neura.edu.au/
Twitter https://twitter.com/neuraustralia | Facebook https://www.facebook.com/NeuroscienceResearchAustralia | Subscribe http://www.neura.edu.au/help-research/subscribe
Freesurfer mailing list Freesurfer@nmr.mgh.harvard.edu mailto:Freesurfer@nmr.mgh.harvard.edu https://mail.nmr.mgh.harvard.edu/mailman/listinfo/freesurfer
Freesurfer mailing list Freesurfer@nmr.mgh.harvard.edu https://mail.nmr.mgh.harvard.edu/mailman/listinfo/freesurfer
Freesurfer mailing list Freesurfer@nmr.mgh.harvard.edu https://mail.nmr.mgh.harvard.edu/mailman/listinfo/freesurfer
_______________________________________________ Freesurfer mailing list Freesurfer@nmr.mgh.harvard.edu https://mail.nmr.mgh.harvard.edu/mailman/listinfo/freesurfer
can you send the cluster summary file?
On 11/24/2019 7:09 PM, Bronwyn Overs wrote:
External Email - Use Caution
Hi Kersten,
Following on from Douglas's reply, you may remember my analysis as I forwarded you some files in October (see https://www.mail-archive.com/freesurfer@nmr.mgh.harvard.edu/msg64148.html). I followed your suggestions of removing the '--thmax 5' argument form 'mri_surfcluster', and now the labels generated by 'mri_label2label' overlap perfectly with the significance maps from the LME. However, now my largest clusters have a maximum threshold of '-inf' in my cluster summary files. Do you have any idea how to get around this problem so that I can use my max threshold values to calculate cluster-wise effect sizes?
Kind regards,
Bronwyn Overs
Research Assistant
[cid:part2.69D05ACA.AA1EE7B5@mgh.harvard.edu]
Neuroscience Research Australia Margarete Ainsworth Building Barker Street Randwick Sydney NSW 2031 Australia M 0411 308 769 T +61 2 9399 1725
neura.edu.au http://neura.edu.au/
Twitterhttps://twitter.com/neuraustralia | Facebookhttps://www.facebook.com/NeuroscienceResearchAustralia | Subscribehttp://www.neura.edu.au/help-research/subscribe
________________________________ From: "Greve, Douglas N.,Ph.D." DGREVE@mgh.harvard.edumailto:DGREVE@mgh.harvard.edu To: "Freesurfer support list" freesurfer@nmr.mgh.harvard.edumailto:freesurfer@nmr.mgh.harvard.edu, "Kersten Diers, DZNE" Kersten.Diers@dzne.demailto:Kersten.Diers@dzne.de Sent: Thursday, November 14, 2019 4:23:12 AM Subject: Re: [Freesurfer] Max threshold marked as '-inf' in cluster summary file
I'll have to leave this one for Kersten as it appears that the LME stuff is generating and inf value
On 11/12/19 7:05 PM, Bronwyn Overs wrote:
External Email - Use CautionHi Douglas,
Yes I have looked at it in Freeview and I have attached a screenshot for your reference.
The /fsdata/lme/thickness/rh.thickness.B1B7.mgh file was generated with a mass-univariate spatiotemporal model using 'lme_mass_fit_EMinit' and then FDR correction was applied across both hemispheres (lme_mass_FDR). I have provided analysis details and syntax below. The B1B7 contrast represents the affect of years in cases.
Sample: Our sample includes 112 controls subjects, and 106 cases. All subjects are aged between 12 and 30 years. 153 or these subjects have 2 time-points (77 control, 76 cases), while the remaining 65 individuals have only 1 MRI time-point. We also have mixed ethnicites - 165 Caucasians, 23 Asians, and 30 mixed (Asians-Caucasians).
The QDEC file contains the following 6 variables:
- Y (years between scans)
- A (baseline age)
- G (group, 1=case, 0=control)
- S (sex, 1=female, 0=male)
- E1 (Ethnicity 1, 1=asian, 0=other)
- E2 (Ethnicity 1, 1=mixed-asian-caucasian, 0=other)
Design matrix: [ones(length(M),1) M M(:,1).*M(:,3)] i.e. main effects for each of the qdec variables + an interaction term for years X group
DVs: Cortical thickness, area and volume
Model: Mass-univariate spatiotemporal model using 'lme_mass_fit_EMinit' CODE: % Read in surface files [Y,mri] = fs_read_Y(mgh); % Read in qdec file Qdec = fReadQdec(qdec); % Remove fsid from qdec Qdec = rmQdecCol(Qdec,1); % Store col 1 (fsid-base) in sID variable sID = Qdec(2:end,1); % Remove col 1 (fsid-base) from Qdec array Qdec = rmQdecCol(Qdec,1); % Convert Qdec to numeric matrix M M = Qdec2num(Qdec); % Sort data and evaluate design matrix [M,Y,ni] = sortData(M,1,Y,sID); X = eval([ones(length(M),1) M M(:,1).*M(:,3)]) % Compute vertex-wise temporal covariance estimates. [Th0, Re] = lme_mass_fit_EMinit(X,[1],Y,ni,cortex,3); %Segmentation and model fitting. [Rgs, RgMeans, stats] = fit(Th0, Re, [1], sphere, cortex, X, Y, ni); %Check surfaces. surfcomp(Th0, RgMeans, sphere, fig1, fig2)
Correction for multiple comparisons: FDR across both hemispheres CODE: P = [ F_lhstats.pval(lhcortex) F_rhstats.pval(rhcortex) ]; G = [ F_lhstats.sgn(lhcortex) F_rhstats.sgn(rhcortex) ]; [detvtx, sided_pval, pth] = lme_mass_FDR2(P,G,[],0.05,0); altfdr(r,2) = num2cell(abs(log10(lme_mass_FDR(P,0.05)))); pcor = -log10(pth); [~,~,dflh] = find(F_lhstats.df(2,:)); [~,~,dfrh] = find(F_rhstats.df(2,:)); dfmodelh(r,2) = {floor(mode(dflh))}; dfmoderh(r,2) = {floor(mode(dfrh))}; thrlh(r,2) = {pcor}; thrrh(r,2) = {pcor}; [~,dc] = size(detvtx); dvtx(r,2) = {dc};
Kind regards,
Bronwyn Overs
Research Assistant
Neuroscience Research Australia Margarete Ainsworth Building Barker Street Randwick Sydney NSW 2031 Australia *M* 0411 308 769 *T* +61 2 9399 1725
neura.edu.au http://neura.edu.au/http://neura.edu.au/
Twitter https://twitter.com/neuraustraliahttps://twitter.com/neuraustralia | Facebook https://www.facebook.com/NeuroscienceResearchAustraliahttps://www.facebook.com/NeuroscienceResearchAustralia | Subscribe http://www.neura.edu.au/help-research/subscribehttp://www.neura.edu.au/help-research/subscribe
*From: *"Greve, Douglas N.,Ph.D." DGREVE@mgh.harvard.edumailto:DGREVE@mgh.harvard.edu *To: *"Freesurfer support list" freesurfer@nmr.mgh.harvard.edumailto:freesurfer@nmr.mgh.harvard.edu *Sent: *Wednesday, November 13, 2019 2:44:25 AM *Subject: *Re: [Freesurfer] Max threshold marked as '-inf' in cluster summary file
It looks like you have one gigantic cluster with a value of -inf at vertex 41. How did you generate /fsdata/lme/thickness/rh.thickness.B1B7.mgh ? Have you looked at it in freeview?
On 11/11/2019 7:39 PM, Bronwyn Overs wrote:
        External Email - Use Caution

Dear Freesurfer Mailing List,

I have completed an LME analysis in matlab and have generated a
number of different cluster summary files for my various
contrasts. In many of resulting cluster summary files the 'Max'
value for the largest cluster which encompasses most of the brain
surface is reported as infinity ('-inf'). Please find an example
file attached. As I was hoping to use these values to generate
effect size estimates, can you please tell me what alternate value
I could substitute here for 'Max'?

Kind regards,


Bronwyn Overs

Research Assistant


Neuroscience Research Australia
Margarete Ainsworth Building
Barker Street Randwick Sydney NSW 2031 Australia
*M* 0411 308 769 *T* +61 2 9399 1725


neura.edu.au <http://neura.edu.au/><http://neura.edu.au/>

Twitter <https://twitter.com/neuraustralia><https://twitter.com/neuraustralia> | Facebook
<https://www.facebook.com/NeuroscienceResearchAustralia><https://www.facebook.com/NeuroscienceResearchAustralia> |
Subscribe <http://www.neura.edu.au/help-research/subscribe><http://www.neura.edu.au/help-research/subscribe>


_______________________________________________
Freesurfer mailing list
Freesurfer@nmr.mgh.harvard.edu<mailto:Freesurfer@nmr.mgh.harvard.edu>  <mailto:Freesurfer@nmr.mgh.harvard.edu><mailto:Freesurfer@nmr.mgh.harvard.edu>
https://mail.nmr.mgh.harvard.edu/mailman/listinfo/freesurfer
Freesurfer mailing list Freesurfer@nmr.mgh.harvard.edumailto:Freesurfer@nmr.mgh.harvard.edu https://mail.nmr.mgh.harvard.edu/mailman/listinfo/freesurfer
Freesurfer mailing list Freesurfer@nmr.mgh.harvard.edumailto:Freesurfer@nmr.mgh.harvard.edu https://mail.nmr.mgh.harvard.edu/mailman/listinfo/freesurfer
_______________________________________________ Freesurfer mailing list Freesurfer@nmr.mgh.harvard.edumailto:Freesurfer@nmr.mgh.harvard.edu https://mail.nmr.mgh.harvard.edu/mailman/listinfo/freesurfer
_______________________________________________ Freesurfer mailing list Freesurfer@nmr.mgh.harvard.edumailto:Freesurfer@nmr.mgh.harvard.edu https://mail.nmr.mgh.harvard.edu/mailman/listinfo/freesurfer

External Email - Use Caution
Hi Bronwyn, Doug,
sorry - I missed the other mail from two weeks ago (and have been absent for a few days), but I'm able to take a look now.
You mention that your goal is to calculate effect sizes. Could you briefly let us know how you are planning to do it - this would help me to better understand the issue.
Thanks,
Kersten
On Di, 2019-11-26 at 23:14 +0000, Greve, Douglas N.,Ph.D. wrote: can you send the cluster summary file?
On 11/24/2019 7:09 PM, Bronwyn Overs wrote:
External Email - Use Caution
Hi Kersten,
Following on from Douglas's reply, you may remember my analysis as I forwarded you some files in October (see https://www.mail-archive.com/freesurfer@nmr.mgh.harvard.edu/msg64148.html). I followed your suggestions of removing the '--thmax 5' argument form 'mri_surfcluster', and now the labels generated by 'mri_label2label' overlap perfectly with the significance maps from the LME. However, now my largest clusters have a maximum threshold of '-inf' in my cluster summary files. Do you have any idea how to get around this problem so that I can use my max threshold values to calculate cluster-wise effect sizes?
Kind regards,
Bronwyn Overs
Research Assistant
[cid:1574861358.21520.14.camel@dzne.de]
Neuroscience Research Australia Margarete Ainsworth Building Barker Street Randwick Sydney NSW 2031 Australia M 0411 308 769 T +61 2 9399 1725
neura.edu.au http://neura.edu.au/
Twitterhttps://twitter.com/neuraustralia | Facebookhttps://www.facebook.com/NeuroscienceResearchAustralia | Subscribehttp://www.neura.edu.au/help-research/subscribe
________________________________ From: "Greve, Douglas N.,Ph.D." DGREVE@mgh.harvard.edumailto:DGREVE@mgh.harvard.edu To: "Freesurfer support list" freesurfer@nmr.mgh.harvard.edumailto:freesurfer@nmr.mgh.harvard.edu, "Kersten Diers, DZNE" Kersten.Diers@dzne.demailto:Kersten.Diers@dzne.de Sent: Thursday, November 14, 2019 4:23:12 AM Subject: Re: [Freesurfer] Max threshold marked as '-inf' in cluster summary file
I'll have to leave this one for Kersten as it appears that the LME stuff is generating and inf value
On 11/12/19 7:05 PM, Bronwyn Overs wrote:
External Email - Use CautionHi Douglas,
Yes I have looked at it in Freeview and I have attached a screenshot for your reference.
The /fsdata/lme/thickness/rh.thickness.B1B7.mgh file was generated with a mass-univariate spatiotemporal model using 'lme_mass_fit_EMinit' and then FDR correction was applied across both hemispheres (lme_mass_FDR). I have provided analysis details and syntax below. The B1B7 contrast represents the affect of years in cases.
Sample: Our sample includes 112 controls subjects, and 106 cases. All subjects are aged between 12 and 30 years. 153 or these subjects have 2 time-points (77 control, 76 cases), while the remaining 65 individuals have only 1 MRI time-point. We also have mixed ethnicites - 165 Caucasians, 23 Asians, and 30 mixed (Asians-Caucasians).
The QDEC file contains the following 6 variables:
- Y (years between scans)
- A (baseline age)
- G (group, 1=case, 0=control)
- S (sex, 1=female, 0=male)
- E1 (Ethnicity 1, 1=asian, 0=other)
- E2 (Ethnicity 1, 1=mixed-asian-caucasian, 0=other)
Design matrix: [ones(length(M),1) M M(:,1).*M(:,3)] i.e. main effects for each of the qdec variables + an interaction term for years X group
DVs: Cortical thickness, area and volume
Model: Mass-univariate spatiotemporal model using 'lme_mass_fit_EMinit' CODE: % Read in surface files [Y,mri] = fs_read_Y(mgh); % Read in qdec file Qdec = fReadQdec(qdec); % Remove fsid from qdec Qdec = rmQdecCol(Qdec,1); % Store col 1 (fsid-base) in sID variable sID = Qdec(2:end,1); % Remove col 1 (fsid-base) from Qdec array Qdec = rmQdecCol(Qdec,1); % Convert Qdec to numeric matrix M M = Qdec2num(Qdec); % Sort data and evaluate design matrix [M,Y,ni] = sortData(M,1,Y,sID); X = eval([ones(length(M),1) M M(:,1).*M(:,3)]) % Compute vertex-wise temporal covariance estimates. [Th0, Re] = lme_mass_fit_EMinit(X,[1],Y,ni,cortex,3); %Segmentation and model fitting. [Rgs, RgMeans, stats] = fit(Th0, Re, [1], sphere, cortex, X, Y, ni); %Check surfaces. surfcomp(Th0, RgMeans, sphere, fig1, fig2)
Correction for multiple comparisons: FDR across both hemispheres CODE: P = [ F_lhstats.pval(lhcortex) F_rhstats.pval(rhcortex) ]; G = [ F_lhstats.sgn(lhcortex) F_rhstats.sgn(rhcortex) ]; [detvtx, sided_pval, pth] = lme_mass_FDR2(P,G,[],0.05,0); altfdr(r,2) = num2cell(abs(log10(lme_mass_FDR(P,0.05)))); pcor = -log10(pth); [~,~,dflh] = find(F_lhstats.df(2,:)); [~,~,dfrh] = find(F_rhstats.df(2,:)); dfmodelh(r,2) = {floor(mode(dflh))}; dfmoderh(r,2) = {floor(mode(dfrh))}; thrlh(r,2) = {pcor}; thrrh(r,2) = {pcor}; [~,dc] = size(detvtx); dvtx(r,2) = {dc};
Kind regards,
Bronwyn Overs
Research Assistant
Neuroscience Research Australia Margarete Ainsworth Building Barker Street Randwick Sydney NSW 2031 Australia *M* 0411 308 769 *T* +61 2 9399 1725
neura.edu.au http://neura.edu.au/http://neura.edu.au/
Twitter https://twitter.com/neuraustraliahttps://twitter.com/neuraustralia | Facebook https://www.facebook.com/NeuroscienceResearchAustraliahttps://www.facebook.com/NeuroscienceResearchAustralia | Subscribe http://www.neura.edu.au/help-research/subscribehttp://www.neura.edu.au/help-research/subscribe
*From: *"Greve, Douglas N.,Ph.D." DGREVE@mgh.harvard.edumailto:DGREVE@mgh.harvard.edu *To: *"Freesurfer support list" freesurfer@nmr.mgh.harvard.edumailto:freesurfer@nmr.mgh.harvard.edu *Sent: *Wednesday, November 13, 2019 2:44:25 AM *Subject: *Re: [Freesurfer] Max threshold marked as '-inf' in cluster summary file
It looks like you have one gigantic cluster with a value of -inf at vertex 41. How did you generate /fsdata/lme/thickness/rh.thickness.B1B7.mgh ? Have you looked at it in freeview?
On 11/11/2019 7:39 PM, Bronwyn Overs wrote:
        External Email - Use Caution

Dear Freesurfer Mailing List,

I have completed an LME analysis in matlab and have generated a
number of different cluster summary files for my various
contrasts. In many of resulting cluster summary files the 'Max'
value for the largest cluster which encompasses most of the brain
surface is reported as infinity ('-inf'). Please find an example
file attached. As I was hoping to use these values to generate
effect size estimates, can you please tell me what alternate value
I could substitute here for 'Max'?

Kind regards,


Bronwyn Overs

Research Assistant


Neuroscience Research Australia
Margarete Ainsworth Building
Barker Street Randwick Sydney NSW 2031 Australia
*M* 0411 308 769 *T* +61 2 9399 1725


neura.edu.au <http://neura.edu.au/><http://neura.edu.au/>

Twitter <https://twitter.com/neuraustralia><https://twitter.com/neuraustralia> | Facebook
<https://www.facebook.com/NeuroscienceResearchAustralia><https://www.facebook.com/NeuroscienceResearchAustralia> |
Subscribe <http://www.neura.edu.au/help-research/subscribe><http://www.neura.edu.au/help-research/subscribe>


_______________________________________________
Freesurfer mailing list
Freesurfer@nmr.mgh.harvard.edu<mailto:Freesurfer@nmr.mgh.harvard.edu>  <mailto:Freesurfer@nmr.mgh.harvard.edu><mailto:Freesurfer@nmr.mgh.harvard.edu>
https://mail.nmr.mgh.harvard.edu/mailman/listinfo/freesurfer
Freesurfer mailing list Freesurfer@nmr.mgh.harvard.edumailto:Freesurfer@nmr.mgh.harvard.edu https://mail.nmr.mgh.harvard.edu/mailman/listinfo/freesurfer
Freesurfer mailing list Freesurfer@nmr.mgh.harvard.edumailto:Freesurfer@nmr.mgh.harvard.edu https://mail.nmr.mgh.harvard.edu/mailman/listinfo/freesurfer
_______________________________________________ Freesurfer mailing list Freesurfer@nmr.mgh.harvard.edumailto:Freesurfer@nmr.mgh.harvard.edu https://mail.nmr.mgh.harvard.edu/mailman/listinfo/freesurfer
_______________________________________________ Freesurfer mailing list Freesurfer@nmr.mgh.harvard.edumailto:Freesurfer@nmr.mgh.harvard.edu https://mail.nmr.mgh.harvard.edu/mailman/listinfo/freesurfer
_______________________________________________ Freesurfer mailing list Freesurfer@nmr.mgh.harvard.edumailto:Freesurfer@nmr.mgh.harvard.edu https://mail.nmr.mgh.harvard.edu/mailman/listinfo/freesurfer
External Email - Use Caution
Hi Kersten,
No problem at al and thank you for your reply. While running my correction for multiple comparisons I store the df associated with each contrast vector using the following:
[~,~,dflh] = find(F_lhstats.df(2,:)); [~,~,dfrh] = find(F_rhstats.df(2,:)); dfmodelh = {floor(mode(dflh))}; dfmoderh = {floor(mode(dfrh))};
So far the dfmodelh and dfmoderh have been identical. I then calculate the effect size for each cluster using the following steps: 1. Derive the p-value from the Max threshold ('Max'), where p = 10 to the power of -abs(Max) 2. Calculate the t-value associated with this p-value, using the relevant df for this contrast 3. Calculate cohen's d using 't' and 'df', where d = (t*2)/(sqrt(df))
When the Max threshold is listed as -inf I cannot complete these calculations. Can you suggest an alternate method for generating effect sizes for these clusters?
Kind regards,
Bronwyn Overs
Research Assistant
Neuroscience Research Australia Margarete Ainsworth Building Barker Street Randwick Sydney NSW 2031 Australia M 0411 308 769 T +61 2 9399 1725
[ http://neura.edu.au/ | neura.edu.au ]
[ https://twitter.com/neuraustralia | Twitter ] | [ https://www.facebook.com/NeuroscienceResearchAustralia | Facebook ] | [ http://www.neura.edu.au/help-research/subscribe | Subscribe ]
From: "Kersten Diers, DZNE" Kersten.Diers@dzne.de To: "Freesurfer support list" freesurfer@nmr.mgh.harvard.edu Sent: Thursday, November 28, 2019 12:29:18 AM Subject: Re: [Freesurfer] Max threshold marked as '-inf' in cluster summary file
External Email - Use Caution
Hi Bronwyn, Doug,
sorry - I missed the other mail from two weeks ago (and have been absent for a few days), but I'm able to take a look now.
You mention that your goal is to calculate effect sizes. Could you briefly let us know how you are planning to do it - this would help me to better understand the issue.
Thanks,
Kersten
On Di, 2019-11-26 at 23:14 +0000, Greve, Douglas N.,Ph.D. wrote:
can you send the cluster summary file?
On 11/24/2019 7:09 PM, Bronwyn Overs wrote:
BQ_BEGIN
External Email - Use Caution Hi Kersten,
Following on from Douglas's reply, you may remember my analysis as I forwarded you some files in October (see [ https://www.mail-archive.com/freesurfer@nmr.mgh.harvard.edu/msg64148.html | https://www.mail-archive.com/freesurfer@nmr.mgh.harvard.edu/msg64148.html ] ). I followed your suggestions of removing the '--thmax 5' argument form 'mri_surfcluster', and now the labels generated by 'mri_label2label' overlap perfectly with the significance maps from the LME. However, now my largest clusters have a maximum threshold of '-inf' in my cluster summary files. Do you have any idea how to get around this problem so that I can use my max threshold values to calculate cluster-wise effect sizes?
Kind regards,
Bronwyn Overs
Research Assistant
Neuroscience Research Australia Margarete Ainsworth Building Barker Street Randwick Sydney NSW 2031 Australia M 0411 308 769 T +61 2 9399 1725
[ http://neura.edu.au/ | neura.edu.au ]
[ https://twitter.com/neuraustralia | Twitter ] | [ https://www.facebook.com/NeuroscienceResearchAustralia | Facebook ] | [ http://www.neura.edu.au/help-research/subscribe | Subscribe ]
From: "Greve, Douglas N.,Ph.D." [ mailto:DGREVE@mgh.harvard.edu | DGREVE@mgh.harvard.edu ] To: "Freesurfer support list" [ mailto:freesurfer@nmr.mgh.harvard.edu | freesurfer@nmr.mgh.harvard.edu ] , "Kersten Diers, DZNE" [ mailto:Kersten.Diers@dzne.de | Kersten.Diers@dzne.de ] Sent: Thursday, November 14, 2019 4:23:12 AM Subject: Re: [Freesurfer] Max threshold marked as '-inf' in cluster summary file
I'll have to leave this one for Kersten as it appears that the LME stuff is generating and inf value
On 11/12/19 7:05 PM, Bronwyn Overs wrote:
External Email - Use Caution
Hi Douglas,
Yes I have looked at it in Freeview and I have attached a screenshot for your reference.
The /fsdata/lme/thickness/rh.thickness.B1B7.mgh file was generated with a mass-univariate spatiotemporal model using 'lme_mass_fit_EMinit' and then FDR correction was applied across both hemispheres (lme_mass_FDR). I have provided analysis details and syntax below. The B1B7 contrast represents the affect of years in cases.
Sample: Our sample includes 112 controls subjects, and 106 cases. All subjects are aged between 12 and 30 years. 153 or these subjects have 2 time-points (77 control, 76 cases), while the remaining 65 individuals have only 1 MRI time-point. We also have mixed ethnicites - 165 Caucasians, 23 Asians, and 30 mixed (Asians-Caucasians).
The QDEC file contains the following 6 variables:
- Y (years between scans)
- A (baseline age)
- G (group, 1=case, 0=control)
- S (sex, 1=female, 0=male)
- E1 (Ethnicity 1, 1=asian, 0=other)
- E2 (Ethnicity 1, 1=mixed-asian-caucasian, 0=other)
Design matrix: [ones(length(M),1) M M(:,1).*M(:,3)] i.e. main effects for each of the qdec variables + an interaction term for years X group
DVs: Cortical thickness, area and volume
Model: Mass-univariate spatiotemporal model using 'lme_mass_fit_EMinit' CODE: % Read in surface files [Y,mri] = fs_read_Y(mgh); % Read in qdec file Qdec = fReadQdec(qdec); % Remove fsid from qdec Qdec = rmQdecCol(Qdec,1); % Store col 1 (fsid-base) in sID variable sID = Qdec(2:end,1); % Remove col 1 (fsid-base) from Qdec array Qdec = rmQdecCol(Qdec,1); % Convert Qdec to numeric matrix M M = Qdec2num(Qdec); % Sort data and evaluate design matrix [M,Y,ni] = sortData(M,1,Y,sID); X = eval([ones(length(M),1) M M(:,1).*M(:,3)]) % Compute vertex-wise temporal covariance estimates. [Th0, Re] = lme_mass_fit_EMinit(X,[1],Y,ni,cortex,3); %Segmentation and model fitting. [Rgs, RgMeans, stats] = fit(Th0, Re, [1], sphere, cortex, X, Y, ni); %Check surfaces. surfcomp(Th0, RgMeans, sphere, fig1, fig2)
Correction for multiple comparisons: FDR across both hemispheres CODE: P = [ F_lhstats.pval(lhcortex) F_rhstats.pval(rhcortex) ]; G = [ F_lhstats.sgn(lhcortex) F_rhstats.sgn(rhcortex) ]; [detvtx, sided_pval, pth] = lme_mass_FDR2(P,G,[],0.05,0); altfdr(r,2) = num2cell(abs(log10(lme_mass_FDR(P,0.05)))); pcor = -log10(pth); [~,~,dflh] = find(F_lhstats.df(2,:)); [~,~,dfrh] = find(F_rhstats.df(2,:)); dfmodelh(r,2) = {floor(mode(dflh))}; dfmoderh(r,2) = {floor(mode(dfrh))}; thrlh(r,2) = {pcor}; thrrh(r,2) = {pcor}; [~,dc] = size(detvtx); dvtx(r,2) = {dc};
Kind regards,
Bronwyn Overs
Research Assistant
Neuroscience Research Australia Margarete Ainsworth Building Barker Street Randwick Sydney NSW 2031 Australia *M* 0411 308 769 *T* +61 2 9399 1725
neura.edu.au [ http://neura.edu.au/ | http://neura.edu.au/ ]
Twitter [ https://twitter.com/neuraustralia | https://twitter.com/neuraustralia ] | Facebook [ https://www.facebook.com/NeuroscienceResearchAustralia | https://www.facebook.com/NeuroscienceResearchAustralia ] | Subscribe [ http://www.neura.edu.au/help-research/subscribe | http://www.neura.edu.au/help-research/subscribe ]
*From: *"Greve, Douglas N.,Ph.D." [ mailto:DGREVE@mgh.harvard.edu | DGREVE@mgh.harvard.edu ] *To: *"Freesurfer support list" [ mailto:freesurfer@nmr.mgh.harvard.edu |
freesurfer@nmr.mgh.harvard.edu ]
*Sent: *Wednesday, November 13, 2019 2:44:25 AM *Subject: *Re: [Freesurfer] Max threshold marked as '-inf' in cluster summary file
It looks like you have one gigantic cluster with a value of -inf at vertex 41. How did you generate /fsdata/lme/thickness/rh.thickness.B1B7.mgh ? Have you looked at it in freeview?
On 11/11/2019 7:39 PM, Bronwyn Overs wrote:
External Email - Use Caution
Dear Freesurfer Mailing List,
I have completed an LME analysis in matlab and have generated a number of different cluster summary files for my various contrasts. In many of resulting cluster summary files the 'Max' value for the largest cluster which encompasses most of the brain surface is reported as infinity ('-inf'). Please find an example file attached. As I was hoping to use these values to generate effect size estimates, can you please tell me what alternate value I could substitute here for 'Max'?
Kind regards,
Bronwyn Overs
Research Assistant
Neuroscience Research Australia Margarete Ainsworth Building Barker Street Randwick Sydney NSW 2031 Australia *M* 0411 308 769 *T* +61 2 9399 1725
neura.edu.au [ http://neura.edu.au/ | http://neura.edu.au/ ]
Twitter [ https://twitter.com/neuraustralia | https://twitter.com/neuraustralia ] | Facebook [ https://www.facebook.com/NeuroscienceResearchAustralia | https://www.facebook.com/NeuroscienceResearchAustralia ] | Subscribe [ http://www.neura.edu.au/help-research/subscribe | http://www.neura.edu.au/help-research/subscribe ]
Freesurfer mailing list [ mailto:Freesurfer@nmr.mgh.harvard.edu | Freesurfer@nmr.mgh.harvard.edu ] [ mailto:Freesurfer@nmr.mgh.harvard.edu | mailto:Freesurfer@nmr.mgh.harvard.edu ] [ https://mail.nmr.mgh.harvard.edu/mailman/listinfo/freesurfer | https://mail.nmr.mgh.harvard.edu/mailman/listinfo/freesurfer ]
Freesurfer mailing list [ mailto:Freesurfer@nmr.mgh.harvard.edu | Freesurfer@nmr.mgh.harvard.edu ] [ https://mail.nmr.mgh.harvard.edu/mailman/listinfo/freesurfer | https://mail.nmr.mgh.harvard.edu/mailman/listinfo/freesurfer ]
Freesurfer mailing list [ mailto:Freesurfer@nmr.mgh.harvard.edu | Freesurfer@nmr.mgh.harvard.edu ] [ https://mail.nmr.mgh.harvard.edu/mailman/listinfo/freesurfer | https://mail.nmr.mgh.harvard.edu/mailman/listinfo/freesurfer ]
_______________________________________________ Freesurfer mailing list [ mailto:Freesurfer@nmr.mgh.harvard.edu | Freesurfer@nmr.mgh.harvard.edu ] [ https://mail.nmr.mgh.harvard.edu/mailman/listinfo/freesurfer | https://mail.nmr.mgh.harvard.edu/mailman/listinfo/freesurfer ]
_______________________________________________ Freesurfer mailing list [ mailto:Freesurfer@nmr.mgh.harvard.edu | Freesurfer@nmr.mgh.harvard.edu ] [ https://mail.nmr.mgh.harvard.edu/mailman/listinfo/freesurfer | https://mail.nmr.mgh.harvard.edu/mailman/listinfo/freesurfer ]
_______________________________________________ Freesurfer mailing list [ mailto:Freesurfer@nmr.mgh.harvard.edu | Freesurfer@nmr.mgh.harvard.edu ] [ https://mail.nmr.mgh.harvard.edu/mailman/listinfo/freesurfer | https://mail.nmr.mgh.harvard.edu/mailman/listinfo/freesurfer ]
BQ_END
_______________________________________________ Freesurfer mailing list Freesurfer@nmr.mgh.harvard.edu https://mail.nmr.mgh.harvard.edu/mailman/listinfo/freesurfer
External Email - Use Caution
Hello,
and thanks for the explanation!
Here's my first impression:
I do not think that there is a really satisfying solution given these particular stats maps and the effect size measure you describe.
I may be missing something, but I also have to admit that it is not immediately clear to me what motivates the choice of cohen's d (and the calculation you describe) in the current scenario - I've always thought of it as a measure of 'difference in means'.
In a regression context, I would personally look for a measure of the "variance-explained" type. There seem to be at least two papers (Xu, 2003, Statistics in Medicine, and Selya, 2012, Frontiers) that cover these for mixed effects models. The calculation/implementation of these measures seems to be, however, not as straightforward as for classical multiple regression models; and as far as I can see, it would also involve fitting Null or reduced models, and thus running analyses again.
By far the easiest and most straightforward way in my eyes is to report unstandardized effect sizes, i.e. beta estimates, as you have clearly interpretable main variables (group and time) with intuitive units that should be comparable across studies from your field. So maybe this is an argument not to standardize, and to state the effect size in terms of "change in thickness per year" etc.?
Best regards,
Kersten
On Do, 2019-11-28 at 11:29 +1100, Bronwyn Overs wrote: Hi Kersten,
No problem at al and thank you for your reply. While running my correction for multiple comparisons I store the df associated with each contrast vector using the following:
[~,~,dflh] = find(F_lhstats.df(2,:)); [~,~,dfrh] = find(F_rhstats.df(2,:)); dfmodelh = {floor(mode(dflh))}; dfmoderh = {floor(mode(dfrh))};
So far the dfmodelh and dfmoderh have been identical. I then calculate the effect size for each cluster using the following steps: 1. Derive the p-value from the Max threshold ('Max'), where p = 10 to the power of -abs(Max) 2. Calculate the t-value associated with this p-value, using the relevant df for this contrast 3. Calculate cohen's d using 't' and 'df', where d = (t*2)/(sqrt(df))
When the Max threshold is listed as -inf I cannot complete these calculations. Can you suggest an alternate method for generating effect sizes for these clusters?
Kind regards,
Bronwyn Overs
Research Assistant
[cid:1574977195.32275.38.camel@dzne.de]
Neuroscience Research Australia Margarete Ainsworth Building Barker Street Randwick Sydney NSW 2031 Australia M 0411 308 769 T +61 2 9399 1725
neura.edu.au http://neura.edu.au/
Twitterhttps://twitter.com/neuraustralia | Facebookhttps://www.facebook.com/NeuroscienceResearchAustralia | Subscribehttp://www.neura.edu.au/help-research/subscribe
________________________________ From: "Kersten Diers, DZNE" Kersten.Diers@dzne.de To: "Freesurfer support list" freesurfer@nmr.mgh.harvard.edu Sent: Thursday, November 28, 2019 12:29:18 AM Subject: Re: [Freesurfer] Max threshold marked as '-inf' in cluster summary file
External Email - Use Caution
Hi Bronwyn, Doug,
sorry - I missed the other mail from two weeks ago (and have been absent for a few days), but I'm able to take a look now.
You mention that your goal is to calculate effect sizes. Could you briefly let us know how you are planning to do it - this would help me to better understand the issue.
Thanks,
Kersten
On Di, 2019-11-26 at 23:14 +0000, Greve, Douglas N.,Ph.D. wrote: can you send the cluster summary file?
On 11/24/2019 7:09 PM, Bronwyn Overs wrote:
External Email - Use Caution
Hi Kersten,
Following on from Douglas's reply, you may remember my analysis as I forwarded you some files in October (see https://www.mail-archive.com/freesurfer@nmr.mgh.harvard.edu/msg64148.html). I followed your suggestions of removing the '--thmax 5' argument form 'mri_surfcluster', and now the labels generated by 'mri_label2label' overlap perfectly with the significance maps from the LME. However, now my largest clusters have a maximum threshold of '-inf' in my cluster summary files. Do you have any idea how to get around this problem so that I can use my max threshold values to calculate cluster-wise effect sizes?
Kind regards,
Bronwyn Overs
Research Assistant
[cid:1574977195.32275.38.camel@dzne.de]
Neuroscience Research Australia Margarete Ainsworth Building Barker Street Randwick Sydney NSW 2031 Australia M 0411 308 769 T +61 2 9399 1725
neura.edu.au http://neura.edu.au/
Twitterhttps://twitter.com/neuraustralia | Facebookhttps://www.facebook.com/NeuroscienceResearchAustralia | Subscribehttp://www.neura.edu.au/help-research/subscribe
________________________________ From: "Greve, Douglas N.,Ph.D." DGREVE@mgh.harvard.edumailto:DGREVE@mgh.harvard.edu To: "Freesurfer support list" freesurfer@nmr.mgh.harvard.edumailto:freesurfer@nmr.mgh.harvard.edu, "Kersten Diers, DZNE" Kersten.Diers@dzne.demailto:Kersten.Diers@dzne.de Sent: Thursday, November 14, 2019 4:23:12 AM Subject: Re: [Freesurfer] Max threshold marked as '-inf' in cluster summary file
I'll have to leave this one for Kersten as it appears that the LME stuff is generating and inf value
On 11/12/19 7:05 PM, Bronwyn Overs wrote:
External Email - Use CautionHi Douglas,
Yes I have looked at it in Freeview and I have attached a screenshot for your reference.
The /fsdata/lme/thickness/rh.thickness.B1B7.mgh file was generated with a mass-univariate spatiotemporal model using 'lme_mass_fit_EMinit' and then FDR correction was applied across both hemispheres (lme_mass_FDR). I have provided analysis details and syntax below. The B1B7 contrast represents the affect of years in cases.
Sample: Our sample includes 112 controls subjects, and 106 cases. All subjects are aged between 12 and 30 years. 153 or these subjects have 2 time-points (77 control, 76 cases), while the remaining 65 individuals have only 1 MRI time-point. We also have mixed ethnicites - 165 Caucasians, 23 Asians, and 30 mixed (Asians-Caucasians).
The QDEC file contains the following 6 variables:
- Y (years between scans)
- A (baseline age)
- G (group, 1=case, 0=control)
- S (sex, 1=female, 0=male)
- E1 (Ethnicity 1, 1=asian, 0=other)
- E2 (Ethnicity 1, 1=mixed-asian-caucasian, 0=other)
Design matrix: [ones(length(M),1) M M(:,1).*M(:,3)] i.e. main effects for each of the qdec variables + an interaction term for years X group
DVs: Cortical thickness, area and volume
Model: Mass-univariate spatiotemporal model using 'lme_mass_fit_EMinit' CODE: % Read in surface files [Y,mri] = fs_read_Y(mgh); % Read in qdec file Qdec = fReadQdec(qdec); % Remove fsid from qdec Qdec = rmQdecCol(Qdec,1); % Store col 1 (fsid-base) in sID variable sID = Qdec(2:end,1); % Remove col 1 (fsid-base) from Qdec array Qdec = rmQdecCol(Qdec,1); % Convert Qdec to numeric matrix M M = Qdec2num(Qdec); % Sort data and evaluate design matrix [M,Y,ni] = sortData(M,1,Y,sID); X = eval([ones(length(M),1) M M(:,1).*M(:,3)]) % Compute vertex-wise temporal covariance estimates. [Th0, Re] = lme_mass_fit_EMinit(X,[1],Y,ni,cortex,3); %Segmentation and model fitting. [Rgs, RgMeans, stats] = fit(Th0, Re, [1], sphere, cortex, X, Y, ni); %Check surfaces. surfcomp(Th0, RgMeans, sphere, fig1, fig2)
Correction for multiple comparisons: FDR across both hemispheres CODE: P = [ F_lhstats.pval(lhcortex) F_rhstats.pval(rhcortex) ]; G = [ F_lhstats.sgn(lhcortex) F_rhstats.sgn(rhcortex) ]; [detvtx, sided_pval, pth] = lme_mass_FDR2(P,G,[],0.05,0); altfdr(r,2) = num2cell(abs(log10(lme_mass_FDR(P,0.05)))); pcor = -log10(pth); [~,~,dflh] = find(F_lhstats.df(2,:)); [~,~,dfrh] = find(F_rhstats.df(2,:)); dfmodelh(r,2) = {floor(mode(dflh))}; dfmoderh(r,2) = {floor(mode(dfrh))}; thrlh(r,2) = {pcor}; thrrh(r,2) = {pcor}; [~,dc] = size(detvtx); dvtx(r,2) = {dc};
Kind regards,
Bronwyn Overs
Research Assistant
Neuroscience Research Australia Margarete Ainsworth Building Barker Street Randwick Sydney NSW 2031 Australia *M* 0411 308 769 *T* +61 2 9399 1725
neura.edu.au http://neura.edu.au/http://neura.edu.au/
Twitter https://twitter.com/neuraustraliahttps://twitter.com/neuraustralia | Facebook https://www.facebook.com/NeuroscienceResearchAustraliahttps://www.facebook.com/NeuroscienceResearchAustralia | Subscribe http://www.neura.edu.au/help-research/subscribehttp://www.neura.edu.au/help-research/subscribe
*From: *"Greve, Douglas N.,Ph.D." DGREVE@mgh.harvard.edumailto:DGREVE@mgh.harvard.edu *To: *"Freesurfer support list" freesurfer@nmr.mgh.harvard.edumailto:freesurfer@nmr.mgh.harvard.edu *Sent: *Wednesday, November 13, 2019 2:44:25 AM *Subject: *Re: [Freesurfer] Max threshold marked as '-inf' in cluster summary file
It looks like you have one gigantic cluster with a value of -inf at vertex 41. How did you generate /fsdata/lme/thickness/rh.thickness.B1B7.mgh ? Have you looked at it in freeview?
On 11/11/2019 7:39 PM, Bronwyn Overs wrote:
        External Email - Use Caution

Dear Freesurfer Mailing List,

I have completed an LME analysis in matlab and have generated a
number of different cluster summary files for my various
contrasts. In many of resulting cluster summary files the 'Max'
value for the largest cluster which encompasses most of the brain
surface is reported as infinity ('-inf'). Please find an example
file attached. As I was hoping to use these values to generate
effect size estimates, can you please tell me what alternate value
I could substitute here for 'Max'?

Kind regards,


Bronwyn Overs

Research Assistant


Neuroscience Research Australia
Margarete Ainsworth Building
Barker Street Randwick Sydney NSW 2031 Australia
*M* 0411 308 769 *T* +61 2 9399 1725


neura.edu.au <http://neura.edu.au/><http://neura.edu.au/>

Twitter <https://twitter.com/neuraustralia><https://twitter.com/neuraustralia> | Facebook
<https://www.facebook.com/NeuroscienceResearchAustralia><https://www.facebook.com/NeuroscienceResearchAustralia> |
Subscribe <http://www.neura.edu.au/help-research/subscribe><http://www.neura.edu.au/help-research/subscribe>


_______________________________________________
Freesurfer mailing list
Freesurfer@nmr.mgh.harvard.edu<mailto:Freesurfer@nmr.mgh.harvard.edu>  <mailto:Freesurfer@nmr.mgh.harvard.edu><mailto:Freesurfer@nmr.mgh.harvard.edu>
https://mail.nmr.mgh.harvard.edu/mailman/listinfo/freesurfer
Freesurfer mailing list Freesurfer@nmr.mgh.harvard.edumailto:Freesurfer@nmr.mgh.harvard.edu https://mail.nmr.mgh.harvard.edu/mailman/listinfo/freesurfer
Freesurfer mailing list Freesurfer@nmr.mgh.harvard.edumailto:Freesurfer@nmr.mgh.harvard.edu https://mail.nmr.mgh.harvard.edu/mailman/listinfo/freesurfer
_______________________________________________ Freesurfer mailing list Freesurfer@nmr.mgh.harvard.edumailto:Freesurfer@nmr.mgh.harvard.edu https://mail.nmr.mgh.harvard.edu/mailman/listinfo/freesurfer
_______________________________________________ Freesurfer mailing list Freesurfer@nmr.mgh.harvard.edumailto:Freesurfer@nmr.mgh.harvard.edu https://mail.nmr.mgh.harvard.edu/mailman/listinfo/freesurfer
_______________________________________________ Freesurfer mailing list Freesurfer@nmr.mgh.harvard.edumailto:Freesurfer@nmr.mgh.harvard.edu https://mail.nmr.mgh.harvard.edu/mailman/listinfo/freesurfer
_______________________________________________ Freesurfer mailing list Freesurfer@nmr.mgh.harvard.edu https://mail.nmr.mgh.harvard.edu/mailman/listinfo/freesurfer
External Email - Use Caution
Hi Kersten,
Thank you this is a good suggestion. Where can I get the unstandardized beta values for the lme I have already run? Also, i'm not really sure how to interpret the unstandardized beta values for interaction effects like group X years, do you have any suggestions? Finally, do you know why the max vertex is listed as '-inf' for my largets cluster and is this a problem at all?
Kind regards,
Bronwyn Overs
Research Assistant
Neuroscience Research Australia Margarete Ainsworth Building Barker Street Randwick Sydney NSW 2031 Australia M 0411 308 769 T +61 2 9399 1725
[ http://neura.edu.au/ | neura.edu.au ]
[ https://twitter.com/neuraustralia | Twitter ] | [ https://www.facebook.com/NeuroscienceResearchAustralia | Facebook ] | [ http://www.neura.edu.au/help-research/subscribe | Subscribe ]
From: "Kersten Diers, DZNE" Kersten.Diers@dzne.de To: "Bronwyn Overs" b.overs@neura.edu.au Cc: "Freesurfer support list" freesurfer@nmr.mgh.harvard.edu Sent: Friday, November 29, 2019 8:39:55 AM Subject: Re: [Freesurfer] Max threshold marked as '-inf' in cluster summary file
Hello,
and thanks for the explanation!
Here's my first impression:
I do not think that there is a really satisfying solution given these particular stats maps and the effect size measure you describe.
I may be missing something, but I also have to admit that it is not immediately clear to me what motivates the choice of cohen's d (and the calculation you describe) in the current scenario - I've always thought of it as a measure of 'difference in means'.
In a regression context, I would personally look for a measure of the "variance-explained" type. There seem to be at least two papers (Xu, 2003, Statistics in Medicine, and Selya, 2012, Frontiers) that cover these for mixed effects models. The calculation/implementation of these measures seems to be, however, not as straightforward as for classical multiple regression models; and as far as I can see, it would also involve fitting Null or reduced models, and thus running analyses again.
By far the easiest and most straightforward way in my eyes is to report unstandardized effect sizes, i.e. beta estimates, as you have clearly interpretable main variables (group and time) with intuitive units that should be comparable across studies from your field. So maybe this is an argument not to standardize, and to state the effect size in terms of "change in thickness per year" etc.?
Best regards,
Kersten
On Do, 2019-11-28 at 11:29 +1100, Bronwyn Overs wrote:
Hi Kersten,
No problem at al and thank you for your reply. While running my correction for multiple comparisons I store the df associated with each contrast vector using the following:
[~,~,dflh] = find(F_lhstats.df(2,:)); [~,~,dfrh] = find(F_rhstats.df(2,:)); dfmodelh = {floor(mode(dflh))}; dfmoderh = {floor(mode(dfrh))};
So far the dfmodelh and dfmoderh have been identical. I then calculate the effect size for each cluster using the following steps: 1. Derive the p-value from the Max threshold ('Max'), where p = 10 to the power of -abs(Max) 2. Calculate the t-value associated with this p-value, using the relevant df for this contrast 3. Calculate cohen's d using 't' and 'df', where d = (t*2)/(sqrt(df))
When the Max threshold is listed as -inf I cannot complete these calculations. Can you suggest an alternate method for generating effect sizes for these clusters?
Kind regards,
Bronwyn Overs
Research Assistant
Neuroscience Research Australia Margarete Ainsworth Building Barker Street Randwick Sydney NSW 2031 Australia M 0411 308 769 T +61 2 9399 1725
[ http://neura.edu.au/ | neura.edu.au ]
[ https://twitter.com/neuraustralia | Twitter ] | [ https://www.facebook.com/NeuroscienceResearchAustralia | Facebook ] | [ http://www.neura.edu.au/help-research/subscribe | Subscribe ]
From: "Kersten Diers, DZNE" Kersten.Diers@dzne.de To: "Freesurfer support list" freesurfer@nmr.mgh.harvard.edu Sent: Thursday, November 28, 2019 12:29:18 AM Subject: Re: [Freesurfer] Max threshold marked as '-inf' in cluster summary file
External Email - Use Caution
Hi Bronwyn, Doug,
sorry - I missed the other mail from two weeks ago (and have been absent for a few days), but I'm able to take a look now.
You mention that your goal is to calculate effect sizes. Could you briefly let us know how you are planning to do it - this would help me to better understand the issue.
Thanks,
Kersten
On Di, 2019-11-26 at 23:14 +0000, Greve, Douglas N.,Ph.D. wrote:
BQ_BEGIN can you send the cluster summary file?
On 11/24/2019 7:09 PM, Bronwyn Overs wrote:
BQ_BEGIN
External Email - Use Caution Hi Kersten,
Following on from Douglas's reply, you may remember my analysis as I forwarded you some files in October (see [ https://www.mail-archive.com/freesurfer@nmr.mgh.harvard.edu/msg64148.html | https://www.mail-archive.com/freesurfer@nmr.mgh.harvard.edu/msg64148.html ] ). I followed your suggestions of removing the '--thmax 5' argument form 'mri_surfcluster', and now the labels generated by 'mri_label2label' overlap perfectly with the significance maps from the LME. However, now my largest clusters have a maximum threshold of '-inf' in my cluster summary files. Do you have any idea how to get around this problem so that I can use my max threshold values to calculate cluster-wise effect sizes?
Kind regards,
Bronwyn Overs
Research Assistant
Neuroscience Research Australia Margarete Ainsworth Building Barker Street Randwick Sydney NSW 2031 Australia M 0411 308 769 T +61 2 9399 1725
[ http://neura.edu.au/ | neura.edu.au ]
[ https://twitter.com/neuraustralia | Twitter ] | [ https://www.facebook.com/NeuroscienceResearchAustralia | Facebook ] | [ http://www.neura.edu.au/help-research/subscribe | Subscribe ]
From: "Greve, Douglas N.,Ph.D." [ mailto:DGREVE@mgh.harvard.edu | DGREVE@mgh.harvard.edu ] To: "Freesurfer support list" [ mailto:freesurfer@nmr.mgh.harvard.edu | freesurfer@nmr.mgh.harvard.edu ] , "Kersten Diers, DZNE" [ mailto:Kersten.Diers@dzne.de | Kersten.Diers@dzne.de ] Sent: Thursday, November 14, 2019 4:23:12 AM Subject: Re: [Freesurfer] Max threshold marked as '-inf' in cluster summary file
I'll have to leave this one for Kersten as it appears that the LME stuff is generating and inf value
On 11/12/19 7:05 PM, Bronwyn Overs wrote:
External Email - Use Caution
Hi Douglas,
Yes I have looked at it in Freeview and I have attached a screenshot for your reference.
The /fsdata/lme/thickness/rh.thickness.B1B7.mgh file was generated with a mass-univariate spatiotemporal model using 'lme_mass_fit_EMinit' and then FDR correction was applied across both hemispheres (lme_mass_FDR). I have provided analysis details and syntax below. The B1B7 contrast represents the affect of years in cases.
Sample: Our sample includes 112 controls subjects, and 106 cases. All subjects are aged between 12 and 30 years. 153 or these subjects have 2 time-points (77 control, 76 cases), while the remaining 65 individuals have only 1 MRI time-point. We also have mixed ethnicites - 165 Caucasians, 23 Asians, and 30 mixed (Asians-Caucasians).
The QDEC file contains the following 6 variables:
- Y (years between scans)
- A (baseline age)
- G (group, 1=case, 0=control)
- S (sex, 1=female, 0=male)
- E1 (Ethnicity 1, 1=asian, 0=other)
- E2 (Ethnicity 1, 1=mixed-asian-caucasian, 0=other)
Design matrix: [ones(length(M),1) M M(:,1).*M(:,3)] i.e. main effects for each of the qdec variables + an interaction term for years X group
DVs: Cortical thickness, area and volume
Model: Mass-univariate spatiotemporal model using 'lme_mass_fit_EMinit' CODE: % Read in surface files [Y,mri] = fs_read_Y(mgh); % Read in qdec file Qdec = fReadQdec(qdec); % Remove fsid from qdec Qdec = rmQdecCol(Qdec,1); % Store col 1 (fsid-base) in sID variable sID = Qdec(2:end,1); % Remove col 1 (fsid-base) from Qdec array Qdec = rmQdecCol(Qdec,1); % Convert Qdec to numeric matrix M M = Qdec2num(Qdec); % Sort data and evaluate design matrix [M,Y,ni] = sortData(M,1,Y,sID); X = eval([ones(length(M),1) M M(:,1).*M(:,3)]) % Compute vertex-wise temporal covariance estimates. [Th0, Re] = lme_mass_fit_EMinit(X,[1],Y,ni,cortex,3); %Segmentation and model fitting. [Rgs, RgMeans, stats] = fit(Th0, Re, [1], sphere, cortex, X, Y, ni); %Check surfaces. surfcomp(Th0, RgMeans, sphere, fig1, fig2)
Correction for multiple comparisons: FDR across both hemispheres CODE: P = [ F_lhstats.pval(lhcortex) F_rhstats.pval(rhcortex) ]; G = [ F_lhstats.sgn(lhcortex) F_rhstats.sgn(rhcortex) ]; [detvtx, sided_pval, pth] = lme_mass_FDR2(P,G,[],0.05,0); altfdr(r,2) = num2cell(abs(log10(lme_mass_FDR(P,0.05)))); pcor = -log10(pth); [~,~,dflh] = find(F_lhstats.df(2,:)); [~,~,dfrh] = find(F_rhstats.df(2,:)); dfmodelh(r,2) = {floor(mode(dflh))}; dfmoderh(r,2) = {floor(mode(dfrh))}; thrlh(r,2) = {pcor}; thrrh(r,2) = {pcor}; [~,dc] = size(detvtx); dvtx(r,2) = {dc};
Kind regards,
Bronwyn Overs
Research Assistant
Neuroscience Research Australia Margarete Ainsworth Building Barker Street Randwick Sydney NSW 2031 Australia *M* 0411 308 769 *T* +61 2 9399 1725
neura.edu.au [ http://neura.edu.au/ |
Twitter [ https://twitter.com/neuraustralia |
https://twitter.com/neuraustralia ] | Facebook
https://www.facebook.com/NeuroscienceResearchAustralia ] | Subscribe
http://www.neura.edu.au/help-research/subscribe ]
*From: *"Greve, Douglas N.,Ph.D." [ mailto:DGREVE@mgh.harvard.edu |
*To: *"Freesurfer support list" [ mailto:freesurfer@nmr.mgh.harvard.edu |
freesurfer@nmr.mgh.harvard.edu ]
*Sent: *Wednesday, November 13, 2019 2:44:25 AM *Subject: *Re: [Freesurfer] Max threshold marked as '-inf' in cluster summary file
It looks like you have one gigantic cluster with a value of -inf at vertex 41. How did you generate /fsdata/lme/thickness/rh.thickness.B1B7.mgh ? Have you looked at it in freeview?
On 11/11/2019 7:39 PM, Bronwyn Overs wrote:
External Email - Use Caution
Dear Freesurfer Mailing List,
I have completed an LME analysis in matlab and have generated a number of different cluster summary files for my various contrasts. In many of resulting cluster summary files the 'Max' value for the largest cluster which encompasses most of the brain surface is reported as infinity ('-inf'). Please find an example file attached. As I was hoping to use these values to generate effect size estimates, can you please tell me what alternate value I could substitute here for 'Max'?
Kind regards,
Bronwyn Overs
Research Assistant
Neuroscience Research Australia Margarete Ainsworth Building Barker Street Randwick Sydney NSW 2031 Australia *M* 0411 308 769 *T* +61 2 9399 1725
neura.edu.au [ http://neura.edu.au/ |
Twitter [ https://twitter.com/neuraustralia |
https://twitter.com/neuraustralia ] | Facebook
https://www.facebook.com/NeuroscienceResearchAustralia ] |
Subscribe [ http://www.neura.edu.au/help-research/subscribe |
http://www.neura.edu.au/help-research/subscribe ]
Freesurfer mailing list [ mailto:Freesurfer@nmr.mgh.harvard.edu |
Freesurfer@nmr.mgh.harvard.edu ] [ mailto:Freesurfer@nmr.mgh.harvard.edu | mailto:Freesurfer@nmr.mgh.harvard.edu ]
[ https://mail.nmr.mgh.harvard.edu/mailman/listinfo/freesurfer |
https://mail.nmr.mgh.harvard.edu/mailman/listinfo/freesurfer ]
Freesurfer mailing list [ mailto:Freesurfer@nmr.mgh.harvard.edu |
Freesurfer@nmr.mgh.harvard.edu ]
[ https://mail.nmr.mgh.harvard.edu/mailman/listinfo/freesurfer |
https://mail.nmr.mgh.harvard.edu/mailman/listinfo/freesurfer ]
Freesurfer mailing list [ mailto:Freesurfer@nmr.mgh.harvard.edu |
Freesurfer@nmr.mgh.harvard.edu ]
[ https://mail.nmr.mgh.harvard.edu/mailman/listinfo/freesurfer |
https://mail.nmr.mgh.harvard.edu/mailman/listinfo/freesurfer ]
_______________________________________________ Freesurfer mailing list [ mailto:Freesurfer@nmr.mgh.harvard.edu | Freesurfer@nmr.mgh.harvard.edu ] [ https://mail.nmr.mgh.harvard.edu/mailman/listinfo/freesurfer | https://mail.nmr.mgh.harvard.edu/mailman/listinfo/freesurfer ]
_______________________________________________ Freesurfer mailing list [ mailto:Freesurfer@nmr.mgh.harvard.edu | Freesurfer@nmr.mgh.harvard.edu ] [ https://mail.nmr.mgh.harvard.edu/mailman/listinfo/freesurfer | https://mail.nmr.mgh.harvard.edu/mailman/listinfo/freesurfer ]
_______________________________________________ Freesurfer mailing list [ mailto:Freesurfer@nmr.mgh.harvard.edu | Freesurfer@nmr.mgh.harvard.edu ] [ https://mail.nmr.mgh.harvard.edu/mailman/listinfo/freesurfer | https://mail.nmr.mgh.harvard.edu/mailman/listinfo/freesurfer ]
BQ_END
_______________________________________________ Freesurfer mailing list Freesurfer@nmr.mgh.harvard.edu https://mail.nmr.mgh.harvard.edu/mailman/listinfo/freesurfer
BQ_END
External Email - Use Caution
Hi,
please see my inline responses below.
Best,
Kersten
On Fr, 2019-11-29 at 13:20 +1100, Bronwyn Overs wrote: Hi Kersten,
Thank you this is a good suggestion. Where can I get the unstandardized beta values for the lme I have already run?
They are in e.g. lhstats(i).Bhat; see the tutorial webpage for some explanation.
Also, i'm not really sure how to interpret the unstandardized beta values for interaction effects like group X years, do you have any suggestions?
This would model a difference in slopes, right? So the beta value should reflect difference between the two particular groups of this contrast per year (if year is the unit of time).
Finally, do you know why the max vertex is listed as '-inf' for my largets cluster and is this a problem at all?
I can only speculate here, but it's probably worth checking: A sig value of 'Inf' would correspond to a p-value of (exactly) zero. So, one might investigate if any zeros are contained within the p-value arrays / maps, and if these zeros (if any) reflect the outcome of a statistical test (then it should be no problem) or if they were erroneously introduced.
Kind regards,
Bronwyn Overs
Research Assistant
[X]
Neuroscience Research Australia Margarete Ainsworth Building Barker Street Randwick Sydney NSW 2031 Australia M 0411 308 769 T +61 2 9399 1725
neura.edu.au http://neura.edu.au/
Twitterhttps://twitter.com/neuraustralia | Facebookhttps://www.facebook.com/NeuroscienceResearchAustralia | Subscribehttp://www.neura.edu.au/help-research/subscribe
________________________________ From: "Kersten Diers, DZNE" Kersten.Diers@dzne.de To: "Bronwyn Overs" b.overs@neura.edu.au Cc: "Freesurfer support list" freesurfer@nmr.mgh.harvard.edu Sent: Friday, November 29, 2019 8:39:55 AM Subject: Re: [Freesurfer] Max threshold marked as '-inf' in cluster summary file
Hello,
and thanks for the explanation!
Here's my first impression:
I do not think that there is a really satisfying solution given these particular stats maps and the effect size measure you describe.
I may be missing something, but I also have to admit that it is not immediately clear to me what motivates the choice of cohen's d (and the calculation you describe) in the current scenario - I've always thought of it as a measure of 'difference in means'.
In a regression context, I would personally look for a measure of the "variance-explained" type. There seem to be at least two papers (Xu, 2003, Statistics in Medicine, and Selya, 2012, Frontiers) that cover these for mixed effects models. The calculation/implementation of these measures seems to be, however, not as straightforward as for classical multiple regression models; and as far as I can see, it would also involve fitting Null or reduced models, and thus running analyses again.
By far the easiest and most straightforward way in my eyes is to report unstandardized effect sizes, i.e. beta estimates, as you have clearly interpretable main variables (group and time) with intuitive units that should be comparable across studies from your field. So maybe this is an argument not to standardize, and to state the effect size in terms of "change in thickness per year" etc.?
Best regards,
Kersten
On Do, 2019-11-28 at 11:29 +1100, Bronwyn Overs wrote: Hi Kersten,
No problem at al and thank you for your reply. While running my correction for multiple comparisons I store the df associated with each contrast vector using the following:
[~,~,dflh] = find(F_lhstats.df(2,:)); [~,~,dfrh] = find(F_rhstats.df(2,:)); dfmodelh = {floor(mode(dflh))}; dfmoderh = {floor(mode(dfrh))};
So far the dfmodelh and dfmoderh have been identical. I then calculate the effect size for each cluster using the following steps: 1. Derive the p-value from the Max threshold ('Max'), where p = 10 to the power of -abs(Max) 2. Calculate the t-value associated with this p-value, using the relevant df for this contrast 3. Calculate cohen's d using 't' and 'df', where d = (t*2)/(sqrt(df))
When the Max threshold is listed as -inf I cannot complete these calculations. Can you suggest an alternate method for generating effect sizes for these clusters?
Kind regards,
Bronwyn Overs
Research Assistant
[X]
Neuroscience Research Australia Margarete Ainsworth Building Barker Street Randwick Sydney NSW 2031 Australia M 0411 308 769 T +61 2 9399 1725
neura.edu.au http://neura.edu.au/
Twitterhttps://twitter.com/neuraustralia | Facebookhttps://www.facebook.com/NeuroscienceResearchAustralia | Subscribehttp://www.neura.edu.au/help-research/subscribe
________________________________ From: "Kersten Diers, DZNE" Kersten.Diers@dzne.de To: "Freesurfer support list" freesurfer@nmr.mgh.harvard.edu Sent: Thursday, November 28, 2019 12:29:18 AM Subject: Re: [Freesurfer] Max threshold marked as '-inf' in cluster summary file
External Email - Use Caution
Hi Bronwyn, Doug,
sorry - I missed the other mail from two weeks ago (and have been absent for a few days), but I'm able to take a look now.
You mention that your goal is to calculate effect sizes. Could you briefly let us know how you are planning to do it - this would help me to better understand the issue.
Thanks,
Kersten
On Di, 2019-11-26 at 23:14 +0000, Greve, Douglas N.,Ph.D. wrote: can you send the cluster summary file?
On 11/24/2019 7:09 PM, Bronwyn Overs wrote:
External Email - Use Caution
Hi Kersten,
Following on from Douglas's reply, you may remember my analysis as I forwarded you some files in October (see https://www.mail-archive.com/freesurfer@nmr.mgh.harvard.edu/msg64148.html). I followed your suggestions of removing the '--thmax 5' argument form 'mri_surfcluster', and now the labels generated by 'mri_label2label' overlap perfectly with the significance maps from the LME. However, now my largest clusters have a maximum threshold of '-inf' in my cluster summary files. Do you have any idea how to get around this problem so that I can use my max threshold values to calculate cluster-wise effect sizes?
Kind regards,
Bronwyn Overs
Research Assistant
[X]
Neuroscience Research Australia Margarete Ainsworth Building Barker Street Randwick Sydney NSW 2031 Australia M 0411 308 769 T +61 2 9399 1725
neura.edu.au http://neura.edu.au/
Twitterhttps://twitter.com/neuraustralia | Facebookhttps://www.facebook.com/NeuroscienceResearchAustralia | Subscribehttp://www.neura.edu.au/help-research/subscribe
________________________________ From: "Greve, Douglas N.,Ph.D." DGREVE@mgh.harvard.edumailto:DGREVE@mgh.harvard.edu To: "Freesurfer support list" freesurfer@nmr.mgh.harvard.edumailto:freesurfer@nmr.mgh.harvard.edu, "Kersten Diers, DZNE" Kersten.Diers@dzne.demailto:Kersten.Diers@dzne.de Sent: Thursday, November 14, 2019 4:23:12 AM Subject: Re: [Freesurfer] Max threshold marked as '-inf' in cluster summary file
I'll have to leave this one for Kersten as it appears that the LME stuff is generating and inf value
On 11/12/19 7:05 PM, Bronwyn Overs wrote:
External Email - Use CautionHi Douglas,
Yes I have looked at it in Freeview and I have attached a screenshot for your reference.
The /fsdata/lme/thickness/rh.thickness.B1B7.mgh file was generated with a mass-univariate spatiotemporal model using 'lme_mass_fit_EMinit' and then FDR correction was applied across both hemispheres (lme_mass_FDR). I have provided analysis details and syntax below. The B1B7 contrast represents the affect of years in cases.
Sample: Our sample includes 112 controls subjects, and 106 cases. All subjects are aged between 12 and 30 years. 153 or these subjects have 2 time-points (77 control, 76 cases), while the remaining 65 individuals have only 1 MRI time-point. We also have mixed ethnicites - 165 Caucasians, 23 Asians, and 30 mixed (Asians-Caucasians).
The QDEC file contains the following 6 variables:
- Y (years between scans)
- A (baseline age)
- G (group, 1=case, 0=control)
- S (sex, 1=female, 0=male)
- E1 (Ethnicity 1, 1=asian, 0=other)
- E2 (Ethnicity 1, 1=mixed-asian-caucasian, 0=other)
Design matrix: [ones(length(M),1) M M(:,1).*M(:,3)] i.e. main effects for each of the qdec variables + an interaction term for years X group
DVs: Cortical thickness, area and volume
Model: Mass-univariate spatiotemporal model using 'lme_mass_fit_EMinit' CODE: % Read in surface files [Y,mri] = fs_read_Y(mgh); % Read in qdec file Qdec = fReadQdec(qdec); % Remove fsid from qdec Qdec = rmQdecCol(Qdec,1); % Store col 1 (fsid-base) in sID variable sID = Qdec(2:end,1); % Remove col 1 (fsid-base) from Qdec array Qdec = rmQdecCol(Qdec,1); % Convert Qdec to numeric matrix M M = Qdec2num(Qdec); % Sort data and evaluate design matrix [M,Y,ni] = sortData(M,1,Y,sID); X = eval([ones(length(M),1) M M(:,1).*M(:,3)]) % Compute vertex-wise temporal covariance estimates. [Th0, Re] = lme_mass_fit_EMinit(X,[1],Y,ni,cortex,3); %Segmentation and model fitting. [Rgs, RgMeans, stats] = fit(Th0, Re, [1], sphere, cortex, X, Y, ni); %Check surfaces. surfcomp(Th0, RgMeans, sphere, fig1, fig2)
Correction for multiple comparisons: FDR across both hemispheres CODE: P = [ F_lhstats.pval(lhcortex) F_rhstats.pval(rhcortex) ]; G = [ F_lhstats.sgn(lhcortex) F_rhstats.sgn(rhcortex) ]; [detvtx, sided_pval, pth] = lme_mass_FDR2(P,G,[],0.05,0); altfdr(r,2) = num2cell(abs(log10(lme_mass_FDR(P,0.05)))); pcor = -log10(pth); [~,~,dflh] = find(F_lhstats.df(2,:)); [~,~,dfrh] = find(F_rhstats.df(2,:)); dfmodelh(r,2) = {floor(mode(dflh))}; dfmoderh(r,2) = {floor(mode(dfrh))}; thrlh(r,2) = {pcor}; thrrh(r,2) = {pcor}; [~,dc] = size(detvtx); dvtx(r,2) = {dc};
Kind regards,
Bronwyn Overs
Research Assistant
Neuroscience Research Australia Margarete Ainsworth Building Barker Street Randwick Sydney NSW 2031 Australia *M* 0411 308 769 *T* +61 2 9399 1725
neura.edu.au http://neura.edu.au/http://neura.edu.au/
Twitter https://twitter.com/neuraustraliahttps://twitter.com/neuraustralia | Facebook https://www.facebook.com/NeuroscienceResearchAustraliahttps://www.facebook.com/NeuroscienceResearchAustralia | Subscribe http://www.neura.edu.au/help-research/subscribehttp://www.neura.edu.au/help-research/subscribe
*From: *"Greve, Douglas N.,Ph.D." DGREVE@mgh.harvard.edumailto:DGREVE@mgh.harvard.edu *To: *"Freesurfer support list" freesurfer@nmr.mgh.harvard.edumailto:freesurfer@nmr.mgh.harvard.edu *Sent: *Wednesday, November 13, 2019 2:44:25 AM *Subject: *Re: [Freesurfer] Max threshold marked as '-inf' in cluster summary file
It looks like you have one gigantic cluster with a value of -inf at vertex 41. How did you generate /fsdata/lme/thickness/rh.thickness.B1B7.mgh ? Have you looked at it in freeview?
On 11/11/2019 7:39 PM, Bronwyn Overs wrote:
        External Email - Use Caution

Dear Freesurfer Mailing List,

I have completed an LME analysis in matlab and have generated a
number of different cluster summary files for my various
contrasts. In many of resulting cluster summary files the 'Max'
value for the largest cluster which encompasses most of the brain
surface is reported as infinity ('-inf'). Please find an example
file attached. As I was hoping to use these values to generate
effect size estimates, can you please tell me what alternate value
I could substitute here for 'Max'?

Kind regards,


Bronwyn Overs

Research Assistant


Neuroscience Research Australia
Margarete Ainsworth Building
Barker Street Randwick Sydney NSW 2031 Australia
*M* 0411 308 769 *T* +61 2 9399 1725


neura.edu.au <http://neura.edu.au/><http://neura.edu.au/>

Twitter <https://twitter.com/neuraustralia><https://twitter.com/neuraustralia> | Facebook
<https://www.facebook.com/NeuroscienceResearchAustralia><https://www.facebook.com/NeuroscienceResearchAustralia> |
Subscribe <http://www.neura.edu.au/help-research/subscribe><http://www.neura.edu.au/help-research/subscribe>


_______________________________________________
Freesurfer mailing list
Freesurfer@nmr.mgh.harvard.edu<mailto:Freesurfer@nmr.mgh.harvard.edu>  <mailto:Freesurfer@nmr.mgh.harvard.edu><mailto:Freesurfer@nmr.mgh.harvard.edu>
https://mail.nmr.mgh.harvard.edu/mailman/listinfo/freesurfer
Freesurfer mailing list Freesurfer@nmr.mgh.harvard.edumailto:Freesurfer@nmr.mgh.harvard.edu https://mail.nmr.mgh.harvard.edu/mailman/listinfo/freesurfer
Freesurfer mailing list Freesurfer@nmr.mgh.harvard.edumailto:Freesurfer@nmr.mgh.harvard.edu https://mail.nmr.mgh.harvard.edu/mailman/listinfo/freesurfer
_______________________________________________ Freesurfer mailing list Freesurfer@nmr.mgh.harvard.edumailto:Freesurfer@nmr.mgh.harvard.edu https://mail.nmr.mgh.harvard.edu/mailman/listinfo/freesurfer
_______________________________________________ Freesurfer mailing list Freesurfer@nmr.mgh.harvard.edumailto:Freesurfer@nmr.mgh.harvard.edu https://mail.nmr.mgh.harvard.edu/mailman/listinfo/freesurfer
_______________________________________________ Freesurfer mailing list Freesurfer@nmr.mgh.harvard.edumailto:Freesurfer@nmr.mgh.harvard.edu https://mail.nmr.mgh.harvard.edu/mailman/listinfo/freesurfer
_______________________________________________ Freesurfer mailing list Freesurfer@nmr.mgh.harvard.edu https://mail.nmr.mgh.harvard.edu/mailman/listinfo/freesurfer
External Email - Use Caution
Hi Kersten,
Thank you for all of your help so far. I have now located the unstandardized beta values in lhstats(i).Bhat. Unfortunately one of the effects I was interested in was the slope for years within my case group, which required the use of the following contrast vector: 0 1 0 0 0 0 0 1
Do you know how I could estimate the effect size for this contrast given that it corresponds to two beta values (1 and 7)?
Kind regards,
Bronwyn Overs
Research Assistant
Neuroscience Research Australia Margarete Ainsworth Building Barker Street Randwick Sydney NSW 2031 Australia M 0411 308 769 T +61 2 9399 1725
[ http://neura.edu.au/ | neura.edu.au ]
[ https://twitter.com/neuraustralia | Twitter ] | [ https://www.facebook.com/NeuroscienceResearchAustralia | Facebook ] | [ http://www.neura.edu.au/help-research/subscribe | Subscribe ]
From: "Kersten Diers, DZNE" Kersten.Diers@dzne.de To: "Freesurfer support list" freesurfer@nmr.mgh.harvard.edu Sent: Saturday, November 30, 2019 6:50:26 AM Subject: Re: [Freesurfer] Max threshold marked as '-inf' in cluster summary file
External Email - Use Caution
Hi,
please see my inline responses below.
Best,
Kersten
On Fr, 2019-11-29 at 13:20 +1100, Bronwyn Overs wrote:
Hi Kersten,
Thank you this is a good suggestion. Where can I get the unstandardized beta values for the lme I have already run?
They are in e.g. lhstats(i).Bhat; see the tutorial webpage for some explanation.
BQ_BEGIN
Also, i'm not really sure how to interpret the unstandardized beta values for interaction effects like group X years, do you have any suggestions?
BQ_END
This would model a difference in slopes, right? So the beta value should reflect difference between the two particular groups of this contrast per year (if year is the unit of time).
BQ_BEGIN
Finally, do you know why the max vertex is listed as '-inf' for my largets cluster and is this a problem at all?
BQ_END
I can only speculate here, but it's probably worth checking: A sig value of 'Inf' would correspond to a p-value of (exactly) zero. So, one might investigate if any zeros are contained within the p-value arrays / maps, and if these zeros (if any) reflect the outcome of a statistical test (then it should be no problem) or if they were erroneously introduced.
BQ_BEGIN
Kind regards,
Bronwyn Overs
Research Assistant
Neuroscience Research Australia Margarete Ainsworth Building Barker Street Randwick Sydney NSW 2031 Australia M 0411 308 769 T +61 2 9399 1725
[ http://neura.edu.au/ | neura.edu.au ]
[ https://twitter.com/neuraustralia | Twitter ] | [ https://www.facebook.com/NeuroscienceResearchAustralia | Facebook ] | [ http://www.neura.edu.au/help-research/subscribe | Subscribe ]
From: "Kersten Diers, DZNE" Kersten.Diers@dzne.de To: "Bronwyn Overs" b.overs@neura.edu.au Cc: "Freesurfer support list" freesurfer@nmr.mgh.harvard.edu Sent: Friday, November 29, 2019 8:39:55 AM Subject: Re: [Freesurfer] Max threshold marked as '-inf' in cluster summary file
Hello,
and thanks for the explanation!
Here's my first impression:
I do not think that there is a really satisfying solution given these particular stats maps and the effect size measure you describe.
I may be missing something, but I also have to admit that it is not immediately clear to me what motivates the choice of cohen's d (and the calculation you describe) in the current scenario - I've always thought of it as a measure of 'difference in means'.
In a regression context, I would personally look for a measure of the "variance-explained" type. There seem to be at least two papers (Xu, 2003, Statistics in Medicine, and Selya, 2012, Frontiers) that cover these for mixed effects models. The calculation/implementation of these measures seems to be, however, not as straightforward as for classical multiple regression models; and as far as I can see, it would also involve fitting Null or reduced models, and thus running analyses again.
By far the easiest and most straightforward way in my eyes is to report unstandardized effect sizes, i.e. beta estimates, as you have clearly interpretable main variables (group and time) with intuitive units that should be comparable across studies from your field. So maybe this is an argument not to standardize, and to state the effect size in terms of "change in thickness per year" etc.?
Best regards,
Kersten
On Do, 2019-11-28 at 11:29 +1100, Bronwyn Overs wrote:
BQ_BEGIN
Hi Kersten,
No problem at al and thank you for your reply. While running my correction for multiple comparisons I store the df associated with each contrast vector using the following:
[~,~,dflh] = find(F_lhstats.df(2,:)); [~,~,dfrh] = find(F_rhstats.df(2,:)); dfmodelh = {floor(mode(dflh))}; dfmoderh = {floor(mode(dfrh))};
So far the dfmodelh and dfmoderh have been identical. I then calculate the effect size for each cluster using the following steps: 1. Derive the p-value from the Max threshold ('Max'), where p = 10 to the power of -abs(Max) 2. Calculate the t-value associated with this p-value, using the relevant df for this contrast 3. Calculate cohen's d using 't' and 'df', where d = (t*2)/(sqrt(df))
When the Max threshold is listed as -inf I cannot complete these calculations. Can you suggest an alternate method for generating effect sizes for these clusters?
Kind regards,
Bronwyn Overs
Research Assistant
Neuroscience Research Australia Margarete Ainsworth Building Barker Street Randwick Sydney NSW 2031 Australia M 0411 308 769 T +61 2 9399 1725
[ http://neura.edu.au/ | neura.edu.au ]
[ https://twitter.com/neuraustralia | Twitter ] | [ https://www.facebook.com/NeuroscienceResearchAustralia | Facebook ] | [ http://www.neura.edu.au/help-research/subscribe | Subscribe ]
From: "Kersten Diers, DZNE" Kersten.Diers@dzne.de To: "Freesurfer support list" freesurfer@nmr.mgh.harvard.edu Sent: Thursday, November 28, 2019 12:29:18 AM Subject: Re: [Freesurfer] Max threshold marked as '-inf' in cluster summary file
External Email - Use Caution
Hi Bronwyn, Doug,
sorry - I missed the other mail from two weeks ago (and have been absent for a few days), but I'm able to take a look now.
You mention that your goal is to calculate effect sizes. Could you briefly let us know how you are planning to do it - this would help me to better understand the issue.
Thanks,
Kersten
On Di, 2019-11-26 at 23:14 +0000, Greve, Douglas N.,Ph.D. wrote:
BQ_BEGIN can you send the cluster summary file?
On 11/24/2019 7:09 PM, Bronwyn Overs wrote:
BQ_BEGIN
External Email - Use Caution Hi Kersten,
Following on from Douglas's reply, you may remember my analysis as I forwarded you some files in October (see [ https://www.mail-archive.com/freesurfer@nmr.mgh.harvard.edu/msg64148.html | https://www.mail-archive.com/freesurfer@nmr.mgh.harvard.edu/msg64148.html ] ). I followed your suggestions of removing the '--thmax 5' argument form 'mri_surfcluster', and now the labels generated by 'mri_label2label' overlap perfectly with the significance maps from the LME. However, now my largest clusters have a maximum threshold of '-inf' in my cluster summary files. Do you have any idea how to get around this problem so that I can use my max threshold values to calculate cluster-wise effect sizes?
Kind regards,
Bronwyn Overs
Research Assistant
Neuroscience Research Australia Margarete Ainsworth Building Barker Street Randwick Sydney NSW 2031 Australia M 0411 308 769 T +61 2 9399 1725
[ http://neura.edu.au/ | neura.edu.au ]
[ https://twitter.com/neuraustralia | Twitter ] | [ https://www.facebook.com/NeuroscienceResearchAustralia | Facebook ] | [ http://www.neura.edu.au/help-research/subscribe | Subscribe ]
From: "Greve, Douglas N.,Ph.D." [ mailto:DGREVE@mgh.harvard.edu | DGREVE@mgh.harvard.edu ] To: "Freesurfer support list" [ mailto:freesurfer@nmr.mgh.harvard.edu | freesurfer@nmr.mgh.harvard.edu ] , "Kersten Diers, DZNE" [ mailto:Kersten.Diers@dzne.de | Kersten.Diers@dzne.de ] Sent: Thursday, November 14, 2019 4:23:12 AM Subject: Re: [Freesurfer] Max threshold marked as '-inf' in cluster summary file
I'll have to leave this one for Kersten as it appears that the LME stuff is generating and inf value
On 11/12/19 7:05 PM, Bronwyn Overs wrote:
External Email - Use Caution
Hi Douglas,
Yes I have looked at it in Freeview and I have attached a screenshot for your reference.
The /fsdata/lme/thickness/rh.thickness.B1B7.mgh file was generated with a mass-univariate spatiotemporal model using 'lme_mass_fit_EMinit' and then FDR correction was applied across both hemispheres (lme_mass_FDR). I have provided analysis details and syntax below. The B1B7 contrast represents the affect of years in cases.
Sample: Our sample includes 112 controls subjects, and 106 cases. All subjects are aged between 12 and 30 years. 153 or these subjects have 2 time-points (77 control, 76 cases), while the remaining 65 individuals have only 1 MRI time-point. We also have mixed ethnicites - 165 Caucasians, 23 Asians, and 30 mixed (Asians-Caucasians).
The QDEC file contains the following 6 variables:
- Y (years between scans)
- A (baseline age)
- G (group, 1=case, 0=control)
- S (sex, 1=female, 0=male)
- E1 (Ethnicity 1, 1=asian, 0=other)
- E2 (Ethnicity 1, 1=mixed-asian-caucasian, 0=other)
Design matrix: [ones(length(M),1) M M(:,1).*M(:,3)] i.e. main effects for each of the qdec variables + an interaction term for years X group
DVs: Cortical thickness, area and volume
Model: Mass-univariate spatiotemporal model using 'lme_mass_fit_EMinit' CODE: % Read in surface files [Y,mri] = fs_read_Y(mgh); % Read in qdec file Qdec = fReadQdec(qdec); % Remove fsid from qdec Qdec = rmQdecCol(Qdec,1); % Store col 1 (fsid-base) in sID variable sID = Qdec(2:end,1); % Remove col 1 (fsid-base) from Qdec array Qdec = rmQdecCol(Qdec,1); % Convert Qdec to numeric matrix M M = Qdec2num(Qdec); % Sort data and evaluate design matrix [M,Y,ni] = sortData(M,1,Y,sID); X = eval([ones(length(M),1) M M(:,1).*M(:,3)]) % Compute vertex-wise temporal covariance estimates. [Th0, Re] = lme_mass_fit_EMinit(X,[1],Y,ni,cortex,3); %Segmentation and model fitting. [Rgs, RgMeans, stats] = fit(Th0, Re, [1], sphere, cortex, X, Y, ni); %Check surfaces. surfcomp(Th0, RgMeans, sphere, fig1, fig2)
Correction for multiple comparisons: FDR across both hemispheres CODE: P = [ F_lhstats.pval(lhcortex) F_rhstats.pval(rhcortex) ]; G = [ F_lhstats.sgn(lhcortex) F_rhstats.sgn(rhcortex) ]; [detvtx, sided_pval, pth] = lme_mass_FDR2(P,G,[],0.05,0); altfdr(r,2) = num2cell(abs(log10(lme_mass_FDR(P,0.05)))); pcor = -log10(pth); [~,~,dflh] = find(F_lhstats.df(2,:)); [~,~,dfrh] = find(F_rhstats.df(2,:)); dfmodelh(r,2) = {floor(mode(dflh))}; dfmoderh(r,2) = {floor(mode(dfrh))}; thrlh(r,2) = {pcor}; thrrh(r,2) = {pcor}; [~,dc] = size(detvtx); dvtx(r,2) = {dc};
Kind regards,
Bronwyn Overs
Research Assistant
Neuroscience Research Australia Margarete Ainsworth Building Barker Street Randwick Sydney NSW 2031 Australia *M* 0411 308 769 *T* +61 2 9399 1725
neura.edu.au [ http://neura.edu.au/ |
Twitter [ https://twitter.com/neuraustralia |
https://twitter.com/neuraustralia ] | Facebook
https://www.facebook.com/NeuroscienceResearchAustralia ] | Subscribe
http://www.neura.edu.au/help-research/subscribe ]
*From: *"Greve, Douglas N.,Ph.D." [ mailto:DGREVE@mgh.harvard.edu |
*To: *"Freesurfer support list" [ mailto:freesurfer@nmr.mgh.harvard.edu |
freesurfer@nmr.mgh.harvard.edu ]
*Sent: *Wednesday, November 13, 2019 2:44:25 AM *Subject: *Re: [Freesurfer] Max threshold marked as '-inf' in cluster summary file
It looks like you have one gigantic cluster with a value of -inf at vertex 41. How did you generate /fsdata/lme/thickness/rh.thickness.B1B7.mgh ? Have you looked at it in freeview?
On 11/11/2019 7:39 PM, Bronwyn Overs wrote:
External Email - Use Caution
Dear Freesurfer Mailing List,
I have completed an LME analysis in matlab and have generated a number of different cluster summary files for my various contrasts. In many of resulting cluster summary files the 'Max' value for the largest cluster which encompasses most of the brain surface is reported as infinity ('-inf'). Please find an example file attached. As I was hoping to use these values to generate effect size estimates, can you please tell me what alternate value I could substitute here for 'Max'?
Kind regards,
Bronwyn Overs
Research Assistant
Neuroscience Research Australia Margarete Ainsworth Building Barker Street Randwick Sydney NSW 2031 Australia *M* 0411 308 769 *T* +61 2 9399 1725
neura.edu.au [ http://neura.edu.au/ |
Twitter [ https://twitter.com/neuraustralia |
https://twitter.com/neuraustralia ] | Facebook
https://www.facebook.com/NeuroscienceResearchAustralia ] |
Subscribe [ http://www.neura.edu.au/help-research/subscribe |
http://www.neura.edu.au/help-research/subscribe ]
Freesurfer mailing list [ mailto:Freesurfer@nmr.mgh.harvard.edu |
Freesurfer@nmr.mgh.harvard.edu ] [ mailto:Freesurfer@nmr.mgh.harvard.edu | mailto:Freesurfer@nmr.mgh.harvard.edu ]
[ https://mail.nmr.mgh.harvard.edu/mailman/listinfo/freesurfer |
https://mail.nmr.mgh.harvard.edu/mailman/listinfo/freesurfer ]
Freesurfer mailing list [ mailto:Freesurfer@nmr.mgh.harvard.edu |
Freesurfer@nmr.mgh.harvard.edu ]
[ https://mail.nmr.mgh.harvard.edu/mailman/listinfo/freesurfer |
https://mail.nmr.mgh.harvard.edu/mailman/listinfo/freesurfer ]
Freesurfer mailing list [ mailto:Freesurfer@nmr.mgh.harvard.edu |
Freesurfer@nmr.mgh.harvard.edu ]
[ https://mail.nmr.mgh.harvard.edu/mailman/listinfo/freesurfer |
https://mail.nmr.mgh.harvard.edu/mailman/listinfo/freesurfer ]
_______________________________________________ Freesurfer mailing list [ mailto:Freesurfer@nmr.mgh.harvard.edu | Freesurfer@nmr.mgh.harvard.edu ] [ https://mail.nmr.mgh.harvard.edu/mailman/listinfo/freesurfer | https://mail.nmr.mgh.harvard.edu/mailman/listinfo/freesurfer ]
_______________________________________________ Freesurfer mailing list [ mailto:Freesurfer@nmr.mgh.harvard.edu | Freesurfer@nmr.mgh.harvard.edu ] [ https://mail.nmr.mgh.harvard.edu/mailman/listinfo/freesurfer | https://mail.nmr.mgh.harvard.edu/mailman/listinfo/freesurfer ]
BQ_END
_______________________________________________ Freesurfer mailing list [ mailto:Freesurfer@nmr.mgh.harvard.edu | Freesurfer@nmr.mgh.harvard.edu ] [ https://mail.nmr.mgh.harvard.edu/mailman/listinfo/freesurfer | https://mail.nmr.mgh.harvard.edu/mailman/listinfo/freesurfer ]
BQ_END
_______________________________________________ Freesurfer mailing list Freesurfer@nmr.mgh.harvard.edu https://mail.nmr.mgh.harvard.edu/mailman/listinfo/freesurfer
BQ_END
BQ_END
_______________________________________________ Freesurfer mailing list Freesurfer@nmr.mgh.harvard.edu https://mail.nmr.mgh.harvard.edu/mailman/listinfo/freesurfer
External Email - Use Caution
Hi Bronwyn,
you can just add the two betas: it's the slope for the non-case group plus the difference in slopes between case and non-case group, so it should give the slope in the case group.
Best regards,
Kersten
On Mi, 2019-12-11 at 12:53 +1100, Bronwyn Overs wrote:
External Email - Use Caution
Hi Kersten,
Thank you for all of your help so far. I have now located the unstandardized beta values in lhstats(i).Bhat. Unfortunately one of the effects I was interested in was the slope for years within my case group, which required the use of the following contrast vector: 0 1 0 0 0 0 0 1
Do you know how I could estimate the effect size for this contrast given that it corresponds to two beta values (1 and 7)?
Kind regards,
Bronwyn Overs
Research Assistant
[cid:1576491649.30420.8.camel@dzne.de]
Neuroscience Research Australia Margarete Ainsworth Building Barker Street Randwick Sydney NSW 2031 Australia M 0411 308 769 T +61 2 9399 1725
neura.edu.au http://neura.edu.au/
Twitterhttps://twitter.com/neuraustralia | Facebookhttps://www.facebook.com/NeuroscienceResearchAustralia | Subscribehttp://www.neura.edu.au/help-research/subscribe
________________________________ From: "Kersten Diers, DZNE" Kersten.Diers@dzne.de To: "Freesurfer support list" freesurfer@nmr.mgh.harvard.edu Sent: Saturday, November 30, 2019 6:50:26 AM Subject: Re: [Freesurfer] Max threshold marked as '-inf' in cluster summary file
External Email - Use Caution
Hi,
please see my inline responses below.
Best,
Kersten
On Fr, 2019-11-29 at 13:20 +1100, Bronwyn Overs wrote: Hi Kersten,
Thank you this is a good suggestion. Where can I get the unstandardized beta values for the lme I have already run?
They are in e.g. lhstats(i).Bhat; see the tutorial webpage for some explanation.
Also, i'm not really sure how to interpret the unstandardized beta values for interaction effects like group X years, do you have any suggestions?
This would model a difference in slopes, right? So the beta value should reflect difference between the two particular groups of this contrast per year (if year is the unit of time).
Finally, do you know why the max vertex is listed as '-inf' for my largets cluster and is this a problem at all?
I can only speculate here, but it's probably worth checking: A sig value of 'Inf' would correspond to a p-value of (exactly) zero. So, one might investigate if any zeros are contained within the p-value arrays / maps, and if these zeros (if any) reflect the outcome of a statistical test (then it should be no problem) or if they were erroneously introduced.
Kind regards,
Bronwyn Overs
Research Assistant
Neuroscience Research Australia Margarete Ainsworth Building Barker Street Randwick Sydney NSW 2031 Australia M 0411 308 769 T +61 2 9399 1725
neura.edu.au http://neura.edu.au/
Twitterhttps://twitter.com/neuraustralia | Facebookhttps://www.facebook.com/NeuroscienceResearchAustralia | Subscribehttp://www.neura.edu.au/help-research/subscribe
________________________________ From: "Kersten Diers, DZNE" Kersten.Diers@dzne.de To: "Bronwyn Overs" b.overs@neura.edu.au Cc: "Freesurfer support list" freesurfer@nmr.mgh.harvard.edu Sent: Friday, November 29, 2019 8:39:55 AM Subject: Re: [Freesurfer] Max threshold marked as '-inf' in cluster summary file
Hello,
and thanks for the explanation!
Here's my first impression:
I do not think that there is a really satisfying solution given these particular stats maps and the effect size measure you describe.
I may be missing something, but I also have to admit that it is not immediately clear to me what motivates the choice of cohen's d (and the calculation you describe) in the current scenario - I've always thought of it as a measure of 'difference in means'.
In a regression context, I would personally look for a measure of the "variance-explained" type. There seem to be at least two papers (Xu, 2003, Statistics in Medicine, and Selya, 2012, Frontiers) that cover these for mixed effects models. The calculation/implementation of these measures seems to be, however, not as straightforward as for classical multiple regression models; and as far as I can see, it would also involve fitting Null or reduced models, and thus running analyses again.
By far the easiest and most straightforward way in my eyes is to report unstandardized effect sizes, i.e. beta estimates, as you have clearly interpretable main variables (group and time) with intuitive units that should be comparable across studies from your field. So maybe this is an argument not to standardize, and to state the effect size in terms of "change in thickness per year" etc.?
Best regards,
Kersten
On Do, 2019-11-28 at 11:29 +1100, Bronwyn Overs wrote: Hi Kersten,
No problem at al and thank you for your reply. While running my correction for multiple comparisons I store the df associated with each contrast vector using the following:
[~,~,dflh] = find(F_lhstats.df(2,:)); [~,~,dfrh] = find(F_rhstats.df(2,:)); dfmodelh = {floor(mode(dflh))}; dfmoderh = {floor(mode(dfrh))};
So far the dfmodelh and dfmoderh have been identical. I then calculate the effect size for each cluster using the following steps: 1. Derive the p-value from the Max threshold ('Max'), where p = 10 to the power of -abs(Max) 2. Calculate the t-value associated with this p-value, using the relevant df for this contrast 3. Calculate cohen's d using 't' and 'df', where d = (t*2)/(sqrt(df))
When the Max threshold is listed as -inf I cannot complete these calculations. Can you suggest an alternate method for generating effect sizes for these clusters?
Kind regards,
Bronwyn Overs
Research Assistant
Neuroscience Research Australia Margarete Ainsworth Building Barker Street Randwick Sydney NSW 2031 Australia M 0411 308 769 T +61 2 9399 1725
neura.edu.au http://neura.edu.au/
Twitterhttps://twitter.com/neuraustralia | Facebookhttps://www.facebook.com/NeuroscienceResearchAustralia | Subscribehttp://www.neura.edu.au/help-research/subscribe
________________________________ From: "Kersten Diers, DZNE" Kersten.Diers@dzne.de To: "Freesurfer support list" freesurfer@nmr.mgh.harvard.edu Sent: Thursday, November 28, 2019 12:29:18 AM Subject: Re: [Freesurfer] Max threshold marked as '-inf' in cluster summary file
External Email - Use Caution
Hi Bronwyn, Doug,
sorry - I missed the other mail from two weeks ago (and have been absent for a few days), but I'm able to take a look now.
You mention that your goal is to calculate effect sizes. Could you briefly let us know how you are planning to do it - this would help me to better understand the issue.
Thanks,
Kersten
On Di, 2019-11-26 at 23:14 +0000, Greve, Douglas N.,Ph.D. wrote: can you send the cluster summary file?
On 11/24/2019 7:09 PM, Bronwyn Overs wrote:
External Email - Use Caution
Hi Kersten,
Following on from Douglas's reply, you may remember my analysis as I forwarded you some files in October (see https://www.mail-archive.com/freesurfer@nmr.mgh.harvard.edu/msg64148.html). I followed your suggestions of removing the '--thmax 5' argument form 'mri_surfcluster', and now the labels generated by 'mri_label2label' overlap perfectly with the significance maps from the LME. However, now my largest clusters have a maximum threshold of '-inf' in my cluster summary files. Do you have any idea how to get around this problem so that I can use my max threshold values to calculate cluster-wise effect sizes?
Kind regards,
Bronwyn Overs
Research Assistant
Neuroscience Research Australia Margarete Ainsworth Building Barker Street Randwick Sydney NSW 2031 Australia M 0411 308 769 T +61 2 9399 1725
neura.edu.au http://neura.edu.au/
Twitterhttps://twitter.com/neuraustralia | Facebookhttps://www.facebook.com/NeuroscienceResearchAustralia | Subscribehttp://www.neura.edu.au/help-research/subscribe
________________________________ From: "Greve, Douglas N.,Ph.D." DGREVE@mgh.harvard.edumailto:DGREVE@mgh.harvard.edu To: "Freesurfer support list" freesurfer@nmr.mgh.harvard.edumailto:freesurfer@nmr.mgh.harvard.edu, "Kersten Diers, DZNE" Kersten.Diers@dzne.demailto:Kersten.Diers@dzne.de Sent: Thursday, November 14, 2019 4:23:12 AM Subject: Re: [Freesurfer] Max threshold marked as '-inf' in cluster summary file
I'll have to leave this one for Kersten as it appears that the LME stuff is generating and inf value
On 11/12/19 7:05 PM, Bronwyn Overs wrote:
External Email - Use CautionHi Douglas,
Yes I have looked at it in Freeview and I have attached a screenshot for your reference.
The /fsdata/lme/thickness/rh.thickness.B1B7.mgh file was generated with a mass-univariate spatiotemporal model using 'lme_mass_fit_EMinit' and then FDR correction was applied across both hemispheres (lme_mass_FDR). I have provided analysis details and syntax below. The B1B7 contrast represents the affect of years in cases.
Sample: Our sample includes 112 controls subjects, and 106 cases. All subjects are aged between 12 and 30 years. 153 or these subjects have 2 time-points (77 control, 76 cases), while the remaining 65 individuals have only 1 MRI time-point. We also have mixed ethnicites - 165 Caucasians, 23 Asians, and 30 mixed (Asians-Caucasians).
The QDEC file contains the following 6 variables:
- Y (years between scans)
- A (baseline age)
- G (group, 1=case, 0=control)
- S (sex, 1=female, 0=male)
- E1 (Ethnicity 1, 1=asian, 0=other)
- E2 (Ethnicity 1, 1=mixed-asian-caucasian, 0=other)
Design matrix: [ones(length(M),1) M M(:,1).*M(:,3)] i.e. main effects for each of the qdec variables + an interaction term for years X group
DVs: Cortical thickness, area and volume
Model: Mass-univariate spatiotemporal model using 'lme_mass_fit_EMinit' CODE: % Read in surface files [Y,mri] = fs_read_Y(mgh); % Read in qdec file Qdec = fReadQdec(qdec); % Remove fsid from qdec Qdec = rmQdecCol(Qdec,1); % Store col 1 (fsid-base) in sID variable sID = Qdec(2:end,1); % Remove col 1 (fsid-base) from Qdec array Qdec = rmQdecCol(Qdec,1); % Convert Qdec to numeric matrix M M = Qdec2num(Qdec); % Sort data and evaluate design matrix [M,Y,ni] = sortData(M,1,Y,sID); X = eval([ones(length(M),1) M M(:,1).*M(:,3)]) % Compute vertex-wise temporal covariance estimates. [Th0, Re] = lme_mass_fit_EMinit(X,[1],Y,ni,cortex,3); %Segmentation and model fitting. [Rgs, RgMeans, stats] = fit(Th0, Re, [1], sphere, cortex, X, Y, ni); %Check surfaces. surfcomp(Th0, RgMeans, sphere, fig1, fig2)
Correction for multiple comparisons: FDR across both hemispheres CODE: P = [ F_lhstats.pval(lhcortex) F_rhstats.pval(rhcortex) ]; G = [ F_lhstats.sgn(lhcortex) F_rhstats.sgn(rhcortex) ]; [detvtx, sided_pval, pth] = lme_mass_FDR2(P,G,[],0.05,0); altfdr(r,2) = num2cell(abs(log10(lme_mass_FDR(P,0.05)))); pcor = -log10(pth); [~,~,dflh] = find(F_lhstats.df(2,:)); [~,~,dfrh] = find(F_rhstats.df(2,:)); dfmodelh(r,2) = {floor(mode(dflh))}; dfmoderh(r,2) = {floor(mode(dfrh))}; thrlh(r,2) = {pcor}; thrrh(r,2) = {pcor}; [~,dc] = size(detvtx); dvtx(r,2) = {dc};
Kind regards,
Bronwyn Overs
Research Assistant
Neuroscience Research Australia Margarete Ainsworth Building Barker Street Randwick Sydney NSW 2031 Australia *M* 0411 308 769 *T* +61 2 9399 1725
neura.edu.au http://neura.edu.au/http://neura.edu.au/
Twitter https://twitter.com/neuraustraliahttps://twitter.com/neuraustralia | Facebook https://www.facebook.com/NeuroscienceResearchAustraliahttps://www.facebook.com/NeuroscienceResearchAustralia | Subscribe http://www.neura.edu.au/help-research/subscribehttp://www.neura.edu.au/help-research/subscribe
*From: *"Greve, Douglas N.,Ph.D." DGREVE@mgh.harvard.edumailto:DGREVE@mgh.harvard.edu *To: *"Freesurfer support list" freesurfer@nmr.mgh.harvard.edumailto:freesurfer@nmr.mgh.harvard.edu *Sent: *Wednesday, November 13, 2019 2:44:25 AM *Subject: *Re: [Freesurfer] Max threshold marked as '-inf' in cluster summary file
It looks like you have one gigantic cluster with a value of -inf at vertex 41. How did you generate /fsdata/lme/thickness/rh.thickness.B1B7.mgh ? Have you looked at it in freeview?
On 11/11/2019 7:39 PM, Bronwyn Overs wrote:
        External Email - Use Caution

Dear Freesurfer Mailing List,

I have completed an LME analysis in matlab and have generated a
number of different cluster summary files for my various
contrasts. In many of resulting cluster summary files the 'Max'
value for the largest cluster which encompasses most of the brain
surface is reported as infinity ('-inf'). Please find an example
file attached. As I was hoping to use these values to generate
effect size estimates, can you please tell me what alternate value
I could substitute here for 'Max'?

Kind regards,


Bronwyn Overs

Research Assistant


Neuroscience Research Australia
Margarete Ainsworth Building
Barker Street Randwick Sydney NSW 2031 Australia
*M* 0411 308 769 *T* +61 2 9399 1725


neura.edu.au <http://neura.edu.au/><http://neura.edu.au/>

Twitter <https://twitter.com/neuraustralia><https://twitter.com/neuraustralia> | Facebook
<https://www.facebook.com/NeuroscienceResearchAustralia><https://www.facebook.com/NeuroscienceResearchAustralia> |
Subscribe <http://www.neura.edu.au/help-research/subscribe><http://www.neura.edu.au/help-research/subscribe>


_______________________________________________
Freesurfer mailing list
Freesurfer@nmr.mgh.harvard.edu<mailto:Freesurfer@nmr.mgh.harvard.edu>  <mailto:Freesurfer@nmr.mgh.harvard.edu><mailto:Freesurfer@nmr.mgh.harvard.edu>
https://mail.nmr.mgh.harvard.edu/mailman/listinfo/freesurfer
Freesurfer mailing list Freesurfer@nmr.mgh.harvard.edumailto:Freesurfer@nmr.mgh.harvard.edu https://mail.nmr.mgh.harvard.edu/mailman/listinfo/freesurfer
Freesurfer mailing list Freesurfer@nmr.mgh.harvard.edumailto:Freesurfer@nmr.mgh.harvard.edu https://mail.nmr.mgh.harvard.edu/mailman/listinfo/freesurfer
_______________________________________________ Freesurfer mailing list Freesurfer@nmr.mgh.harvard.edumailto:Freesurfer@nmr.mgh.harvard.edu https://mail.nmr.mgh.harvard.edu/mailman/listinfo/freesurfer
_______________________________________________ Freesurfer mailing list Freesurfer@nmr.mgh.harvard.edumailto:Freesurfer@nmr.mgh.harvard.edu https://mail.nmr.mgh.harvard.edu/mailman/listinfo/freesurfer
_______________________________________________ Freesurfer mailing list Freesurfer@nmr.mgh.harvard.edumailto:Freesurfer@nmr.mgh.harvard.edu https://mail.nmr.mgh.harvard.edu/mailman/listinfo/freesurfer
_______________________________________________ Freesurfer mailing list Freesurfer@nmr.mgh.harvard.edu https://mail.nmr.mgh.harvard.edu/mailman/listinfo/freesurfer
_______________________________________________ Freesurfer mailing list Freesurfer@nmr.mgh.harvard.edu https://mail.nmr.mgh.harvard.edu/mailman/listinfo/freesurfer
_______________________________________________ Freesurfer mailing list Freesurfer@nmr.mgh.harvard.edumailto:Freesurfer@nmr.mgh.harvard.edu https://mail.nmr.mgh.harvard.edu/mailman/listinfo/freesurfer
External Email - Use Caution
Thank you very much Kersten!
Kind regards,
Bronwyn Overs
Research Assistant
Neuroscience Research Australia Margarete Ainsworth Building Barker Street Randwick Sydney NSW 2031 Australia M 0411 308 769 T +61 2 9399 1725
[ http://neura.edu.au/ | neura.edu.au ]
[ https://twitter.com/neuraustralia | Twitter ] | [ https://www.facebook.com/NeuroscienceResearchAustralia | Facebook ] | [ http://www.neura.edu.au/help-research/subscribe | Subscribe ]
From: "Kersten Diers, DZNE" Kersten.Diers@dzne.de To: "Freesurfer support list" freesurfer@nmr.mgh.harvard.edu Sent: Monday, December 16, 2019 9:20:49 PM Subject: Re: [Freesurfer] Max threshold marked as '-inf' in cluster summary file
External Email - Use Caution
Hi Bronwyn,
you can just add the two betas: it's the slope for the non-case group plus the difference in slopes between case and non-case group, so it should give the slope in the case group.
Best regards,
Kersten
On Mi, 2019-12-11 at 12:53 +1100, Bronwyn Overs wrote:
External Email - Use Caution
Hi Kersten,
Thank you for all of your help so far. I have now located the unstandardized beta values in lhstats(i).Bhat. Unfortunately one of the effects I was interested in was the slope for years within my case group, which required the use of the following contrast vector: 0 1 0 0 0 0 0 1
Do you know how I could estimate the effect size for this contrast given that it corresponds to two beta values (1 and 7)?
Kind regards,
Bronwyn Overs
Research Assistant
Neuroscience Research Australia Margarete Ainsworth Building Barker Street Randwick Sydney NSW 2031 Australia M 0411 308 769 T +61 2 9399 1725
[ http://neura.edu.au/ | neura.edu.au ]
[ https://twitter.com/neuraustralia | Twitter ] | [ https://www.facebook.com/NeuroscienceResearchAustralia | Facebook ] | [ http://www.neura.edu.au/help-research/subscribe | Subscribe ]
From: "Kersten Diers, DZNE" Kersten.Diers@dzne.de To: "Freesurfer support list" freesurfer@nmr.mgh.harvard.edu Sent: Saturday, November 30, 2019 6:50:26 AM Subject: Re: [Freesurfer] Max threshold marked as '-inf' in cluster summary file
External Email - Use Caution
Hi,
please see my inline responses below.
Best,
Kersten
On Fr, 2019-11-29 at 13:20 +1100, Bronwyn Overs wrote:
BQ_BEGIN
Hi Kersten,
Thank you this is a good suggestion. Where can I get the unstandardized beta values for the lme I have already run?
They are in e.g. lhstats(i).Bhat; see the tutorial webpage for some explanation.
BQ_BEGIN
Also, i'm not really sure how to interpret the unstandardized beta values for interaction effects like group X years, do you have any suggestions?
BQ_END
This would model a difference in slopes, right? So the beta value should reflect difference between the two particular groups of this contrast per year (if year is the unit of time).
BQ_BEGIN
Finally, do you know why the max vertex is listed as '-inf' for my largets cluster and is this a problem at all?
BQ_END
I can only speculate here, but it's probably worth checking: A sig value of 'Inf' would correspond to a p-value of (exactly) zero. So, one might investigate if any zeros are contained within the p-value arrays / maps, and if these zeros (if any) reflect the outcome of a statistical test (then it should be no problem) or if they were erroneously introduced.
BQ_BEGIN
Kind regards,
Bronwyn Overs
Research Assistant
Neuroscience Research Australia Margarete Ainsworth Building Barker Street Randwick Sydney NSW 2031 Australia M 0411 308 769 T +61 2 9399 1725
[ http://neura.edu.au/ | neura.edu.au ]
[ https://twitter.com/neuraustralia | Twitter ] | [ https://www.facebook.com/NeuroscienceResearchAustralia | Facebook ] | [ http://www.neura.edu.au/help-research/subscribe | Subscribe ]
From: "Kersten Diers, DZNE" Kersten.Diers@dzne.de To: "Bronwyn Overs" b.overs@neura.edu.au Cc: "Freesurfer support list" freesurfer@nmr.mgh.harvard.edu Sent: Friday, November 29, 2019 8:39:55 AM Subject: Re: [Freesurfer] Max threshold marked as '-inf' in cluster summary file
Hello,
and thanks for the explanation!
Here's my first impression:
I do not think that there is a really satisfying solution given these particular stats maps and the effect size measure you describe.
I may be missing something, but I also have to admit that it is not immediately clear to me what motivates the choice of cohen's d (and the calculation you describe) in the current scenario - I've always thought of it as a measure of 'difference in means'.
In a regression context, I would personally look for a measure of the "variance-explained" type. There seem to be at least two papers (Xu, 2003, Statistics in Medicine, and Selya, 2012, Frontiers) that cover these for mixed effects models. The calculation/implementation of these measures seems to be, however, not as straightforward as for classical multiple regression models; and as far as I can see, it would also involve fitting Null or reduced models, and thus running analyses again.
By far the easiest and most straightforward way in my eyes is to report unstandardized effect sizes, i.e. beta estimates, as you have clearly interpretable main variables (group and time) with intuitive units that should be comparable across studies from your field. So maybe this is an argument not to standardize, and to state the effect size in terms of "change in thickness per year" etc.?
Best regards,
Kersten
On Do, 2019-11-28 at 11:29 +1100, Bronwyn Overs wrote:
BQ_BEGIN
Hi Kersten,
No problem at al and thank you for your reply. While running my correction for multiple comparisons I store the df associated with each contrast vector using the following:
[~,~,dflh] = find(F_lhstats.df(2,:)); [~,~,dfrh] = find(F_rhstats.df(2,:)); dfmodelh = {floor(mode(dflh))}; dfmoderh = {floor(mode(dfrh))};
So far the dfmodelh and dfmoderh have been identical. I then calculate the effect size for each cluster using the following steps: 1. Derive the p-value from the Max threshold ('Max'), where p = 10 to the power of -abs(Max) 2. Calculate the t-value associated with this p-value, using the relevant df for this contrast 3. Calculate cohen's d using 't' and 'df', where d = (t*2)/(sqrt(df))
When the Max threshold is listed as -inf I cannot complete these calculations. Can you suggest an alternate method for generating effect sizes for these clusters?
Kind regards,
Bronwyn Overs
Research Assistant
Neuroscience Research Australia Margarete Ainsworth Building Barker Street Randwick Sydney NSW 2031 Australia M 0411 308 769 T +61 2 9399 1725
[ http://neura.edu.au/ | neura.edu.au ]
[ https://twitter.com/neuraustralia | Twitter ] | [ https://www.facebook.com/NeuroscienceResearchAustralia | Facebook ] | [ http://www.neura.edu.au/help-research/subscribe | Subscribe ]
From: "Kersten Diers, DZNE" Kersten.Diers@dzne.de To: "Freesurfer support list" freesurfer@nmr.mgh.harvard.edu Sent: Thursday, November 28, 2019 12:29:18 AM Subject: Re: [Freesurfer] Max threshold marked as '-inf' in cluster summary file
External Email - Use Caution
Hi Bronwyn, Doug,
sorry - I missed the other mail from two weeks ago (and have been absent for a few days), but I'm able to take a look now.
You mention that your goal is to calculate effect sizes. Could you briefly let us know how you are planning to do it - this would help me to better understand the issue.
Thanks,
Kersten
On Di, 2019-11-26 at 23:14 +0000, Greve, Douglas N.,Ph.D. wrote:
BQ_BEGIN can you send the cluster summary file?
On 11/24/2019 7:09 PM, Bronwyn Overs wrote:
BQ_BEGIN
External Email - Use Caution Hi Kersten,
Following on from Douglas's reply, you may remember my analysis as I forwarded you some files in October (see [ https://www.mail-archive.com/freesurfer@nmr.mgh.harvard.edu/msg64148.html | https://www.mail-archive.com/freesurfer@nmr.mgh.harvard.edu/msg64148.html ] ). I followed your suggestions of removing the '--thmax 5' argument form 'mri_surfcluster', and now the labels generated by 'mri_label2label' overlap perfectly with the significance maps from the LME. However, now my largest clusters have a maximum threshold of '-inf' in my cluster summary files. Do you have any idea how to get around this problem so that I can use my max threshold values to calculate cluster-wise effect sizes?
Kind regards,
Bronwyn Overs
Research Assistant
Neuroscience Research Australia Margarete Ainsworth Building Barker Street Randwick Sydney NSW 2031 Australia M 0411 308 769 T +61 2 9399 1725
[ http://neura.edu.au/ | neura.edu.au ]
[ https://twitter.com/neuraustralia | Twitter ] | [ https://www.facebook.com/NeuroscienceResearchAustralia | Facebook ] | [ http://www.neura.edu.au/help-research/subscribe | Subscribe ]
From: "Greve, Douglas N.,Ph.D." [ mailto:DGREVE@mgh.harvard.edu | DGREVE@mgh.harvard.edu ] To: "Freesurfer support list" [ mailto:freesurfer@nmr.mgh.harvard.edu | freesurfer@nmr.mgh.harvard.edu ] , "Kersten Diers, DZNE" [ mailto:Kersten.Diers@dzne.de | Kersten.Diers@dzne.de ] Sent: Thursday, November 14, 2019 4:23:12 AM Subject: Re: [Freesurfer] Max threshold marked as '-inf' in cluster summary file
I'll have to leave this one for Kersten as it appears that the LME stuff is generating and inf value
On 11/12/19 7:05 PM, Bronwyn Overs wrote:
External Email - Use Caution
Hi Douglas,
Yes I have looked at it in Freeview and I have attached a screenshot for your reference.
The /fsdata/lme/thickness/rh.thickness.B1B7.mgh file was generated with a mass-univariate spatiotemporal model using 'lme_mass_fit_EMinit' and then FDR correction was applied across both hemispheres (lme_mass_FDR). I have provided analysis details and syntax below. The B1B7 contrast represents the affect of years in cases.
Sample: Our sample includes 112 controls subjects, and 106 cases. All subjects are aged between 12 and 30 years. 153 or these subjects have 2 time-points (77 control, 76 cases), while the remaining 65 individuals have only 1 MRI time-point. We also have mixed ethnicites - 165 Caucasians, 23 Asians, and 30 mixed (Asians-Caucasians).
The QDEC file contains the following 6 variables:
- Y (years between scans)
- A (baseline age)
- G (group, 1=case, 0=control)
- S (sex, 1=female, 0=male)
- E1 (Ethnicity 1, 1=asian, 0=other)
- E2 (Ethnicity 1, 1=mixed-asian-caucasian, 0=other)
Design matrix: [ones(length(M),1) M M(:,1).*M(:,3)] i.e. main effects for each of the qdec variables + an interaction term for years X group
DVs: Cortical thickness, area and volume
Model: Mass-univariate spatiotemporal model using 'lme_mass_fit_EMinit' CODE: % Read in surface files [Y,mri] = fs_read_Y(mgh); % Read in qdec file Qdec = fReadQdec(qdec); % Remove fsid from qdec Qdec = rmQdecCol(Qdec,1); % Store col 1 (fsid-base) in sID variable sID = Qdec(2:end,1); % Remove col 1 (fsid-base) from Qdec array Qdec = rmQdecCol(Qdec,1); % Convert Qdec to numeric matrix M M = Qdec2num(Qdec); % Sort data and evaluate design matrix [M,Y,ni] = sortData(M,1,Y,sID); X = eval([ones(length(M),1) M M(:,1).*M(:,3)]) % Compute vertex-wise temporal covariance estimates. [Th0, Re] = lme_mass_fit_EMinit(X,[1],Y,ni,cortex,3); %Segmentation and model fitting. [Rgs, RgMeans, stats] = fit(Th0, Re, [1], sphere, cortex, X, Y, ni); %Check surfaces. surfcomp(Th0, RgMeans, sphere, fig1, fig2)
Correction for multiple comparisons: FDR across both hemispheres CODE: P = [ F_lhstats.pval(lhcortex) F_rhstats.pval(rhcortex) ]; G = [ F_lhstats.sgn(lhcortex) F_rhstats.sgn(rhcortex) ]; [detvtx, sided_pval, pth] = lme_mass_FDR2(P,G,[],0.05,0); altfdr(r,2) = num2cell(abs(log10(lme_mass_FDR(P,0.05)))); pcor = -log10(pth); [~,~,dflh] = find(F_lhstats.df(2,:)); [~,~,dfrh] = find(F_rhstats.df(2,:)); dfmodelh(r,2) = {floor(mode(dflh))}; dfmoderh(r,2) = {floor(mode(dfrh))}; thrlh(r,2) = {pcor}; thrrh(r,2) = {pcor}; [~,dc] = size(detvtx); dvtx(r,2) = {dc};
Kind regards,
Bronwyn Overs
Research Assistant
Neuroscience Research Australia Margarete Ainsworth Building Barker Street Randwick Sydney NSW 2031 Australia *M* 0411 308 769 *T* +61 2 9399 1725
neura.edu.au [ http://neura.edu.au/ |
Twitter [ https://twitter.com/neuraustralia |
https://twitter.com/neuraustralia ] | Facebook
https://www.facebook.com/NeuroscienceResearchAustralia ] | Subscribe
http://www.neura.edu.au/help-research/subscribe ]
*From: *"Greve, Douglas N.,Ph.D." [ mailto:DGREVE@mgh.harvard.edu |
*To: *"Freesurfer support list" [ mailto:freesurfer@nmr.mgh.harvard.edu |
freesurfer@nmr.mgh.harvard.edu ]
*Sent: *Wednesday, November 13, 2019 2:44:25 AM *Subject: *Re: [Freesurfer] Max threshold marked as '-inf' in cluster summary file
It looks like you have one gigantic cluster with a value of -inf at vertex 41. How did you generate /fsdata/lme/thickness/rh.thickness.B1B7.mgh ? Have you looked at it in freeview?
On 11/11/2019 7:39 PM, Bronwyn Overs wrote:
External Email - Use Caution
Dear Freesurfer Mailing List,
I have completed an LME analysis in matlab and have generated a number of different cluster summary files for my various contrasts. In many of resulting cluster summary files the 'Max' value for the largest cluster which encompasses most of the brain surface is reported as infinity ('-inf'). Please find an example file attached. As I was hoping to use these values to generate effect size estimates, can you please tell me what alternate value I could substitute here for 'Max'?
Kind regards,
Bronwyn Overs
Research Assistant
Neuroscience Research Australia Margarete Ainsworth Building Barker Street Randwick Sydney NSW 2031 Australia *M* 0411 308 769 *T* +61 2 9399 1725
neura.edu.au [ http://neura.edu.au/ |
Twitter [ https://twitter.com/neuraustralia |
https://twitter.com/neuraustralia ] | Facebook
https://www.facebook.com/NeuroscienceResearchAustralia ] |
Subscribe [ http://www.neura.edu.au/help-research/subscribe |
http://www.neura.edu.au/help-research/subscribe ]
Freesurfer mailing list [ mailto:Freesurfer@nmr.mgh.harvard.edu |
Freesurfer@nmr.mgh.harvard.edu ] [ mailto:Freesurfer@nmr.mgh.harvard.edu | mailto:Freesurfer@nmr.mgh.harvard.edu ]
[ https://mail.nmr.mgh.harvard.edu/mailman/listinfo/freesurfer |
https://mail.nmr.mgh.harvard.edu/mailman/listinfo/freesurfer ]
Freesurfer mailing list [ mailto:Freesurfer@nmr.mgh.harvard.edu |
Freesurfer@nmr.mgh.harvard.edu ]
[ https://mail.nmr.mgh.harvard.edu/mailman/listinfo/freesurfer |
https://mail.nmr.mgh.harvard.edu/mailman/listinfo/freesurfer ]
Freesurfer mailing list [ mailto:Freesurfer@nmr.mgh.harvard.edu |
Freesurfer@nmr.mgh.harvard.edu ]
[ https://mail.nmr.mgh.harvard.edu/mailman/listinfo/freesurfer |
https://mail.nmr.mgh.harvard.edu/mailman/listinfo/freesurfer ]
_______________________________________________ Freesurfer mailing list [ mailto:Freesurfer@nmr.mgh.harvard.edu | Freesurfer@nmr.mgh.harvard.edu ] [ https://mail.nmr.mgh.harvard.edu/mailman/listinfo/freesurfer | https://mail.nmr.mgh.harvard.edu/mailman/listinfo/freesurfer ]
_______________________________________________ Freesurfer mailing list [ mailto:Freesurfer@nmr.mgh.harvard.edu | Freesurfer@nmr.mgh.harvard.edu ] [ https://mail.nmr.mgh.harvard.edu/mailman/listinfo/freesurfer | https://mail.nmr.mgh.harvard.edu/mailman/listinfo/freesurfer ]
BQ_END
_______________________________________________ Freesurfer mailing list [ mailto:Freesurfer@nmr.mgh.harvard.edu | Freesurfer@nmr.mgh.harvard.edu ] [ https://mail.nmr.mgh.harvard.edu/mailman/listinfo/freesurfer | https://mail.nmr.mgh.harvard.edu/mailman/listinfo/freesurfer ]
BQ_END
_______________________________________________ Freesurfer mailing list Freesurfer@nmr.mgh.harvard.edu https://mail.nmr.mgh.harvard.edu/mailman/listinfo/freesurfer
BQ_END
BQ_END
_______________________________________________ Freesurfer mailing list Freesurfer@nmr.mgh.harvard.edu https://mail.nmr.mgh.harvard.edu/mailman/listinfo/freesurfer _______________________________________________ Freesurfer mailing list [ mailto:Freesurfer@nmr.mgh.harvard.edu | Freesurfer@nmr.mgh.harvard.edu ] [ https://mail.nmr.mgh.harvard.edu/mailman/listinfo/freesurfer | https://mail.nmr.mgh.harvard.edu/mailman/listinfo/freesurfer ]
BQ_END
_______________________________________________ Freesurfer mailing list Freesurfer@nmr.mgh.harvard.edu https://mail.nmr.mgh.harvard.edu/mailman/listinfo/freesurfer
External Email - Use Caution
Hi Kersten,
Based on your previous suggestions I have located lhstats(i).Bhat and extracted the unstandardized beta values that corresponds to the 'Max Vertex' for each cluster in my cluster summary file.
Unfortunately, I have identified an issue with two of my clusters for the effect of group X time, and one of my clusters for the effect of baseline age. In all instances the unstandardized beta value for the 'Max Vertex' is positive. In contrast, the negative sign of the Max log 10 p-value and plots of the mean cluter-wise cortical thickness values indicate that these effects should be negative. For the group X time clusters in question I have attached a composite image ('lme_ubetaissue_groupXtime_thickness.jpg') showing each cluster mapped onto its' relevant inflated cortical surface, as well as plots of the mean cortical thickness values for each cluster, and the relative 'Max' and unstandardised beta values. Do you have any idea what could be causing the discrepancy i'm seeing? Should I be averaging across all of the unstandardized beta values for a given cluster to get an estimate of the effect size?
In addition to this issue, I have also encountered a problem with one of my clusters for the effect of time on cortical area. Here both the log 10 p and unstandarized beta values are negative, but on plotting the mean cortical area values the line of best fit indicates that area is increasing over time. I have attached a second composite image that displays these issues ('lme_plotissue_time_area.jpg').
Any insight you can provide on either of these issues will be greatly appreciated, and I am happy to supply additional information and files if requried.
Kind regards,
Bronwyn Overs
Research Assistant
Neuroscience Research Australia Margarete Ainsworth Building Barker Street Randwick Sydney NSW 2031 Australia M 0411 308 769 T +61 2 9399 1725
[ http://neura.edu.au/ | neura.edu.au ]
[ https://twitter.com/neuraustralia | Twitter ] | [ https://www.facebook.com/NeuroscienceResearchAustralia | Facebook ] | [ http://www.neura.edu.au/help-research/subscribe | Subscribe ]
From: "Bronwyn Overs" b.overs@neura.edu.au To: "Freesurfer support list" freesurfer@nmr.mgh.harvard.edu Sent: Tuesday, December 17, 2019 10:08:03 AM Subject: Re: [Freesurfer] Max threshold marked as '-inf' in cluster summary file
External Email - Use Caution
Thank you very much Kersten!
Kind regards,
Bronwyn Overs
Research Assistant
Neuroscience Research Australia Margarete Ainsworth Building Barker Street Randwick Sydney NSW 2031 Australia M 0411 308 769 T +61 2 9399 1725
[ http://neura.edu.au/ | neura.edu.au ]
[ https://twitter.com/neuraustralia | Twitter ] | [ https://www.facebook.com/NeuroscienceResearchAustralia | Facebook ] | [ http://www.neura.edu.au/help-research/subscribe | Subscribe ]
From: "Kersten Diers, DZNE" Kersten.Diers@dzne.de To: "Freesurfer support list" freesurfer@nmr.mgh.harvard.edu Sent: Monday, December 16, 2019 9:20:49 PM Subject: Re: [Freesurfer] Max threshold marked as '-inf' in cluster summary file
External Email - Use Caution
Hi Bronwyn,
you can just add the two betas: it's the slope for the non-case group plus the difference in slopes between case and non-case group, so it should give the slope in the case group.
Best regards,
Kersten
On Mi, 2019-12-11 at 12:53 +1100, Bronwyn Overs wrote:
External Email - Use Caution
Hi Kersten,
Thank you for all of your help so far. I have now located the unstandardized beta values in lhstats(i).Bhat. Unfortunately one of the effects I was interested in was the slope for years within my case group, which required the use of the following contrast vector: 0 1 0 0 0 0 0 1
Do you know how I could estimate the effect size for this contrast given that it corresponds to two beta values (1 and 7)?
Kind regards,
Bronwyn Overs
Research Assistant
Neuroscience Research Australia Margarete Ainsworth Building Barker Street Randwick Sydney NSW 2031 Australia M 0411 308 769 T +61 2 9399 1725
[ http://neura.edu.au/ | neura.edu.au ]
[ https://twitter.com/neuraustralia | Twitter ] | [ https://www.facebook.com/NeuroscienceResearchAustralia | Facebook ] | [ http://www.neura.edu.au/help-research/subscribe | Subscribe ]
From: "Kersten Diers, DZNE" Kersten.Diers@dzne.de To: "Freesurfer support list" freesurfer@nmr.mgh.harvard.edu Sent: Saturday, November 30, 2019 6:50:26 AM Subject: Re: [Freesurfer] Max threshold marked as '-inf' in cluster summary file
External Email - Use Caution
Hi,
please see my inline responses below.
Best,
Kersten
On Fr, 2019-11-29 at 13:20 +1100, Bronwyn Overs wrote:
BQ_BEGIN
Hi Kersten,
Thank you this is a good suggestion. Where can I get the unstandardized beta values for the lme I have already run?
They are in e.g. lhstats(i).Bhat; see the tutorial webpage for some explanation.
BQ_BEGIN
Also, i'm not really sure how to interpret the unstandardized beta values for interaction effects like group X years, do you have any suggestions?
BQ_END
This would model a difference in slopes, right? So the beta value should reflect difference between the two particular groups of this contrast per year (if year is the unit of time).
BQ_BEGIN
Finally, do you know why the max vertex is listed as '-inf' for my largets cluster and is this a problem at all?
BQ_END
I can only speculate here, but it's probably worth checking: A sig value of 'Inf' would correspond to a p-value of (exactly) zero. So, one might investigate if any zeros are contained within the p-value arrays / maps, and if these zeros (if any) reflect the outcome of a statistical test (then it should be no problem) or if they were erroneously introduced.
BQ_BEGIN
Kind regards,
Bronwyn Overs
Research Assistant
Neuroscience Research Australia Margarete Ainsworth Building Barker Street Randwick Sydney NSW 2031 Australia M 0411 308 769 T +61 2 9399 1725
[ http://neura.edu.au/ | neura.edu.au ]
[ https://twitter.com/neuraustralia | Twitter ] | [ https://www.facebook.com/NeuroscienceResearchAustralia | Facebook ] | [ http://www.neura.edu.au/help-research/subscribe | Subscribe ]
From: "Kersten Diers, DZNE" Kersten.Diers@dzne.de To: "Bronwyn Overs" b.overs@neura.edu.au Cc: "Freesurfer support list" freesurfer@nmr.mgh.harvard.edu Sent: Friday, November 29, 2019 8:39:55 AM Subject: Re: [Freesurfer] Max threshold marked as '-inf' in cluster summary file
Hello,
and thanks for the explanation!
Here's my first impression:
I do not think that there is a really satisfying solution given these particular stats maps and the effect size measure you describe.
I may be missing something, but I also have to admit that it is not immediately clear to me what motivates the choice of cohen's d (and the calculation you describe) in the current scenario - I've always thought of it as a measure of 'difference in means'.
In a regression context, I would personally look for a measure of the "variance-explained" type. There seem to be at least two papers (Xu, 2003, Statistics in Medicine, and Selya, 2012, Frontiers) that cover these for mixed effects models. The calculation/implementation of these measures seems to be, however, not as straightforward as for classical multiple regression models; and as far as I can see, it would also involve fitting Null or reduced models, and thus running analyses again.
By far the easiest and most straightforward way in my eyes is to report unstandardized effect sizes, i.e. beta estimates, as you have clearly interpretable main variables (group and time) with intuitive units that should be comparable across studies from your field. So maybe this is an argument not to standardize, and to state the effect size in terms of "change in thickness per year" etc.?
Best regards,
Kersten
On Do, 2019-11-28 at 11:29 +1100, Bronwyn Overs wrote:
BQ_BEGIN
Hi Kersten,
No problem at al and thank you for your reply. While running my correction for multiple comparisons I store the df associated with each contrast vector using the following:
[~,~,dflh] = find(F_lhstats.df(2,:)); [~,~,dfrh] = find(F_rhstats.df(2,:)); dfmodelh = {floor(mode(dflh))}; dfmoderh = {floor(mode(dfrh))};
So far the dfmodelh and dfmoderh have been identical. I then calculate the effect size for each cluster using the following steps: 1. Derive the p-value from the Max threshold ('Max'), where p = 10 to the power of -abs(Max) 2. Calculate the t-value associated with this p-value, using the relevant df for this contrast 3. Calculate cohen's d using 't' and 'df', where d = (t*2)/(sqrt(df))
When the Max threshold is listed as -inf I cannot complete these calculations. Can you suggest an alternate method for generating effect sizes for these clusters?
Kind regards,
Bronwyn Overs
Research Assistant
Neuroscience Research Australia Margarete Ainsworth Building Barker Street Randwick Sydney NSW 2031 Australia M 0411 308 769 T +61 2 9399 1725
[ http://neura.edu.au/ | neura.edu.au ]
[ https://twitter.com/neuraustralia | Twitter ] | [ https://www.facebook.com/NeuroscienceResearchAustralia | Facebook ] | [ http://www.neura.edu.au/help-research/subscribe | Subscribe ]
From: "Kersten Diers, DZNE" Kersten.Diers@dzne.de To: "Freesurfer support list" freesurfer@nmr.mgh.harvard.edu Sent: Thursday, November 28, 2019 12:29:18 AM Subject: Re: [Freesurfer] Max threshold marked as '-inf' in cluster summary file
External Email - Use Caution
Hi Bronwyn, Doug,
sorry - I missed the other mail from two weeks ago (and have been absent for a few days), but I'm able to take a look now.
You mention that your goal is to calculate effect sizes. Could you briefly let us know how you are planning to do it - this would help me to better understand the issue.
Thanks,
Kersten
On Di, 2019-11-26 at 23:14 +0000, Greve, Douglas N.,Ph.D. wrote:
BQ_BEGIN can you send the cluster summary file?
On 11/24/2019 7:09 PM, Bronwyn Overs wrote:
BQ_BEGIN
External Email - Use Caution Hi Kersten,
Following on from Douglas's reply, you may remember my analysis as I forwarded you some files in October (see [ https://www.mail-archive.com/freesurfer@nmr.mgh.harvard.edu/msg64148.html | https://www.mail-archive.com/freesurfer@nmr.mgh.harvard.edu/msg64148.html ] ). I followed your suggestions of removing the '--thmax 5' argument form 'mri_surfcluster', and now the labels generated by 'mri_label2label' overlap perfectly with the significance maps from the LME. However, now my largest clusters have a maximum threshold of '-inf' in my cluster summary files. Do you have any idea how to get around this problem so that I can use my max threshold values to calculate cluster-wise effect sizes?
Kind regards,
Bronwyn Overs
Research Assistant
Neuroscience Research Australia Margarete Ainsworth Building Barker Street Randwick Sydney NSW 2031 Australia M 0411 308 769 T +61 2 9399 1725
[ http://neura.edu.au/ | neura.edu.au ]
[ https://twitter.com/neuraustralia | Twitter ] | [ https://www.facebook.com/NeuroscienceResearchAustralia | Facebook ] | [ http://www.neura.edu.au/help-research/subscribe | Subscribe ]
From: "Greve, Douglas N.,Ph.D." [ mailto:DGREVE@mgh.harvard.edu | DGREVE@mgh.harvard.edu ] To: "Freesurfer support list" [ mailto:freesurfer@nmr.mgh.harvard.edu | freesurfer@nmr.mgh.harvard.edu ] , "Kersten Diers, DZNE" [ mailto:Kersten.Diers@dzne.de | Kersten.Diers@dzne.de ] Sent: Thursday, November 14, 2019 4:23:12 AM Subject: Re: [Freesurfer] Max threshold marked as '-inf' in cluster summary file
I'll have to leave this one for Kersten as it appears that the LME stuff is generating and inf value
On 11/12/19 7:05 PM, Bronwyn Overs wrote:
External Email - Use Caution
Hi Douglas,
Yes I have looked at it in Freeview and I have attached a screenshot for your reference.
The /fsdata/lme/thickness/rh.thickness.B1B7.mgh file was generated with a mass-univariate spatiotemporal model using 'lme_mass_fit_EMinit' and then FDR correction was applied across both hemispheres (lme_mass_FDR). I have provided analysis details and syntax below. The B1B7 contrast represents the affect of years in cases.
Sample: Our sample includes 112 controls subjects, and 106 cases. All subjects are aged between 12 and 30 years. 153 or these subjects have 2 time-points (77 control, 76 cases), while the remaining 65 individuals have only 1 MRI time-point. We also have mixed ethnicites - 165 Caucasians, 23 Asians, and 30 mixed (Asians-Caucasians).
The QDEC file contains the following 6 variables:
- Y (years between scans)
- A (baseline age)
- G (group, 1=case, 0=control)
- S (sex, 1=female, 0=male)
- E1 (Ethnicity 1, 1=asian, 0=other)
- E2 (Ethnicity 1, 1=mixed-asian-caucasian, 0=other)
Design matrix: [ones(length(M),1) M M(:,1).*M(:,3)] i.e. main effects for each of the qdec variables + an interaction term for years X group
DVs: Cortical thickness, area and volume
Model: Mass-univariate spatiotemporal model using 'lme_mass_fit_EMinit' CODE: % Read in surface files [Y,mri] = fs_read_Y(mgh); % Read in qdec file Qdec = fReadQdec(qdec); % Remove fsid from qdec Qdec = rmQdecCol(Qdec,1); % Store col 1 (fsid-base) in sID variable sID = Qdec(2:end,1); % Remove col 1 (fsid-base) from Qdec array Qdec = rmQdecCol(Qdec,1); % Convert Qdec to numeric matrix M M = Qdec2num(Qdec); % Sort data and evaluate design matrix [M,Y,ni] = sortData(M,1,Y,sID); X = eval([ones(length(M),1) M M(:,1).*M(:,3)]) % Compute vertex-wise temporal covariance estimates. [Th0, Re] = lme_mass_fit_EMinit(X,[1],Y,ni,cortex,3); %Segmentation and model fitting. [Rgs, RgMeans, stats] = fit(Th0, Re, [1], sphere, cortex, X, Y, ni); %Check surfaces. surfcomp(Th0, RgMeans, sphere, fig1, fig2)
Correction for multiple comparisons: FDR across both hemispheres CODE: P = [ F_lhstats.pval(lhcortex) F_rhstats.pval(rhcortex) ]; G = [ F_lhstats.sgn(lhcortex) F_rhstats.sgn(rhcortex) ]; [detvtx, sided_pval, pth] = lme_mass_FDR2(P,G,[],0.05,0); altfdr(r,2) = num2cell(abs(log10(lme_mass_FDR(P,0.05)))); pcor = -log10(pth); [~,~,dflh] = find(F_lhstats.df(2,:)); [~,~,dfrh] = find(F_rhstats.df(2,:)); dfmodelh(r,2) = {floor(mode(dflh))}; dfmoderh(r,2) = {floor(mode(dfrh))}; thrlh(r,2) = {pcor}; thrrh(r,2) = {pcor}; [~,dc] = size(detvtx); dvtx(r,2) = {dc};
Kind regards,
Bronwyn Overs
Research Assistant
Neuroscience Research Australia Margarete Ainsworth Building Barker Street Randwick Sydney NSW 2031 Australia *M* 0411 308 769 *T* +61 2 9399 1725
neura.edu.au [ http://neura.edu.au/ |
Twitter [ https://twitter.com/neuraustralia |
https://twitter.com/neuraustralia ] | Facebook
https://www.facebook.com/NeuroscienceResearchAustralia ] | Subscribe
http://www.neura.edu.au/help-research/subscribe ]
*From: *"Greve, Douglas N.,Ph.D." [ mailto:DGREVE@mgh.harvard.edu |
*To: *"Freesurfer support list" [ mailto:freesurfer@nmr.mgh.harvard.edu |
freesurfer@nmr.mgh.harvard.edu ]
*Sent: *Wednesday, November 13, 2019 2:44:25 AM *Subject: *Re: [Freesurfer] Max threshold marked as '-inf' in cluster summary file
It looks like you have one gigantic cluster with a value of -inf at vertex 41. How did you generate /fsdata/lme/thickness/rh.thickness.B1B7.mgh ? Have you looked at it in freeview?
On 11/11/2019 7:39 PM, Bronwyn Overs wrote:
External Email - Use Caution
Dear Freesurfer Mailing List,
I have completed an LME analysis in matlab and have generated a number of different cluster summary files for my various contrasts. In many of resulting cluster summary files the 'Max' value for the largest cluster which encompasses most of the brain surface is reported as infinity ('-inf'). Please find an example file attached. As I was hoping to use these values to generate effect size estimates, can you please tell me what alternate value I could substitute here for 'Max'?
Kind regards,
Bronwyn Overs
Research Assistant
Neuroscience Research Australia Margarete Ainsworth Building Barker Street Randwick Sydney NSW 2031 Australia *M* 0411 308 769 *T* +61 2 9399 1725
neura.edu.au [ http://neura.edu.au/ |
Twitter [ https://twitter.com/neuraustralia |
https://twitter.com/neuraustralia ] | Facebook
https://www.facebook.com/NeuroscienceResearchAustralia ] |
Subscribe [ http://www.neura.edu.au/help-research/subscribe |
http://www.neura.edu.au/help-research/subscribe ]
Freesurfer mailing list [ mailto:Freesurfer@nmr.mgh.harvard.edu |
Freesurfer@nmr.mgh.harvard.edu ] [ mailto:Freesurfer@nmr.mgh.harvard.edu | mailto:Freesurfer@nmr.mgh.harvard.edu ]
[ https://mail.nmr.mgh.harvard.edu/mailman/listinfo/freesurfer |
https://mail.nmr.mgh.harvard.edu/mailman/listinfo/freesurfer ]
Freesurfer mailing list [ mailto:Freesurfer@nmr.mgh.harvard.edu |
Freesurfer@nmr.mgh.harvard.edu ]
[ https://mail.nmr.mgh.harvard.edu/mailman/listinfo/freesurfer |
https://mail.nmr.mgh.harvard.edu/mailman/listinfo/freesurfer ]
Freesurfer mailing list [ mailto:Freesurfer@nmr.mgh.harvard.edu |
Freesurfer@nmr.mgh.harvard.edu ]
[ https://mail.nmr.mgh.harvard.edu/mailman/listinfo/freesurfer |
https://mail.nmr.mgh.harvard.edu/mailman/listinfo/freesurfer ]
_______________________________________________ Freesurfer mailing list [ mailto:Freesurfer@nmr.mgh.harvard.edu | Freesurfer@nmr.mgh.harvard.edu ] [ https://mail.nmr.mgh.harvard.edu/mailman/listinfo/freesurfer | https://mail.nmr.mgh.harvard.edu/mailman/listinfo/freesurfer ]
_______________________________________________ Freesurfer mailing list [ mailto:Freesurfer@nmr.mgh.harvard.edu | Freesurfer@nmr.mgh.harvard.edu ] [ https://mail.nmr.mgh.harvard.edu/mailman/listinfo/freesurfer | https://mail.nmr.mgh.harvard.edu/mailman/listinfo/freesurfer ]
BQ_END
_______________________________________________ Freesurfer mailing list [ mailto:Freesurfer@nmr.mgh.harvard.edu | Freesurfer@nmr.mgh.harvard.edu ] [ https://mail.nmr.mgh.harvard.edu/mailman/listinfo/freesurfer | https://mail.nmr.mgh.harvard.edu/mailman/listinfo/freesurfer ]
BQ_END
_______________________________________________ Freesurfer mailing list Freesurfer@nmr.mgh.harvard.edu https://mail.nmr.mgh.harvard.edu/mailman/listinfo/freesurfer
BQ_END
BQ_END
_______________________________________________ Freesurfer mailing list Freesurfer@nmr.mgh.harvard.edu https://mail.nmr.mgh.harvard.edu/mailman/listinfo/freesurfer _______________________________________________ Freesurfer mailing list [ mailto:Freesurfer@nmr.mgh.harvard.edu | Freesurfer@nmr.mgh.harvard.edu ] [ https://mail.nmr.mgh.harvard.edu/mailman/listinfo/freesurfer | https://mail.nmr.mgh.harvard.edu/mailman/listinfo/freesurfer ]
BQ_END
_______________________________________________ Freesurfer mailing list Freesurfer@nmr.mgh.harvard.edu https://mail.nmr.mgh.harvard.edu/mailman/listinfo/freesurfer
_______________________________________________ Freesurfer mailing list Freesurfer@nmr.mgh.harvard.edu https://mail.nmr.mgh.harvard.edu/mailman/listinfo/freesurfer
freesurfer@nmr.mgh.harvard.edu
-
 Bronwyn Overs
 -
 Diers, Kersten /DZNE
 -
 Greve, Douglas N.,Ph.D.