
External Email - Use Caution
Hi,
I was wondering if anyone knows how the numbers in cache.th40.pos.sig.voxel.mgh are computed, or where I'd look to learn this. There is a one-liner in the documentationhttps://secure-web.cisco.com/1R2vQZUhHj-zAreoIH8kMlOuUPh5jYx8TyPmfmDzbM1Dl-B4qgLgEGd_WS_0Y5_08itpZ4Auiw4Ht4r-hZ9db1vTTyWFnxXY06DL9M-Ci_nUhFSEnnkt_VUhZ9nYtm6g3lKY9WxqmhllQYKLUlIVPuYUr9yQZM5iZ6Xch2DDFIJGKuCp0kg3Kjhj46CcO51Ub9WSI2iVIE6_gITNGjAVTztvV-E11_RxVX55KRwYo-EajEf4x60XUOm2hGcu4-35_LsmGynDaEemN9U59zZJ1IJbizmUoXnrJiPR51WNVRzaKtg2AbVbNm7aAc85WKKTpCNVU7IXaexwkzxZk0C3XmQ/https%3A%2F%2Fsurfer.nmr.mgh.harvard.edu%2Ffswiki%2FFsTutorial%2FMultipleComparisonsV6.0 but I'd like the mathematical details of the correction etc. so I can determine what the final numbers (from 0 to 1) represent. I've noticed from browsing the plot in FreeView that significant areas have values close to 1, which is puzzling.
Thanks if you could point me in the right direction.
Kind regards,
Mark
Mar
[cid:b7c6e65e-f85e-4206-aaa0-1ec00aa2fde2]
Mark Ebden, D.Phil
(Pronouns: He/Him)
Research Analyst
The Hospital for Sick Children
555 University Ave, Toronto ON M5G 1X8
P 416.888.0841
________________________________
This e-mail may contain confidential, personal and/or health information(information which may be subject to legal restrictions on use, retention and/or disclosure) for the sole use of the intended recipient. Any review or distribution by anyone other than the person for whom it was originally intended is strictly prohibited. If you have received this e-mail in error, please contact the sender and delete all copies.

from mri_glmfit-sim --help
csdbase.sig.voxel.mgh - the sig volume corrected for multiple comparisons on a voxel-wise basis. The threshhold and sign are irrelevant. The value at each voxel is the corrected -log10(p-value) for that voxel.
It is computed from a simulation in which gaussian noise is smoothed, then converted to p-values (log10(p)), then the maximum log10(p) is found. This is repeated 10,000 times to give 10k maximums. A corrected p-value for each voxel is then computed based upon the rank of the raw pvalue in this list of 10k.
On 6/10/2022 4:14 PM, Mark Ebden wrote:
External Email - Use Caution
Hi,
I was wondering if anyone knows how the numbers incache.th40.pos.sig.voxel.mghare computed, or where I'd look to learn this. There is a one-liner in the documentation https://secure-web.cisco.com/1R2vQZUhHj-zAreoIH8kMlOuUPh5jYx8TyPmfmDzbM1Dl-B4qgLgEGd_WS_0Y5_08itpZ4Auiw4Ht4r-hZ9db1vTTyWFnxXY06DL9M-Ci_nUhFSEnnkt_VUhZ9nYtm6g3lKY9WxqmhllQYKLUlIVPuYUr9yQZM5iZ6Xch2DDFIJGKuCp0kg3Kjhj46CcO51Ub9WSI2iVIE6_gITNGjAVTztvV-E11_RxVX55KRwYo-EajEf4x60XUOm2hGcu4-35_LsmGynDaEemN9U59zZJ1IJbizmUoXnrJiPR51WNVRzaKtg2AbVbNm7aAc85WKKTpCNVU7IXaexwkzxZk0C3XmQ/https%3A%2F%2Fsurfer.nmr.mgh.harvard.edu%2Ffswiki%2FFsTutorial%2FMultipleComparisonsV6.0 but I'd like the mathematical details of the correction etc. so I can determine what the final numbers (from 0 to 1) represent. I've noticed from browsing the plot in FreeView that significant areas have values close to 1, which is puzzling.
Thanks if you could point me in the right direction.
Kind regards,
Mark
Mar
*Mark Ebden**, D.Phil *
(Pronouns: He/Him)****
Research Analyst****
**
The Hospital for Sick Children****
555 University Ave, Toronto ON M5G 1X8****
P 416.888.0841****
This e-mail may contain confidential, personal and/or health information(information which may be subject to legal restrictions on use, retention and/or disclosure) for the sole use of the intended recipient. Any review or distribution by anyone other than the person for whom it was originally intended is strictly prohibited. If you have received this e-mail in error, please contact the sender and delete all copies.
Freesurfer mailing list Freesurfer@nmr.mgh.harvard.edu https://mail.nmr.mgh.harvard.edu/mailman/listinfo/freesurfer
External Email - Use Caution
Hi Douglas,
Thank you. From your explanation, the software's numbers from 0 to 1 aren't corrected p-values -- specifically, they aren't corrections in the well-accepted sense of Bonferroni corrections or other analagous multiple-comparisons corrections. They seem to be percentiles (what you refer to as ranks), where 1 corresponds to an extreme ranking in the basket of 10k, and 0 indicates the other extreme, per voxel/vertex.
Hope I have that right. I'm also not sure what you meant about converting the noise into p-values. Below is my interpretation of what the pseudocode would be. Is it right? I suspect it's not quite ready yet for sharing, because the concept of a maximum needs to be inserted.
for each voxel: p0 = the p-value from a t-test or similar between the two groups, as they are x0 = -log10(p0) for i from 1 to 10k: perform a random split between the two groups comprising the contrast analysis p = the p-value from a t-test or similar between the two groups x[i] = -log10(p) r = percentile indicating where x0 falls within the distribution of x's 10k values # N.B.: r represents the result for this voxel, from 0 to 1, to go in cache.th40.pos.sig.voxel.mgh
Thanks for any help. Also, how would the pseudocode differ for sig.cluster.mgh vs sig.voxel.mgh?
Thanks,
Mark
________________________________ From: freesurfer-bounces@nmr.mgh.harvard.edu freesurfer-bounces@nmr.mgh.harvard.edu on behalf of Douglas N. Greve dgreve@mgh.harvard.edu Sent: Sunday, June 19, 2022 10:37 AM To: freesurfer@nmr.mgh.harvard.edu freesurfer@nmr.mgh.harvard.edu Subject: Re: [Freesurfer] How is cache.th40.pos.sig.voxel.mgh computed, exactly?
from mri_glmfit-sim --help csdbase.sig.voxel.mgh - the sig volume corrected for multiple comparisons on a voxel-wise basis. The threshhold and sign are irrelevant. The value at each voxel is the corrected -log10(p-value) for that voxel.
from mri_glmfit-sim --help
csdbase.sig.voxel.mgh - the sig volume corrected for multiple comparisons on a voxel-wise basis. The threshhold and sign are irrelevant. The value at each voxel is the corrected -log10(p-value) for that voxel.
It is computed from a simulation in which gaussian noise is smoothed, then converted to p-values (log10(p)), then the maximum log10(p) is found. This is repeated 10,000 times to give 10k maximums. A corrected p-value for each voxel is then computed based upon the rank of the raw pvalue in this list of 10k.
On 6/10/2022 4:14 PM, Mark Ebden wrote:
External Email - Use Caution
Hi,
I was wondering if anyone knows how the numbers in cache.th40.pos.sig.voxel.mgh are computed, or where I'd look to learn this. There is a one-liner in the documentationhttps://secure-web.cisco.com/1W7S9rsrHEXbaTnSnVbwbNWoYIMhbQQVDpvQ1W1SM65EKfCiMWn1sTvtzfKPSMt4fbwgmpQsGcBZSAm9si3cbAgJ3okkqTUFOYHsH6f4z_qUL7bLf0RHtN24ax2f-9Uj1OUMpYSQXnqq-24nAHBIC4-6rn-sYws3S_qgLj88D3K9DXCrVH_VRGiTzPUzV6SNx-KZo78dUsqw6RjwiKX4ByrYKiqBgtYbXeV21bOlrnwNzkclvximv2EF3ManiTw1INceOX_uIHCL39FybYT-50QJy49gAj1U1C0rZPeJvReDB7CPODGtCUNVYDwWXwoSMXwYUjwBNw8FagjKpUJobMw/https%3A%2F%2Furldefense.com%2Fv3%2F__https%3A%2F%2Fsecure-web.cisco.com%2F1R2vQZUhHj-zAreoIH8kMlOuUPh5jYx8TyPmfmDzbM1Dl-B4qgLgEGd_WS_0Y5_08itpZ4Auiw4Ht4r-hZ9db1vTTyWFnxXY06DL9M-Ci_nUhFSEnnkt_VUhZ9nYtm6g3lKY9WxqmhllQYKLUlIVPuYUr9yQZM5iZ6Xch2DDFIJGKuCp0kg3Kjhj46CcO51Ub9WSI2iVIE6_gITNGjAVTztvV-E11_RxVX55KRwYo-EajEf4x60XUOm2hGcu4-35_LsmGynDaEemN9U59zZJ1IJbizmUoXnrJiPR51WNVRzaKtg2AbVbNm7aAc85WKKTpCNVU7IXaexwkzxZk0C3XmQ%2Fhttps*3A*2F*2Fsurfer.nmr.mgh.harvard.edu*2Ffswiki*2FFsTutorial*2FMultipleComparisonsV6.0__;JSUlJSUl!!D0zGoin7BXfl!-uix2-pXnTtUAAjZD2VXdB_BxqAGHYynqpQihjlROtSs1aHk1Q-Z5k228EMsY8kR8VlVUutWd0OpqLrgcx8zEWq4ug$ but I'd like the mathematical details of the correction etc. so I can determine what the final numbers (from 0 to 1) represent. I've noticed from browsing the plot in FreeView that significant areas have values close to 1, which is puzzling.
Thanks if you could point me in the right direction.
Kind regards,
Mark
Mar
[cid:part1.6uP0sXFm.v04hdL0E@mgh.harvard.edu]
Mark Ebden, D.Phil
(Pronouns: He/Him)
Research Analyst
The Hospital for Sick Children
555 University Ave, Toronto ON M5G 1X8
P 416.888.0841
________________________________
This e-mail may contain confidential, personal and/or health information(information which may be subject to legal restrictions on use, retention and/or disclosure) for the sole use of the intended recipient. Any review or distribution by anyone other than the person for whom it was originally intended is strictly prohibited. If you have received this e-mail in error, please contact the sender and delete all copies.
_______________________________________________ Freesurfer mailing list Freesurfer@nmr.mgh.harvard.edumailto:Freesurfer@nmr.mgh.harvard.edu https://secure-web.cisco.com/12Nc5CQ8hbwvx36Azatezwk49-0Rr7c5Y6bKhpzo4yOsHyJ...https://secure-web.cisco.com/1JP5YPMioGTncSt-RH6nn16v0N2mtxI3ybw86elXzLC-tgwLjYJp4LYAmTfHH_8Z9HJQHiTfgtHquaeKd2p3gJcugoQxvKm4gNzUUz4wTvxS3481QSsaGX-dtgjnjsmFulPPV1kwQfqFtCOT1sDT4TqschwZCfHh4O5nrAje904r6_3MyshWm-H5iLiMBHRmauBnLKjnZeUjzC22eQ7dbag6e7DT9B8uFaFlX9coNJfS1RB0c3FsNCnYzFRl4BFh7BBYB3RUR9Zi6f5wrhr2AHsiS8SWK5ASO8B7vlfZHlUp9lnC3PdgcU1vayfFxd3T3GcfDDIbnayTSx5MY_s7pkw/https%3A%2F%2Furldefense.com%2Fv3%2F__https%3A%2F%2Fmail.nmr.mgh.harvard.edu%2Fmailman%2Flistinfo%2Ffreesurfer__;!!D0zGoin7BXfl!-uix2-pXnTtUAAjZD2VXdB_BxqAGHYynqpQihjlROtSs1aHk1Q-Z5k228EMsY8kR8VlVUutWd0OpqLrgcx_mIhvLhg$
________________________________
This e-mail may contain confidential, personal and/or health information(information which may be subject to legal restrictions on use, retention and/or disclosure) for the sole use of the intended recipient. Any review or distribution by anyone other than the person for whom it was originally intended is strictly prohibited. If you have received this e-mail in error, please contact the sender and delete all copies.
On 6/30/2022 2:31 PM, Mark Ebden wrote:
External Email - Use Caution
Hi Douglas,
Thank you. From your explanation, the software's numbers from 0 to 1 aren't corrected p-values -- specifically, they aren't corrections in the well-accepted sense of Bonferroni corrections or other analagous multiple-comparisons corrections. They seem to be *percentiles* (what you refer to as ranks), where 1 corresponds to an extreme ranking in the basket of 10k, and 0 indicates the other extreme, per voxel/vertex.
They are -log10(pvalue)*sign(effect) as with all FS.
Hope I have that right. I'm also not sure what you meant about converting the noise into p-values. Below is my interpretation of what the pseudocode would be. Is it right? I suspect it's not quite ready yet for sharing, because the concept of a maximum needs to be inserted.
for each voxel: p0 = the p-value from a t-test or similar between the two groups, as they are x0 = -log10(p0) for i from 1 to 10k: perform a random split between the two groups comprising the contrast analysis p = the p-value from a t-test or similar between the two groups x[i] = -log10(p) r = percentile indicating where x0 falls within the distribution of x's 10k values # N.B.: r represents the result for this voxel, from 0 to 1, to go in cache.th40.pos.sig.voxel.mgh
Almost, it is more like this:
for i = 1 to 10k construct a z map (white gaussian noise) on the surface smooth by a given FWHM (look in glmfit/fwhm.dat) renormalize the z map so that std=1 find the voxel with the largest z value; keep track of the z value (convert the z to a p) Now you have a list of 10k largest z values (or smallest p-values) -- for mc-z simulations these are cached in $FREESURFER_HOME/average/mult-comp-cor
For each voxel in your data get uncorrected p-value compute a corrected p-value by counting the number in the 10k list that are smaller than the uncorrected p-value (divide by 10k) compute the -log10(corrected pvalue)
Thanks for any help. Also, how would the pseudocode differ for sig.cluster.mgh vs sig.voxel.mgh?
Thanks,
Mark
*From:* freesurfer-bounces@nmr.mgh.harvard.edu freesurfer-bounces@nmr.mgh.harvard.edu on behalf of Douglas N. Greve dgreve@mgh.harvard.edu *Sent:* Sunday, June 19, 2022 10:37 AM *To:* freesurfer@nmr.mgh.harvard.edu freesurfer@nmr.mgh.harvard.edu *Subject:* Re: [Freesurfer] How is cache.th40.pos.sig.voxel.mgh computed, exactly? from mri_glmfit-sim --help csdbase.sig.voxel.mgh - the sig volume corrected for multiple comparisons on a voxel-wise basis. The threshhold and sign are irrelevant. The value at each voxel is the corrected -log10(p-value) for that voxel. from mri_glmfit-sim --help
csdbase.sig.voxel.mgh - the sig volume corrected for multiple comparisons on a voxel-wise basis. The threshhold and sign are irrelevant. The value at each voxel is the corrected -log10(p-value) for that voxel.
It is computed from a simulation in which gaussian noise is smoothed, then converted to p-values (log10(p)), then the maximum log10(p) is found. This is repeated 10,000 times to give 10k maximums. A corrected p-value for each voxel is then computed based upon the rank of the raw pvalue in this list of 10k.
On 6/10/2022 4:14 PM, Mark Ebden wrote:
External Email - Use Caution
Hi,
I was wondering if anyone knows how the numbers incache.th40.pos.sig.voxel.mghare computed, or where I'd look to learn this. There is a one-liner in the documentation https://secure-web.cisco.com/1mZPhKugTZV0zciGbO88IW1AMYXyEgFtcZoIj7XLR0Jz1HIEvbCJkL4A7fX-p9YT9PqXmYanl22wOWqtBVNKGfpIp3t451w5ALS2dsuCwQbPF_U6gywrjK2UlE8i2ikgbsNzuv6MQQwGeEQBDvYVfd8fnL5QhJ22E194tBsbTjN3WO0QR40tF0aRy6GD8nmmZdXIwbZxDyjaLlrxSFrpVMcsPl4x8d46hpqt3oVDIlfYnGv--EBw4LtKPGi1FW3KzEcL9gLeJb4TToo63FGDRQmjyhNx3aDOZKK1Aw7T774MTIB-3EOccH_SHcGNscWvwvEb6Ou2STAxKqt8rcvZX1Q/https%3A%2F%2Furldefense.com%2Fv3%2F__https%3A%2F%2Fsecure-web.cisco.com%2F1R2vQZUhHj-zAreoIH8kMlOuUPh5jYx8TyPmfmDzbM1Dl-B4qgLgEGd_WS_0Y5_08itpZ4Auiw4Ht4r-hZ9db1vTTyWFnxXY06DL9M-Ci_nUhFSEnnkt_VUhZ9nYtm6g3lKY9WxqmhllQYKLUlIVPuYUr9yQZM5iZ6Xch2DDFIJGKuCp0kg3Kjhj46CcO51Ub9WSI2iVIE6_gITNGjAVTztvV-E11_RxVX55KRwYo-EajEf4x60XUOm2hGcu4-35_LsmGynDaEemN9U59zZJ1IJbizmUoXnrJiPR51WNVRzaKtg2AbVbNm7aAc85WKKTpCNVU7IXaexwkzxZk0C3XmQ%2Fhttps%2A3A%2A2F%2A2Fsurfer.nmr.mgh.harvard.edu%2A2Ffswiki%2A2FFsTutorial%2A2FMultipleComparisonsV6.0__%3BJSUlJSUl%21%21D0zGoin7BXfl%21-uix2-pXnTtUAAjZD2VXdB_BxqAGHYynqpQihjlROtSs1aHk1Q-Z5k228EMsY8kR8VlVUutWd0OpqLrgcx8zEWq4ug%24 but I'd like the mathematical details of the correction etc. so I can determine what the final numbers (from 0 to 1) represent. I've noticed from browsing the plot in FreeView that significant areas have values close to 1, which is puzzling.
Thanks if you could point me in the right direction.
Kind regards,
Mark
Mar
*Mark Ebden**, D.Phil *
(Pronouns: He/Him)****
Research Analyst****
**
The Hospital for Sick Children****
555 University Ave, Toronto ON M5G 1X8****
P 416.888.0841****
This e-mail may contain confidential, personal and/or health information(information which may be subject to legal restrictions on use, retention and/or disclosure) for the sole use of the intended recipient. Any review or distribution by anyone other than the person for whom it was originally intended is strictly prohibited. If you have received this e-mail in error, please contact the sender and delete all copies.
Freesurfer mailing list Freesurfer@nmr.mgh.harvard.edu mailto:Freesurfer@nmr.mgh.harvard.edu *MailScanner has detected a possible fraud attempt from "secure-web.cisco.com" claiming to be* https://mail.nmr.mgh.harvard.edu/mailman/listinfo/freesurfer https://secure-web.cisco.com/1jZkuJD8rRcPUuxNordBiZkfOEY3lw_VGrcGWX92_UB2kky6BvRXNI0Owmb7DCX77JOftH7ebmWMmv7BVro1RE0GNojgls8x5pqs_SjLR7gxXXwrmpbVAlHgk6m558E2UKrECuyCpRDegIbaSo3uhMtdAc_sQwam7ALA4Fe8zzzBDALxdVlBU949qIvB_lNOGS3xkJ15R6N1Gx-F8mNaMlUHsUJXNjBf5aVejVPP7KtInQ701hVsYqdKcTDUER3W98DyLEkiHspAJVlJ2ClCGIBXQ0o3EWyvwF5qSUiGH3Kv1CYDEixB967kC6T3ZE3DeIQpRMVJwISluKyJh1ay_6w/https%3A%2F%2Furldefense.com%2Fv3%2F__https%3A%2F%2Fmail.nmr.mgh.harvard.edu%2Fmailman%2Flistinfo%2Ffreesurfer__%3B%21%21D0zGoin7BXfl%21-uix2-pXnTtUAAjZD2VXdB_BxqAGHYynqpQihjlROtSs1aHk1Q-Z5k228EMsY8kR8VlVUutWd0OpqLrgcx_mIhvLhg%24
This e-mail may contain confidential, personal and/or health information(information which may be subject to legal restrictions on use, retention and/or disclosure) for the sole use of the intended recipient. Any review or distribution by anyone other than the person for whom it was originally intended is strictly prohibited. If you have received this e-mail in error, please contact the sender and delete all copies.
Freesurfer mailing list Freesurfer@nmr.mgh.harvard.edu https://mail.nmr.mgh.harvard.edu/mailman/listinfo/freesurfer
External Email - Use Caution
Hi Douglas,
Thanks for the explanation and pseudocode, and apologies for my delay in replying.
We’re still trying to see how these numbers represent –log10(corrected pvalue) * sign(effect). We see that the values vary from -1 to 1. For example, we run this command for a dataset showing a positive effect in a small area of the brain:
mri_glmfit-sim --glmdir {$dir}--cache 4 abs --cwp 0.05 --2spaces
and the output cache.th40.pos.sig.voxel.mgh file looks like this:
[cid:image001.png@01D9BE24.EC257C40]
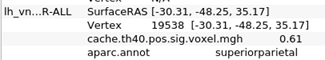
The yellow areas represent values in (0,1]. For instance, for the position shown by the cursor, the value is 0.61:
[cid:image002.png@01D9BE24.EC257C40]
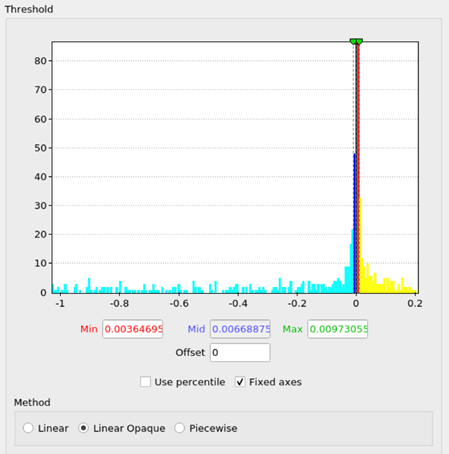
The histogram for the whole image is:
[cid:image003.png@01D9BE24.EC257C40]
Most values are 0. Because your pseudocode yields 0 = -log(10,000/10,000), this means that 100% of our synthetic p-values were smaller than the p-value observed in those voxels, if I understand correctly. But that can’t be. Another confusing point is that we expect that all voxels should have values between -4 and 0, because:
· -log(10,000/10,000) = 0
· -log(9,999/10,000) = -0.000043
· …
· -log(1/10,000) = -4
Seeing instead all values in the image fall in [0,1] means our understanding is still lacking.
As a second example, here is a cache.th13.abs.sig.voxel.mgh file showing a mixture of positive- and negative effects:
[cid:image004.png@01D9BE24.EC257C40]
It’s histogram has values from -1 to about 0.2:
[cid:image005.png@01D9BE24.EC257C40]
Thanks again for any help in reconciling these values with your pseudocode. Perhaps when understanding our data we should replace your final line,
compute the -log10(corrected pvalue)
with something like
compute r = sign(effect) x (corrected p-value), the values given in the .mgh file # N.B. final p-value to report is 1 – (r) sign(effect)
Is that right?
Best wishes,
Mark
From: freesurfer-bounces@nmr.mgh.harvard.edu freesurfer-bounces@nmr.mgh.harvard.edu On Behalf Of Douglas N. Greve Sent: July 10, 2022 6:21 PM To: freesurfer@nmr.mgh.harvard.edu Subject: Re: [Freesurfer] How is cache.th40.pos.sig.voxel.mgh computed, exactly?
On 6/30/2022 2:31 PM, Mark Ebden wrote: External Email - Use Caution ZjQcmQRYFpfptBannerStart This Message Is From an External Sender This message came from outside your organization. ZjQcmQRYFpfptBannerEnd
On 6/30/2022 2:31 PM, Mark Ebden wrote:
External Email - Use Caution Hi Douglas,
Thank you. From your explanation, the software's numbers from 0 to 1 aren't corrected p-values -- specifically, they aren't corrections in the well-accepted sense of Bonferroni corrections or other analagous multiple-comparisons corrections. They seem to be percentiles (what you refer to as ranks), where 1 corresponds to an extreme ranking in the basket of 10k, and 0 indicates the other extreme, per voxel/vertex. They are -log10(pvalue)*sign(effect) as with all FS.
Hope I have that right. I'm also not sure what you meant about converting the noise into p-values. Below is my interpretation of what the pseudocode would be. Is it right? I suspect it's not quite ready yet for sharing, because the concept of a maximum needs to be inserted.
for each voxel: p0 = the p-value from a t-test or similar between the two groups, as they are x0 = -log10(p0) for i from 1 to 10k: perform a random split between the two groups comprising the contrast analysis p = the p-value from a t-test or similar between the two groups x[i] = -log10(p) r = percentile indicating where x0 falls within the distribution of x's 10k values # N.B.: r represents the result for this voxel, from 0 to 1, to go in cache.th40.pos.sig.voxel.mgh
Almost, it is more like this:
for i = 1 to 10k construct a z map (white gaussian noise) on the surface smooth by a given FWHM (look in glmfit/fwhm.dat) renormalize the z map so that std=1 find the voxel with the largest z value; keep track of the z value (convert the z to a p) Now you have a list of 10k largest z values (or smallest p-values) -- for mc-z simulations these are cached in $FREESURFER_HOME/average/mult-comp-cor
For each voxel in your data get uncorrected p-value compute a corrected p-value by counting the number in the 10k list that are smaller than the uncorrected p-value (divide by 10k) compute the -log10(corrected pvalue)
Thanks for any help. Also, how would the pseudocode differ for sig.cluster.mgh vs sig.voxel.mgh?
Thanks,
Mark
________________________________ From: freesurfer-bounces@nmr.mgh.harvard.edumailto:freesurfer-bounces@nmr.mgh.harvard.edu freesurfer-bounces@nmr.mgh.harvard.edumailto:freesurfer-bounces@nmr.mgh.harvard.edu on behalf of Douglas N. Greve dgreve@mgh.harvard.edumailto:dgreve@mgh.harvard.edu Sent: Sunday, June 19, 2022 10:37 AM To: freesurfer@nmr.mgh.harvard.edumailto:freesurfer@nmr.mgh.harvard.edu freesurfer@nmr.mgh.harvard.edumailto:freesurfer@nmr.mgh.harvard.edu Subject: Re: [Freesurfer] How is cache.th40.pos.sig.voxel.mgh computed, exactly?
from mri_glmfit-sim --help csdbase.sig.voxel.mgh - the sig volume corrected for multiple comparisons on a voxel-wise basis. The threshhold and sign are irrelevant. The value at each voxel is the corrected -log10(p-value) for that voxel. from mri_glmfit-sim --help
csdbase.sig.voxel.mgh - the sig volume corrected for multiple comparisons on a voxel-wise basis. The threshhold and sign are irrelevant. The value at each voxel is the corrected -log10(p-value) for that voxel.
It is computed from a simulation in which gaussian noise is smoothed, then converted to p-values (log10(p)), then the maximum log10(p) is found. This is repeated 10,000 times to give 10k maximums. A corrected p-value for each voxel is then computed based upon the rank of the raw pvalue in this list of 10k.
On 6/10/2022 4:14 PM, Mark Ebden wrote:
External Email - Use Caution Hi,
I was wondering if anyone knows how the numbers in cache.th40.pos.sig.voxel.mgh are computed, or where I'd look to learn this. There is a one-liner in the documentationhttps://secure-web.cisco.com/1N2AFe0Xgel1JYix-FBriUn4jRVRcyP2aOOAyKxMcK1t4v6hgrI9vD7Eq9qdJ2wJ_ya6Vxlk0_ydTz7TD_kZ2gZVHA5hd4OzZvaD8kUnMmR8bx4TVzP4c364zahEnVmkRbD1X7JjAJy77Y3ie8XkdYbLOUXOypFjym3Bvi40hnUuZbq9y_seZ4isstt36272LPhSDqYr0xzBe-dinX0WcoUqeKYw_Rjt1j6sxkz3Pmje1dN2wsSmSgJjGZs-OWeyqAOoFdAg8HFnZvibhoS7zqICFarKHF0sCPnDk69w8pNyIDlqAShz-Ejm3_arkhg2atRqI3Ccw56K660Tb6_Klcg/https%3A%2F%2Furldefense.com%2Fv3%2F__https%3A%2Fsecure-web.cisco.com%2F1mZPhKugTZV0zciGbO88IW1AMYXyEgFtcZoIj7XLR0Jz1HIEvbCJkL4A7fX-p9YT9PqXmYanl22wOWqtBVNKGfpIp3t451w5ALS2dsuCwQbPF_U6gywrjK2UlE8i2ikgbsNzuv6MQQwGeEQBDvYVfd8fnL5QhJ22E194tBsbTjN3WO0QR40tF0aRy6GD8nmmZdXIwbZxDyjaLlrxSFrpVMcsPl4x8d46hpqt3oVDIlfYnGv--EBw4LtKPGi1FW3KzEcL9gLeJb4TToo63FGDRQmjyhNx3aDOZKK1Aw7T774MTIB-3EOccH_SHcGNscWvwvEb6Ou2STAxKqt8rcvZX1Q%2Fhttps*3A*2F*2Furldefense.com*2Fv3*2F__https*3A*2F*2Fsecure-web.cisco.com*2F1R2vQZUhHj-zAreoIH8kMlOuUPh5jYx8TyPmfmDzbM1Dl-B4qgLgEGd_WS_0Y5_08itpZ4Auiw4Ht4r-hZ9db1vTTyWFnxXY06DL9M-Ci_nUhFSEnnkt_VUhZ9nYtm6g3lKY9WxqmhllQYKLUlIVPuYUr9yQZM5iZ6Xch2DDFIJGKuCp0kg3Kjhj46CcO51Ub9WSI2iVIE6_gITNGjAVTztvV-E11_RxVX55KRwYo-EajEf4x60XUOm2hGcu4-35_LsmGynDaEemN9U59zZJ1IJbizmUoXnrJiPR51WNVRzaKtg2AbVbNm7aAc85WKKTpCNVU7IXaexwkzxZk0C3XmQ*2Fhttps*2A3A*2A2F*2A2Fsurfer.nmr.mgh.harvard.edu*2A2Ffswiki*2A2FFsTutorial*2A2FMultipleComparisonsV6.0__*3BJSUlJSUl*21*21D0zGoin7BXfl*21-uix2-pXnTtUAAjZD2VXdB_BxqAGHYynqpQihjlROtSs1aHk1Q-Z5k228EMsY8kR8VlVUutWd0OpqLrgcx8zEWq4ug*24__;JSUlJSUlJSUlJSUlJSUlJSUlJSUl!!D0zGoin7BXfl!6gLGhwESsOTJcHOed0dIj3LF1GDHkEGStMcK0ivkMGOd46nhoXiWHqmK7iqnWdTMa0X4DEHvE8LblNQ-ktBLNtYX6g$ but I'd like the mathematical details of the correction etc. so I can determine what the final numbers (from 0 to 1) represent. I've noticed from browsing the plot in FreeView that significant areas have values close to 1, which is puzzling.
Thanks if you could point me in the right direction.
Kind regards,
Mark
Mar
[cid:image006.png@01D9BE24.EC257C40]
Mark Ebden, D.Phil
(Pronouns: He/Him)
Research Analyst
The Hospital for Sick Children
555 University Ave, Toronto ON M5G 1X8
P 416.888.0841
________________________________
This e-mail may contain confidential, personal and/or health information(information which may be subject to legal restrictions on use, retention and/or disclosure) for the sole use of the intended recipient. Any review or distribution by anyone other than the person for whom it was originally intended is strictly prohibited. If you have received this e-mail in error, please contact the sender and delete all copies.
_______________________________________________
Freesurfer mailing list
Freesurfer@nmr.mgh.harvard.edumailto:Freesurfer@nmr.mgh.harvard.edu
MailScanner has detected a possible fraud attempt from "secure-web.cisco.com" claiming to be https://secure-web.cisco.com/1bNjcJBVZbB4HJQdCf9yNoyrI0IidFqsmeah2qzzig7aOdq...https://secure-web.cisco.com/19D4dRuMOaFC2N75mnSD0tEAeyyrEycgP_gWt1nNMJdaOdTHabTd9pEGRu0gfepee7mIkrpAGHVZg-q0Eivfyzl9TC3zEZ8IUZr8wA8iWapTlkDGEd0SBPiPRtQa2UDl_0zL2tla7UfJVkYoOXqZqZ_xdED4QAXwKZ2tSF4tOI2nqL1iEn_Woqiu6b92cJZuDDWA3y6dHALxE_IdORs0xhcKyGt5AGtMBiaIlPdd2GXH860rSh-eZsGlkNv5B0rNBOTKXNW7MnwwGLhlFL_iOWRiGE9S7OqJnw_99TOBJDAyugppN3lvxhPGAR3j3yrpy4NFx9v3JTEZo0lECDD2gRg/https%3A%2F%2Furldefense.com%2Fv3%2F__https%3A%2Fsecure-web.cisco.com%2F1jZkuJD8rRcPUuxNordBiZkfOEY3lw_VGrcGWX92_UB2kky6BvRXNI0Owmb7DCX77JOftH7ebmWMmv7BVro1RE0GNojgls8x5pqs_SjLR7gxXXwrmpbVAlHgk6m558E2UKrECuyCpRDegIbaSo3uhMtdAc_sQwam7ALA4Fe8zzzBDALxdVlBU949qIvB_lNOGS3xkJ15R6N1Gx-F8mNaMlUHsUJXNjBf5aVejVPP7KtInQ701hVsYqdKcTDUER3W98DyLEkiHspAJVlJ2ClCGIBXQ0o3EWyvwF5qSUiGH3Kv1CYDEixB967kC6T3ZE3DeIQpRMVJwISluKyJh1ay_6w%2Fhttps*3A*2F*2Furldefense.com*2Fv3*2F__https*3A*2F*2Fmail.nmr.mgh.harvard.edu*2Fmailman*2Flistinfo*2Ffreesurfer__*3B*21*21D0zGoin7BXfl*21-uix2-pXnTtUAAjZD2VXdB_BxqAGHYynqpQihjlROtSs1aHk1Q-Z5k228EMsY8kR8VlVUutWd0OpqLrgcx_mIhvLhg*24__;JSUlJSUlJSUlJSUlJSUlJQ!!D0zGoin7BXfl!6gLGhwESsOTJcHOed0dIj3LF1GDHkEGStMcK0ivkMGOd46nhoXiWHqmK7iqnWdTMa0X4DEHvE8LblNQ-ktAQPeo3TQ$
________________________________
This e-mail may contain confidential, personal and/or health information(information which may be subject to legal restrictions on use, retention and/or disclosure) for the sole use of the intended recipient. Any review or distribution by anyone other than the person for whom it was originally intended is strictly prohibited. If you have received this e-mail in error, please contact the sender and delete all copies.
_______________________________________________
Freesurfer mailing list
Freesurfer@nmr.mgh.harvard.edumailto:Freesurfer@nmr.mgh.harvard.edu
https://secure-web.cisco.com/1bNjcJBVZbB4HJQdCf9yNoyrI0IidFqsmeah2qzzig7aOdq...https://secure-web.cisco.com/1hrKEt0A_dxUb1S7BS7XrlZBcmKK6VeQwtl1BImvmHanhVPdydanixLC1D6FlqPvrVtj5hhu1BO0dO1FzZk5EEl1OIl-i0wqfLJQsmy0r7ORoJv_EPqYYa-PGuVgeKDMkxDUnu5jjsEmN2i8BabrTnUx-ELfG7Cg54_SqEEi5nMV7khBgqzmI9dATKv8MsxMzPyvsOOHVudEmcyP_FzYzP3HGFZINFWLKu9-04ZiCCYStcFVBgZYlWe4LraE30Rl54A1bux9gXu1Hq1I1BQPKdvdOdP0Of0m8GIaNBFfAjRAcVzDmGWBaUbuDiM4v8T8FdD_EakLPMBYoElL4ulDtFw/https%3A%2F%2Furldefense.com%2Fv3%2F__https%3A%2Fmail.nmr.mgh.harvard.edu%2Fmailman%2Flistinfo%2Ffreesurfer__;!!D0zGoin7BXfl!6gLGhwESsOTJcHOed0dIj3LF1GDHkEGStMcK0ivkMGOd46nhoXiWHqmK7iqnWdTMa0X4DEHvE8LblNQ-ktC6R9YODA$
________________________________
This e-mail may contain confidential, personal and/or health information(information which may be subject to legal restrictions on use, retention and/or disclosure) for the sole use of the intended recipient. Any review or distribution by anyone other than the person for whom it was originally intended is strictly prohibited. If you have received this e-mail in error, please contact the sender and delete all copies.
External Email - Use Caution
This is from mri_glmfit-sim --help:
csdbase.sig.voxel.mgh - the sig volume corrected for multiple comparisons on a voxel-wise basis. The threshhold and sign are irrelevant. The value at each voxel is the corrected -log10(p-value) for that voxel.
For the voxel you are showing with value = 0.61, the voxel-wise corrected p-value is 10^-0.61 = 0.2455 These values are not constrained to be between 0 and 1, in your case the effect is not very powerful. This often happens with voxel-wise corrections (which is why most people use clusterwise)
On 7/24/2023 11:49 AM, Mark Ebden wrote:
External Email - Use Caution
Hi Douglas,
Thanks for the explanation and pseudocode, and apologies for my delay in replying.
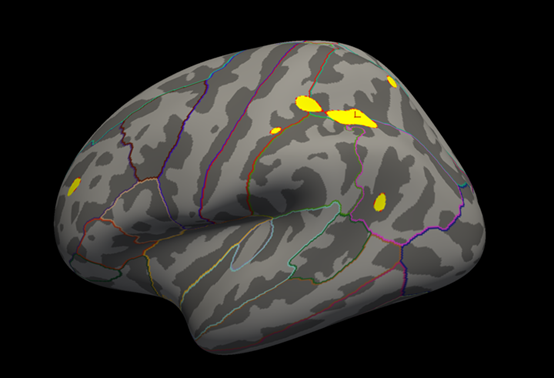
We’re still trying to see how these numbers represent –log10(corrected pvalue) * sign(effect). We see that the values vary from -1 to 1. For example, we run this command for a dataset showing a positive effect in a small area of the brain:
mri_glmfit-sim --glmdir {$dir}--cache 4 abs --cwp 0.05 --2spaces
and the output cache.th40.pos.sig.voxel.mghfile looks like this:
The yellow areas represent values in (0,1]. For instance, for the position shown by the cursor, the value is 0.61:
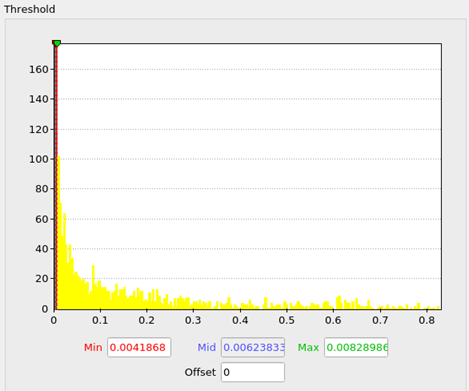
The histogram for the whole image is:
Most values are 0. Because your pseudocode yields 0 = -log(10,000/10,000), this means that 100% of our synthetic p-values were smaller than the p-value observed in those voxels, if I understand correctly. But that can’t be. Another confusing point is that we expect that all voxels should have values between -4 and 0, because:
·-log(10,000/10,000) = 0
·-log(9,999/10,000) = -0.000043
·…
·-log(1/10,000) = -4
Seeing instead all values in the image fall in [0,1] means our understanding is still lacking.
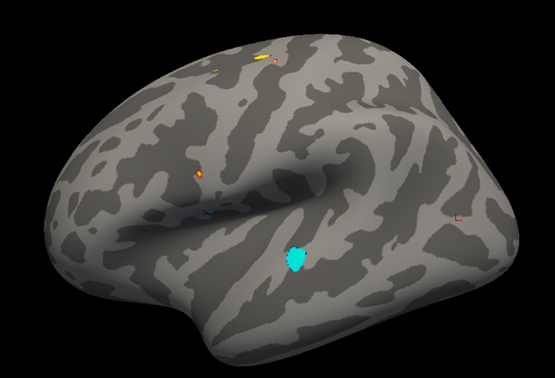
As a second example, here is a cache.th13.abs.sig.voxel.mghfile showing a mixture of *positive- and negative* effects:
It’s histogram has values from -1 to about 0.2:
Thanks again for any help in reconciling these values with your pseudocode. Perhaps when understanding our data we should replace your final line,
compute the -log10(corrected pvalue)
with something like
compute r = sign(effect) x (corrected p-value), the values given in the .mgh file # N.B. final p-value to report is 1 – (r) sign(effect)
Is that right?
Best wishes,
Mark
*From:*freesurfer-bounces@nmr.mgh.harvard.edu freesurfer-bounces@nmr.mgh.harvard.edu *On Behalf Of *Douglas N. Greve *Sent:* July 10, 2022 6:21 PM *To:* freesurfer@nmr.mgh.harvard.edu *Subject:* Re: [Freesurfer] How is cache.th40.pos.sig.voxel.mgh computed, exactly?
On 6/30/2022 2:31 PM, Mark Ebden wrote: External Email - Use Caution
ZjQcmQRYFpfptBannerStart
*This Message Is From an External Sender *
This message came from outside your organization.
ZjQcmQRYFpfptBannerEnd
On 6/30/2022 2:31 PM, Mark Ebden wrote:
*        External Email - Use Caution *

Hi Douglas,

Thank you. From your explanation, the software's numbers from 0 to
1 aren't corrected p-values -- specifically, they aren't
corrections in the well-accepted sense of Bonferroni corrections
or other analagous multiple-comparisons corrections. They seem to
be *percentiles* (what you refer to as ranks), where 1 corresponds
to an extreme ranking in the basket of 10k, and 0 indicates the
other extreme, per voxel/vertex.
They are -log10(pvalue)*sign(effect) as with all FS.
Hope I have that right. I'm also not sure what you meant about
converting the noise into p-values. Below is my interpretation of
what the pseudocode would be. Is it right? I suspect it's not
quite ready yet for sharing, because the concept of a maximum
needs to be inserted.

   for each voxel:

    p0 = the p-value from a t-test or similar between the two
groups, as they are

    x0 = -log10(p0)

      for i from 1 to 10k:

         perform a random split between the two groups comprising
the contrast analysis

         p = the p-value from a t-test or similar between the two
groups

         x[i] = -log10(p)

    r = percentile indicating where x0 falls within the
distribution of x's 10k values

    # N.B.: r represents the result for this voxel, from 0 to 1,
to go in cache.th40.pos.sig.voxel.mgh
Almost, it is more like this:
for i = 1 to 10k construct a z map (white gaussian noise) on the surface smooth by a given FWHM (look in glmfit/fwhm.dat) renormalize the z map so that std=1 find the voxel with the largest z value; keep track of the z value (convert the z to a p) Now you have a list of 10k largest z values (or smallest p-values) -- for mc-z simulations these are cached in $FREESURFER_HOME/average/mult-comp-cor
For each voxel in your data get uncorrected p-value compute a corrected p-value by counting the number in the 10k list that are smaller than the uncorrected p-value (divide by 10k) compute the -log10(corrected pvalue)
Thanks for any help. Also, how would the pseudocode differ for
sig.cluster.mgh vs sig.voxel.mgh?

Thanks,

Mark

------------------------------------------------------------------------

*From:*freesurfer-bounces@nmr.mgh.harvard.edu
<freesurfer-bounces@nmr.mgh.harvard.edu>
<mailto:freesurfer-bounces@nmr.mgh.harvard.edu> on behalf of
Douglas N. Greve <dgreve@mgh.harvard.edu>
<mailto:dgreve@mgh.harvard.edu>
*Sent:* Sunday, June 19, 2022 10:37 AM
*To:* freesurfer@nmr.mgh.harvard.edu
<freesurfer@nmr.mgh.harvard.edu>
<mailto:freesurfer@nmr.mgh.harvard.edu>
*Subject:* Re: [Freesurfer] How is cache.th40.pos.sig.voxel.mgh
computed, exactly?

from mri_glmfit-sim --help csdbase.sig.voxel.mgh - the sig volume
corrected for multiple comparisons on a voxel-wise basis. The
threshhold and sign are irrelevant. The value at each voxel is the
corrected -log10(p-value) for that voxel.

from mri_glmfit-sim --help

csdbase.sig.voxel.mgh - the sig volume corrected for multiple
comparisons on a voxel-wise basis. The threshhold and sign are
irrelevant. The value at each voxel is the corrected
-log10(p-value) for that voxel.

It is computed from a simulation in which gaussian noise is
smoothed, then converted to p-values (log10(p)), then the maximum
log10(p) is found. This is repeated 10,000 times to give 10k
maximums. A corrected p-value for each voxel is then computed
based upon the rank of the raw pvalue in this list of 10k.

On 6/10/2022 4:14 PM, Mark Ebden wrote:

    *        External Email - Use Caution *

    Hi,

    I was wondering if anyone knows how the numbers in
    cache.th40.pos.sig.voxel.mgh are computed, or where I'd look
    to learn this. There is a one-liner in the documentation
    <https://secure-web.cisco.com/1BgM8uOw5P7pBlxFWicMeyf04OzBFj2ESlbNqpldcWaoZU_NQXZt1ksDaKpC0kiO8-WtbF9Bq3UcPBsaFs4VUUK0fn8eMyXtFa9GaUTTisoGFR6cxQOdwBx5-QhcSzyg3pEkigghhvzqCRxJ-P22Jk7VpCflyWJycmZV8ABZDM1ZCJA7mctE_wnQM5zkyxKQpQQPg1yyGv1YSM6eZsItUMSdAhRyROfCCv6RX_mzvKYgA2tnZX81Z7wG7EgEzQZbB5WJ7MUd4PBQ_nojDC7mN4WzimGz3PE6DKn9FQgQIRJ4K8QbCALTY95hjlBUiNqq3PuolmaVag2t565r-u60k_A/https%3A%2F%2Furldefense.com%2Fv3%2F__https%3A%2Fsecure-web.cisco.com%2F1mZPhKugTZV0zciGbO88IW1AMYXyEgFtcZoIj7XLR0Jz1HIEvbCJkL4A7fX-p9YT9PqXmYanl22wOWqtBVNKGfpIp3t451w5ALS2dsuCwQbPF_U6gywrjK2UlE8i2ikgbsNzuv6MQQwGeEQBDvYVfd8fnL5QhJ22E194tBsbTjN3WO0QR40tF0aRy6GD8nmmZdXIwbZxDyjaLlrxSFrpVMcsPl4x8d46hpqt3oVDIlfYnGv--EBw4LtKPGi1FW3KzEcL9gLeJb4TToo63FGDRQmjyhNx3aDOZKK1Aw7T774MTIB-3EOccH_SHcGNscWvwvEb6Ou2STAxKqt8rcvZX1Q%2Fhttps%2A3A%2A2F%2A2Furldefense.com%2A2Fv3%2A2F__https%2A3A%2A2F%2A2Fsecure-web.cisco.com%2A2F1R2vQZUhHj-zAreoIH8kMlOuUPh5jYx8TyPmfmDzbM1Dl-B4qgLgEGd_WS_0Y5_08itpZ4Auiw4Ht4r-hZ9db1vTTyWFnxXY06DL9M-Ci_nUhFSEnnkt_VUhZ9nYtm6g3lKY9WxqmhllQYKLUlIVPuYUr9yQZM5iZ6Xch2DDFIJGKuCp0kg3Kjhj46CcO51Ub9WSI2iVIE6_gITNGjAVTztvV-E11_RxVX55KRwYo-EajEf4x60XUOm2hGcu4-35_LsmGynDaEemN9U59zZJ1IJbizmUoXnrJiPR51WNVRzaKtg2AbVbNm7aAc85WKKTpCNVU7IXaexwkzxZk0C3XmQ%2A2Fhttps%2A2A3A%2A2A2F%2A2A2Fsurfer.nmr.mgh.harvard.edu%2A2A2Ffswiki%2A2A2FFsTutorial%2A2A2FMultipleComparisonsV6.0__%2A3BJSUlJSUl%2A21%2A21D0zGoin7BXfl%2A21-uix2-pXnTtUAAjZD2VXdB_BxqAGHYynqpQihjlROtSs1aHk1Q-Z5k228EMsY8kR8VlVUutWd0OpqLrgcx8zEWq4ug%2A24__%3BJSUlJSUlJSUlJSUlJSUlJSUlJSUl%21%21D0zGoin7BXfl%216gLGhwESsOTJcHOed0dIj3LF1GDHkEGStMcK0ivkMGOd46nhoXiWHqmK7iqnWdTMa0X4DEHvE8LblNQ-ktBLNtYX6g%24>
    but I'd like the mathematical details of the correction etc.
    so I can determine what the final numbers (from 0 to 1)
    represent. I've noticed from browsing the plot in FreeView
    that significant areas have values close to 1, which is puzzling.

    Thanks if you could point me in the right direction.

    Kind regards,

    Mark

    Mar

    ******


    *Mark Ebden**, D.Phil ***

    (Pronouns: He/Him)****

    Research Analyst****

    ****

    The Hospital for Sick Children****

    555 University Ave, Toronto ON M5G 1X8****

    P 416.888.0841****

    *<https://secure-web.cisco.com/1hSXNqmvVZSeosuIEuNV65FpecnWvN4pfPfosGHuMT9_wtGlLHjxYjRaV2iK1UmIuGxbbCdYauCrRr2ZXJ_EGtChAsYrIUhwv1pEf6KVUKG3uTPYIGp1eFE4TfJATIrZCuH0YZXCox7s38HjKLFQDXZQi79N9zGMa87qs_TU9Nx1s_lCCcyx9RvYG8jNdAUUUImE3X6Ozh-rmkGnELQDC7uR71RRhp9dxti6UC3ZmPOWUUPwWxgS_Pfl0x6yCWhoHCeFm49_HoAYsdMGn-J43lwLJN4WR-l-4G2zq9vsFfblF5t_WNbzURQjcYYqEqlpkzwQzXtIVb9znwgQKeJvNrw/https%3A%2F%2Furldefense.com%2Fv3%2F__https%3A%2Fsecure-web.cisco.com%2F1u3Eqz6ChkU3GFI6wnbaKNNbADjIEtGg8BOlcsWcSByn6C9dLwfl2sukBYw7xhYOJtqNUT4e21Z737dZlIOw1H336Ythl-fbBFSlfA5abBBfVrs7KZ9srhvBoPDjSgNl4oufbmsog58dbcmUxq1VkbJ7_bz-xFa9zVfJ64IvPVhNbqOCq4ttZ5dnubGVGDi4NwjA_SD9817H73afLm6o4UVLhDmZs-JSJb4w9-ueYjEGfRT_vrNCmuWA0Jdmk5vKz4ImGFx_23rUgmD4UBCtG1VZCTTZc9OAsuC51NvIfJAGRL7EAsoW54afEMmnbumTaf5mvqdnLrwoD6-aN_nNf0g%2Fhttps%2A3A%2A2F%2A2Furldefense.com%2A2Fv3%2A2F__https%2A3A%2A2F%2A2Fsecure-web.cisco.com%2A2F17-WtJwO2uIWyZ7umzDRCiH0I5Q1NZ-tfYcx_zx9tznEDbF7wdGOPP86cK8jP9yFutBpKmq9LWYY1y8AuwZCWk6IdKEPIA_ZqP8Dc4C98j87Lk8ys1SjgVgzfrjoazrJXK1-elq3_KlOW4bq3ZHfgxipdcr_gUJh_cPtLG0NlOdBzxJTJsCkV6QEZr4IGT0O3TikkECFmDBAv1XuNHEgIwBgUXw_WqKw_shdKUaQCnYUv1W_51l_VsfpDdm5Poo9RCR3jMGbkmsxEt4j1UloOg316TI7_-R8Dw2hfZvmdbNCm5Vsf9hi82eN14AhwMOPt8eX4LmXbEDg7BYKxjbiEGg%2A2Fhttps%2A2A3A%2A2A2F%2A2A2Fwww.linkedin.com%2A2A2Fin%2A2A2Fmebden%2A2A2F__%2A3BJSUlJSUl%2A21%2A21D0zGoin7BXfl%2A21-uix2-pXnTtUAAjZD2VXdB_BxqAGHYynqpQihjlROtSs1aHk1Q-Z5k228EMsY8kR8VlVUutWd0OpqLrgcx_e50h1Fg%2A24__%3BJSUlJSUlJSUlJSUlJSUlJSUlJSUl%21%21D0zGoin7BXfl%216gLGhwESsOTJcHOed0dIj3LF1GDHkEGStMcK0ivkMGOd46nhoXiWHqmK7iqnWdTMa0X4DEHvE8LblNQ-ktAfPp9LoQ%24>*


    ------------------------------------------------------------------------


    This e-mail may contain confidential, personal and/or health
    information(information which may be subject to legal
    restrictions on use, retention and/or disclosure) for the sole
    use of the intended recipient. Any review or distribution by
    anyone other than the person for whom it was originally
    intended is strictly prohibited. If you have received this
    e-mail in error, please contact the sender and delete all copies.


    _______________________________________________

    Freesurfer mailing list

    Freesurfer@nmr.mgh.harvard.edu

    *MailScanner has detected a possible fraud attempt from
    "secure-web.cisco.com" claiming to be*
    https://secure-web.cisco.com/1Q0gyyvYRYkkmwzVUlVo71SvRtk6AYZGU-reN0K_Wl8RxQNwLqYUdykFsdGmPQVIsnDkDXZ5J5Uy2dhr4FC9Xm0MaK4-HqZc-148-a0qCGzMXGzYGWzlODnBwhgTwrsShlkA4LKlqnuxW79kN5C70eAgVI-oKwcq_KyNs69-BBV3lHdUFWdb_y_XqoduYOSm75daKkpD1L5yIBpktNC2SWdj28LUwD6tCMCto-qSOH-wSHrF1v7c-RzriD9YkjwF2/https%3A%2F%2Fmail.nmr.mgh.harvard.edu%2Fmailman%2Flistinfo%2Ffreesurfer  <https://secure-web.cisco.com/1pxF3sJqRxmoz-GQF9L7EKsdsPLftxBZk4akLcHA6jBIQzif7ISzxy5Jeg5hk8F3UXbvO84vPWJkH2kSOESJRe61Akj5_wTWea0-rVpA-vOWO8gjtWSGBmUCbLKXF94LrvarBIPNcoSsKOH-OYh4efn_yC9q1lXoZQZh0uRHshvtnGH2mS_ta0Qh5kKjN0SBxVJ_M_5GmStmQYwq6P44jTdEUzzadlxodpKXW2zLdh9QbgUKHuBbkmttju_GfhcmcqkI02smJREtssCYZM0ZTkS2JnWOpmEcewwcfrQJl33vsvWBRXOZR4Nr94cuMmj55SNZscUmJQfjeP1011lKMIQ/https%3A%2F%2Furldefense.com%2Fv3%2F__https%3A%2Fsecure-web.cisco.com%2F1jZkuJD8rRcPUuxNordBiZkfOEY3lw_VGrcGWX92_UB2kky6BvRXNI0Owmb7DCX77JOftH7ebmWMmv7BVro1RE0GNojgls8x5pqs_SjLR7gxXXwrmpbVAlHgk6m558E2UKrECuyCpRDegIbaSo3uhMtdAc_sQwam7ALA4Fe8zzzBDALxdVlBU949qIvB_lNOGS3xkJ15R6N1Gx-F8mNaMlUHsUJXNjBf5aVejVPP7KtInQ701hVsYqdKcTDUER3W98DyLEkiHspAJVlJ2ClCGIBXQ0o3EWyvwF5qSUiGH3Kv1CYDEixB967kC6T3ZE3DeIQpRMVJwISluKyJh1ay_6w%2Fhttps%2A3A%2A2F%2A2Furldefense.com%2A2Fv3%2A2F__https%2A3A%2A2F%2A2Fmail.nmr.mgh.harvard.edu%2A2Fmailman%2A2Flistinfo%2A2Ffreesurfer__%2A3B%2A21%2A21D0zGoin7BXfl%2A21-uix2-pXnTtUAAjZD2VXdB_BxqAGHYynqpQihjlROtSs1aHk1Q-Z5k228EMsY8kR8VlVUutWd0OpqLrgcx_mIhvLhg%2A24__%3BJSUlJSUlJSUlJSUlJSUlJQ%21%21D0zGoin7BXfl%216gLGhwESsOTJcHOed0dIj3LF1GDHkEGStMcK0ivkMGOd46nhoXiWHqmK7iqnWdTMa0X4DEHvE8LblNQ-ktAQPeo3TQ%24>

------------------------------------------------------------------------


This e-mail may contain confidential, personal and/or health
information(information which may be subject to legal restrictions
on use, retention and/or disclosure) for the sole use of the
intended recipient. Any review or distribution by anyone other
than the person for whom it was originally intended is strictly
prohibited. If you have received this e-mail in error, please
contact the sender and delete all copies.


_______________________________________________

Freesurfer mailing list

Freesurfer@nmr.mgh.harvard.edu

*MailScanner has detected a possible fraud attempt from
"secure-web.cisco.com" claiming to be*
https://secure-web.cisco.com/1Q0gyyvYRYkkmwzVUlVo71SvRtk6AYZGU-reN0K_Wl8RxQNwLqYUdykFsdGmPQVIsnDkDXZ5J5Uy2dhr4FC9Xm0MaK4-HqZc-148-a0qCGzMXGzYGWzlODnBwhgTwrsShlkA4LKlqnuxW79kN5C70eAgVI-oKwcq_KyNs69-BBV3lHdUFWdb_y_XqoduYOSm75daKkpD1L5yIBpktNC2SWdj28LUwD6tCMCto-qSOH-wSHrF1v7c-RzriD9YkjwF2/https%3A%2F%2Fmail.nmr.mgh.harvard.edu%2Fmailman%2Flistinfo%2Ffreesurfer  <https://secure-web.cisco.com/11ISLlVxMxG3f6TyOL5XEqbf3QrdLXV3jLVK_Nd0d4sqfdziNfFqzyDIXhHRRwt7WA1g0zmE9XRSYLMI2KsqB0RM6efFsBmb-Fh_7TK04sOKtr9RgSqpYzdFOIt4iW8gnq0U3LNLX8tqU3FQU68MuYf6GB03tkmjTNl2Tqu3Ek_J8ZlLWTLRzrXbohVSI2hIyxZWs1ZTqwnK_ZSc5oLO9r6Ti6LcY55nsu8-DTiHkh8SMEPeYdNvhHZsNpVFuiI4xJPqyh9NXMtFVu_m2BmnYRGpXM9iOb7rEs98oKwu29Fr3K8TAaaWtLc2o7-g-63bL5sbQLmA59xUmjBkqOwBaUQ/https%3A%2F%2Furldefense.com%2Fv3%2F__https%3A%2Fmail.nmr.mgh.harvard.edu%2Fmailman%2Flistinfo%2Ffreesurfer__%3B%21%21D0zGoin7BXfl%216gLGhwESsOTJcHOed0dIj3LF1GDHkEGStMcK0ivkMGOd46nhoXiWHqmK7iqnWdTMa0X4DEHvE8LblNQ-ktC6R9YODA%24>
This e-mail may contain confidential, personal and/or health information(information which may be subject to legal restrictions on use, retention and/or disclosure) for the sole use of the intended recipient. Any review or distribution by anyone other than the person for whom it was originally intended is strictly prohibited. If you have received this e-mail in error, please contact the sender and delete all copies.
Freesurfer mailing list Freesurfer@nmr.mgh.harvard.edu https://secure-web.cisco.com/1Q0gyyvYRYkkmwzVUlVo71SvRtk6AYZGU-reN0K_Wl8RxQN...
External Email - Use Caution
Hi Douglas,
Thanks very much for clarifying. I see now how, in the regions where our voxels were zero, 100% of the synthetic p-values were lower than the p-values obtained, and in the yellow regions there was a too-mild, insignificant effect. It seems that we’d need the values to be about 1.3 or higher to indicate a transformed p that’s below 0.05.
Mark
From: freesurfer-bounces@nmr.mgh.harvard.edu freesurfer-bounces@nmr.mgh.harvard.edu On Behalf Of Douglas N. Greve Sent: July 31, 2023 6:36 PM To: freesurfer@nmr.mgh.harvard.edu Subject: Re: [Freesurfer] How is cache.th40.pos.sig.voxel.mgh computed, exactly?
External Email - Use Caution
This is from mri_glmfit-sim --help:
csdbase.sig.voxel.mgh - the sig volume corrected for multiple comparisons on a voxel-wise basis. The threshhold and sign are irrelevant. The value at each voxel is the corrected -log10(p-value) for that voxel.
For the voxel you are showing with value = 0.61, the voxel-wise corrected p-value is 10^-0.61 = 0.2455 These values are not constrained to be between 0 and 1, in your case the effect is not very powerful. This often happens with voxel-wise corrections (which is why most people use clusterwise)
On 7/24/2023 11:49 AM, Mark Ebden wrote:
External Email - Use Caution
Hi Douglas,
Thanks for the explanation and pseudocode, and apologies for my delay in replying.
We’re still trying to see how these numbers represent –log10(corrected pvalue) * sign(effect). We see that the values vary from -1 to 1. For example, we run this command for a dataset showing a positive effect in a small area of the brain:
mri_glmfit-sim --glmdir {$dir}--cache 4 abs --cwp 0.05 --2spaces
and the output cache.th40.pos.sig.voxel.mgh file looks like this:
[cid:image001.png@01D9C6B6.F665BB30]
The yellow areas represent values in (0,1]. For instance, for the position shown by the cursor, the value is 0.61:
[cid:image002.png@01D9C6B6.F665BB30]
The histogram for the whole image is:
[cid:image003.png@01D9C6B6.F665BB30]
Most values are 0. Because your pseudocode yields 0 = -log(10,000/10,000), this means that 100% of our synthetic p-values were smaller than the p-value observed in those voxels, if I understand correctly. But that can’t be. Another confusing point is that we expect that all voxels should have values between -4 and 0, because:
1. -log(10,000/10,000) = 0
2. -log(9,999/10,000) = -0.000043
3. …
4. -log(1/10,000) = -4
Seeing instead all values in the image fall in [0,1] means our understanding is still lacking.
As a second example, here is a cache.th13.abs.sig.voxel.mgh file showing a mixture of positive- and negative effects:
[cid:image004.png@01D9C6B6.F665BB30]
It’s histogram has values from -1 to about 0.2:
[cid:image005.png@01D9C6B6.F665BB30]
Thanks again for any help in reconciling these values with your pseudocode. Perhaps when understanding our data we should replace your final line,
compute the -log10(corrected pvalue)
with something like
compute r = sign(effect) x (corrected p-value), the values given in the .mgh file # N.B. final p-value to report is 1 – (r) sign(effect)
Is that right?
Best wishes,
Mark
From: freesurfer-bounces@nmr.mgh.harvard.edumailto:freesurfer-bounces@nmr.mgh.harvard.edu freesurfer-bounces@nmr.mgh.harvard.edumailto:freesurfer-bounces@nmr.mgh.harvard.edu On Behalf Of Douglas N. Greve Sent: July 10, 2022 6:21 PM To: freesurfer@nmr.mgh.harvard.edumailto:freesurfer@nmr.mgh.harvard.edu Subject: Re: [Freesurfer] How is cache.th40.pos.sig.voxel.mgh computed, exactly?
On 6/30/2022 2:31 PM, Mark Ebden wrote: External Email - Use Caution ZjQcmQRYFpfptBannerStart This Message Is From an External Sender This message came from outside your organization. ZjQcmQRYFpfptBannerEnd
On 6/30/2022 2:31 PM, Mark Ebden wrote:
External Email - Use Caution Hi Douglas,
Thank you. From your explanation, the software's numbers from 0 to 1 aren't corrected p-values -- specifically, they aren't corrections in the well-accepted sense of Bonferroni corrections or other analagous multiple-comparisons corrections. They seem to be percentiles (what you refer to as ranks), where 1 corresponds to an extreme ranking in the basket of 10k, and 0 indicates the other extreme, per voxel/vertex. They are -log10(pvalue)*sign(effect) as with all FS.
Hope I have that right. I'm also not sure what you meant about converting the noise into p-values. Below is my interpretation of what the pseudocode would be. Is it right? I suspect it's not quite ready yet for sharing, because the concept of a maximum needs to be inserted.
for each voxel: p0 = the p-value from a t-test or similar between the two groups, as they are x0 = -log10(p0) for i from 1 to 10k: perform a random split between the two groups comprising the contrast analysis p = the p-value from a t-test or similar between the two groups x[i] = -log10(p) r = percentile indicating where x0 falls within the distribution of x's 10k values # N.B.: r represents the result for this voxel, from 0 to 1, to go in cache.th40.pos.sig.voxel.mgh
Almost, it is more like this:
for i = 1 to 10k construct a z map (white gaussian noise) on the surface smooth by a given FWHM (look in glmfit/fwhm.dat) renormalize the z map so that std=1 find the voxel with the largest z value; keep track of the z value (convert the z to a p) Now you have a list of 10k largest z values (or smallest p-values) -- for mc-z simulations these are cached in $FREESURFER_HOME/average/mult-comp-cor
For each voxel in your data get uncorrected p-value compute a corrected p-value by counting the number in the 10k list that are smaller than the uncorrected p-value (divide by 10k) compute the -log10(corrected pvalue)
Thanks for any help. Also, how would the pseudocode differ for sig.cluster.mgh vs sig.voxel.mgh?
Thanks,
Mark
________________________________ From: freesurfer-bounces@nmr.mgh.harvard.edumailto:freesurfer-bounces@nmr.mgh.harvard.edu freesurfer-bounces@nmr.mgh.harvard.edumailto:freesurfer-bounces@nmr.mgh.harvard.edu on behalf of Douglas N. Greve dgreve@mgh.harvard.edumailto:dgreve@mgh.harvard.edu Sent: Sunday, June 19, 2022 10:37 AM To: freesurfer@nmr.mgh.harvard.edumailto:freesurfer@nmr.mgh.harvard.edu freesurfer@nmr.mgh.harvard.edumailto:freesurfer@nmr.mgh.harvard.edu Subject: Re: [Freesurfer] How is cache.th40.pos.sig.voxel.mgh computed, exactly?
from mri_glmfit-sim --help csdbase.sig.voxel.mgh - the sig volume corrected for multiple comparisons on a voxel-wise basis. The threshhold and sign are irrelevant. The value at each voxel is the corrected -log10(p-value) for that voxel. from mri_glmfit-sim --help
csdbase.sig.voxel.mgh - the sig volume corrected for multiple comparisons on a voxel-wise basis. The threshhold and sign are irrelevant. The value at each voxel is the corrected -log10(p-value) for that voxel.
It is computed from a simulation in which gaussian noise is smoothed, then converted to p-values (log10(p)), then the maximum log10(p) is found. This is repeated 10,000 times to give 10k maximums. A corrected p-value for each voxel is then computed based upon the rank of the raw pvalue in this list of 10k.
On 6/10/2022 4:14 PM, Mark Ebden wrote:
External Email - Use Caution Hi,
I was wondering if anyone knows how the numbers in cache.th40.pos.sig.voxel.mgh are computed, or where I'd look to learn this. There is a one-liner in the documentationhttps://secure-web.cisco.com/1BgM8uOw5P7pBlxFWicMeyf04OzBFj2ESlbNqpldcWaoZU_NQXZt1ksDaKpC0kiO8-WtbF9Bq3UcPBsaFs4VUUK0fn8eMyXtFa9GaUTTisoGFR6cxQOdwBx5-QhcSzyg3pEkigghhvzqCRxJ-P22Jk7VpCflyWJycmZV8ABZDM1ZCJA7mctE_wnQM5zkyxKQpQQPg1yyGv1YSM6eZsItUMSdAhRyROfCCv6RX_mzvKYgA2tnZX81Z7wG7EgEzQZbB5WJ7MUd4PBQ_nojDC7mN4WzimGz3PE6DKn9FQgQIRJ4K8QbCALTY95hjlBUiNqq3PuolmaVag2t565r-u60k_A/https%3A%2F%2Furldefense.com%2Fv3%2F__https%3A%2Fsecure-web.cisco.com%2F1mZPhKugTZV0zciGbO88IW1AMYXyEgFtcZoIj7XLR0Jz1HIEvbCJkL4A7fX-p9YT9PqXmYanl22wOWqtBVNKGfpIp3t451w5ALS2dsuCwQbPF_U6gywrjK2UlE8i2ikgbsNzuv6MQQwGeEQBDvYVfd8fnL5QhJ22E194tBsbTjN3WO0QR40tF0aRy6GD8nmmZdXIwbZxDyjaLlrxSFrpVMcsPl4x8d46hpqt3oVDIlfYnGv--EBw4LtKPGi1FW3KzEcL9gLeJb4TToo63FGDRQmjyhNx3aDOZKK1Aw7T774MTIB-3EOccH_SHcGNscWvwvEb6Ou2STAxKqt8rcvZX1Q%2Fhttps%2A3A%2A2F%2A2Furldefense.com%2A2Fv3%2A2F__https%2A3A%2A2F%2A2Fsecure-web.cisco.com%2A2F1R2vQZUhHj-zAreoIH8kMlOuUPh5jYx8TyPmfmDzbM1Dl-B4qgLgEGd_WS_0Y5_08itpZ4Auiw4Ht4r-hZ9db1vTTyWFnxXY06DL9M-Ci_nUhFSEnnkt_VUhZ9nYtm6g3lKY9WxqmhllQYKLUlIVPuYUr9yQZM5iZ6Xch2DDFIJGKuCp0kg3Kjhj46CcO51Ub9WSI2iVIE6_gITNGjAVTztvV-E11_RxVX55KRwYo-EajEf4x60XUOm2hGcu4-35_LsmGynDaEemN9U59zZJ1IJbizmUoXnrJiPR51WNVRzaKtg2AbVbNm7aAc85WKKTpCNVU7IXaexwkzxZk0C3XmQ%2A2Fhttps%2A2A3A%2A2A2F%2A2A2Fsurfer.nmr.mgh.harvard.edu%2A2A2Ffswiki%2A2A2FFsTutorial%2A2A2FMultipleComparisonsV6.0__%2A3BJSUlJSUl%2A21%2A21D0zGoin7BXfl%2A21-uix2-pXnTtUAAjZD2VXdB_BxqAGHYynqpQihjlROtSs1aHk1Q-Z5k228EMsY8kR8VlVUutWd0OpqLrgcx8zEWq4ug%2A24__%3BJSUlJSUlJSUlJSUlJSUlJSUlJSUl%21%21D0zGoin7BXfl%216gLGhwESsOTJcHOed0dIj3LF1GDHkEGStMcK0ivkMGOd46nhoXiWHqmK7iqnWdTMa0X4DEHvE8LblNQ-ktBLNtYX6g%24 but I'd like the mathematical details of the correction etc. so I can determine what the final numbers (from 0 to 1) represent. I've noticed from browsing the plot in FreeView that significant areas have values close to 1, which is puzzling.
Thanks if you could point me in the right direction.
Kind regards,
Mark
Mar
[cid:image006.png@01D9C6B6.F665BB30]
Mark Ebden, D.Phil
(Pronouns: He/Him)
Research Analyst
The Hospital for Sick Children
555 University Ave, Toronto ON M5G 1X8
P 416.888.0841
________________________________
This e-mail may contain confidential, personal and/or health information(information which may be subject to legal restrictions on use, retention and/or disclosure) for the sole use of the intended recipient. Any review or distribution by anyone other than the person for whom it was originally intended is strictly prohibited. If you have received this e-mail in error, please contact the sender and delete all copies.
_______________________________________________
Freesurfer mailing list
Freesurfer@nmr.mgh.harvard.edumailto:Freesurfer@nmr.mgh.harvard.edu
MailScanner has detected a possible fraud attempt from "secure-web.cisco.com" claiming to be https://secure-web.cisco.com/1SGdusNd8PCQa18SYk0KO1dEFQmQ9q-BtMbPetigg5epHzd...https://secure-web.cisco.com/1pxF3sJqRxmoz-GQF9L7EKsdsPLftxBZk4akLcHA6jBIQzif7ISzxy5Jeg5hk8F3UXbvO84vPWJkH2kSOESJRe61Akj5_wTWea0-rVpA-vOWO8gjtWSGBmUCbLKXF94LrvarBIPNcoSsKOH-OYh4efn_yC9q1lXoZQZh0uRHshvtnGH2mS_ta0Qh5kKjN0SBxVJ_M_5GmStmQYwq6P44jTdEUzzadlxodpKXW2zLdh9QbgUKHuBbkmttju_GfhcmcqkI02smJREtssCYZM0ZTkS2JnWOpmEcewwcfrQJl33vsvWBRXOZR4Nr94cuMmj55SNZscUmJQfjeP1011lKMIQ/https%3A%2F%2Furldefense.com%2Fv3%2F__https%3A%2Fsecure-web.cisco.com%2F1jZkuJD8rRcPUuxNordBiZkfOEY3lw_VGrcGWX92_UB2kky6BvRXNI0Owmb7DCX77JOftH7ebmWMmv7BVro1RE0GNojgls8x5pqs_SjLR7gxXXwrmpbVAlHgk6m558E2UKrECuyCpRDegIbaSo3uhMtdAc_sQwam7ALA4Fe8zzzBDALxdVlBU949qIvB_lNOGS3xkJ15R6N1Gx-F8mNaMlUHsUJXNjBf5aVejVPP7KtInQ701hVsYqdKcTDUER3W98DyLEkiHspAJVlJ2ClCGIBXQ0o3EWyvwF5qSUiGH3Kv1CYDEixB967kC6T3ZE3DeIQpRMVJwISluKyJh1ay_6w%2Fhttps%2A3A%2A2F%2A2Furldefense.com%2A2Fv3%2A2F__https%2A3A%2A2F%2A2Fmail.nmr.mgh.harvard.edu%2A2Fmailman%2A2Flistinfo%2A2Ffreesurfer__%2A3B%2A21%2A21D0zGoin7BXfl%2A21-uix2-pXnTtUAAjZD2VXdB_BxqAGHYynqpQihjlROtSs1aHk1Q-Z5k228EMsY8kR8VlVUutWd0OpqLrgcx_mIhvLhg%2A24__%3BJSUlJSUlJSUlJSUlJSUlJQ%21%21D0zGoin7BXfl%216gLGhwESsOTJcHOed0dIj3LF1GDHkEGStMcK0ivkMGOd46nhoXiWHqmK7iqnWdTMa0X4DEHvE8LblNQ-ktAQPeo3TQ%24
________________________________
This e-mail may contain confidential, personal and/or health information(information which may be subject to legal restrictions on use, retention and/or disclosure) for the sole use of the intended recipient. Any review or distribution by anyone other than the person for whom it was originally intended is strictly prohibited. If you have received this e-mail in error, please contact the sender and delete all copies.
_______________________________________________
Freesurfer mailing list
Freesurfer@nmr.mgh.harvard.edumailto:Freesurfer@nmr.mgh.harvard.edu
MailScanner has detected a possible fraud attempt from "secure-web.cisco.com" claiming to be https://secure-web.cisco.com/1SGdusNd8PCQa18SYk0KO1dEFQmQ9q-BtMbPetigg5epHzd...https://secure-web.cisco.com/11ISLlVxMxG3f6TyOL5XEqbf3QrdLXV3jLVK_Nd0d4sqfdziNfFqzyDIXhHRRwt7WA1g0zmE9XRSYLMI2KsqB0RM6efFsBmb-Fh_7TK04sOKtr9RgSqpYzdFOIt4iW8gnq0U3LNLX8tqU3FQU68MuYf6GB03tkmjTNl2Tqu3Ek_J8ZlLWTLRzrXbohVSI2hIyxZWs1ZTqwnK_ZSc5oLO9r6Ti6LcY55nsu8-DTiHkh8SMEPeYdNvhHZsNpVFuiI4xJPqyh9NXMtFVu_m2BmnYRGpXM9iOb7rEs98oKwu29Fr3K8TAaaWtLc2o7-g-63bL5sbQLmA59xUmjBkqOwBaUQ/https%3A%2F%2Furldefense.com%2Fv3%2F__https%3A%2Fmail.nmr.mgh.harvard.edu%2Fmailman%2Flistinfo%2Ffreesurfer__%3B%21%21D0zGoin7BXfl%216gLGhwESsOTJcHOed0dIj3LF1GDHkEGStMcK0ivkMGOd46nhoXiWHqmK7iqnWdTMa0X4DEHvE8LblNQ-ktC6R9YODA%24
________________________________
This e-mail may contain confidential, personal and/or health information(information which may be subject to legal restrictions on use, retention and/or disclosure) for the sole use of the intended recipient. Any review or distribution by anyone other than the person for whom it was originally intended is strictly prohibited. If you have received this e-mail in error, please contact the sender and delete all copies.
_______________________________________________
Freesurfer mailing list
Freesurfer@nmr.mgh.harvard.edumailto:Freesurfer@nmr.mgh.harvard.edu
MailScanner has detected a possible fraud attempt from "secure-web.cisco.com" claiming to be https://secure-web.cisco.com/1SGdusNd8PCQa18SYk0KO1dEFQmQ9q-BtMbPetigg5epHzd...https://secure-web.cisco.com/1Q0gyyvYRYkkmwzVUlVo71SvRtk6AYZGU-reN0K_Wl8RxQNwLqYUdykFsdGmPQVIsnDkDXZ5J5Uy2dhr4FC9Xm0MaK4-HqZc-148-a0qCGzMXGzYGWzlODnBwhgTwrsShlkA4LKlqnuxW79kN5C70eAgVI-oKwcq_KyNs69-BBV3lHdUFWdb_y_XqoduYOSm75daKkpD1L5yIBpktNC2SWdj28LUwD6tCMCto-qSOH-wSHrF1v7c-RzriD9YkjwF2/https%3A%2F%2Fmail.nmr.mgh.harvard.edu%2Fmailman%2Flistinfo%2Ffreesurfer
________________________________
This e-mail may contain confidential, personal and/or health information(information which may be subject to legal restrictions on use, retention and/or disclosure) for the sole use of the intended recipient. Any review or distribution by anyone other than the person for whom it was originally intended is strictly prohibited. If you have received this e-mail in error, please contact the sender and delete all copies.
freesurfer@nmr.mgh.harvard.edu
-
 Douglas N. Greve
 -
 Mark Ebden