
Hi FreeSurfer experts,
I'm running a task-based analysis on mni305 space, running a regression of load-dependent activation on RBC folate values, regressing out the effects of age and gender.
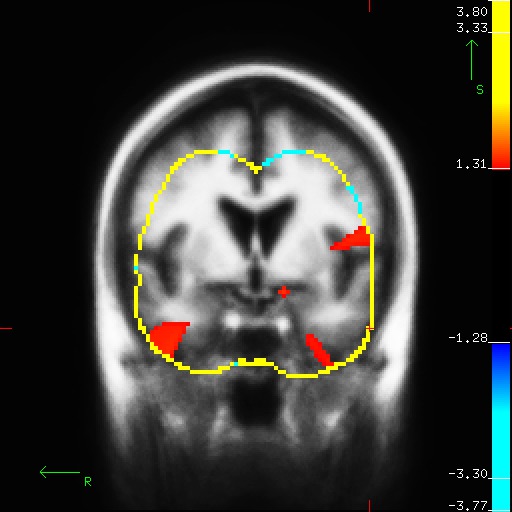
The analysis runs fine, but when I visualize the sig.mgh map in tkmedit there is a border of functional values that are ridiculously high (10000000000 and -10000000000). I've attached an image of one of the slices to this email as well as the mri_glmfit log, the fsgd file, and the contrast matrix.
My glmfit command is
mri_glmfit --y cluster/roffman/users/Stable5_PerRun/Analyses_GDD/GDD_Adults/136_GDD_2vFix_RBC_Folate/SIRP_LoadRegression_Stable5.3_012616_sm5_mni305/Cond2vFix/ces.nii.gz --fsgd /cluster/roffman/users/fsgd/GDD/136_GDD_2vFix_Covary_RBC_Folate_linear.fsgd --no-prune --fwhm 6 --C /cluster/roffman/users/fsgd/OneGroupOneCovariateRegressOut2Covariates.mtx --glmdir /cluster/roffman/users/Stable5_PerRun/Analyses_GDD/GDD_Adults/136_GDD_2vFix_RBC_Folate/SIRP_LoadRegression_Stable5.3_012616_sm5_mni305/Cond2vFix/Tal2vFix_Covary_RBCFolate_Nuis_Gender_Age_noprune
Do you know why my command is creating these artificially high values and how to fix it? Any guidance would be greatly appreciated.
Thanks,
Anais Rodriguez-Thompson Clinical Research Coordinator Brain Genomics Laboratory Martinos Center for Biomedical Imaging Massachusetts General Hospital Phone: (617) 643-3215
freesurfer@nmr.mgh.harvard.edu
-
 Rodriguez-Thompson, Anais