qdec _FDR report question (why the result of cluster stats table not match with the statistic map)

Dear Freesurfer experts,
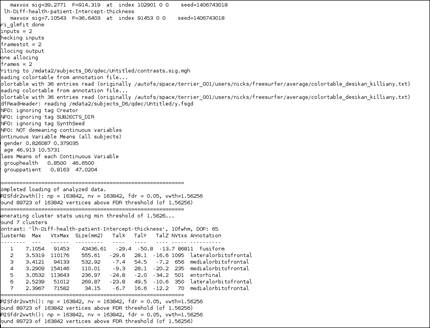
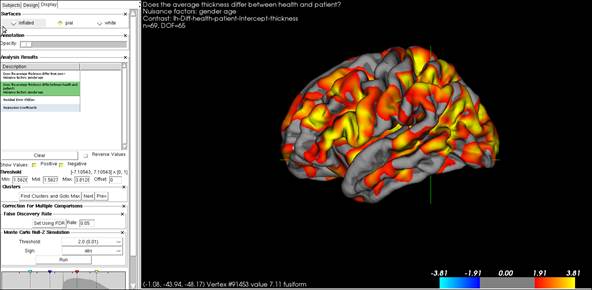
I am facing the problem to report the significant clusters which was calculated by QDEC. I did the group comparison between healthy and patients in cortical thickness, setting the threshold as FDR=0.05.however, the result of thickness map seems quite different from the contrast stats table. In the statistic map, Some area (e.g. occipital region, pre and post central gyri)showed clearly decreased In patients, but not shown in contrast output table. Why this happened? I really appreciated your help. Please find the corresponding file attached.
[cid:image001.jpg@01CFAC1C.967AB680] [cid:image003.jpg@01CFAC1C.967AB680]
Thanks for your help ! Best Guoying

what is the contrast stats table and how did you create it?
On 07/30/2014 11:35 AM, Wang, Guoying wrote:
Dear Freesurfer experts,
I am facing the problem to report the significant clusters which was calculated by QDEC. I did the group comparison between healthy and patients in cortical thickness, setting the threshold as FDR=0.05.however, the result of thickness map seems quite different from the contrast stats table. In the statistic map, Some area (e.g. occipital region, pre and post central gyri)showed clearly decreased In patients, but not shown in contrast output table. Why this happened? I really appreciated your help.
Please find the corresponding file attached.
Thanks for your help !
Best
Guoying
Freesurfer mailing list Freesurfer@nmr.mgh.harvard.edu https://mail.nmr.mgh.harvard.edu/mailman/listinfo/freesurfer
freesurfer@nmr.mgh.harvard.edu
-
 Douglas N Greve
 -
 Wang, Guoying