
Hello,
I ran cortical thickness analyses using the following contrast and fsgd. After that, I corrected for multiple comparison using monte carlo 5000 with cluster forming threshold of 2 and unsigned/2-tailed t-test (abs). I wanted to confirm my interpretation of the results.
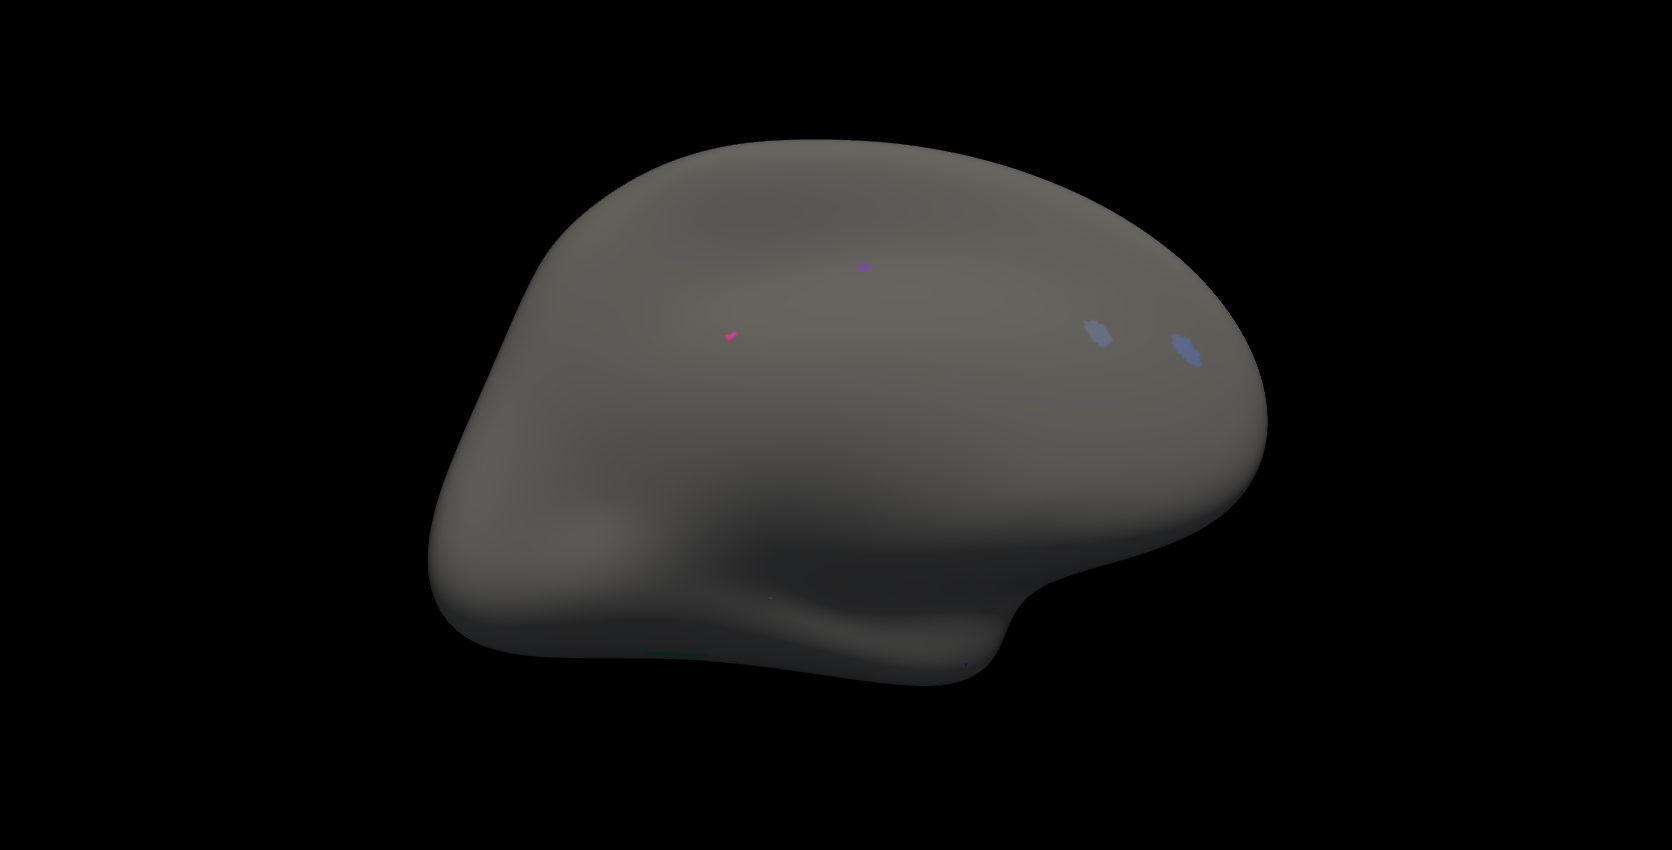
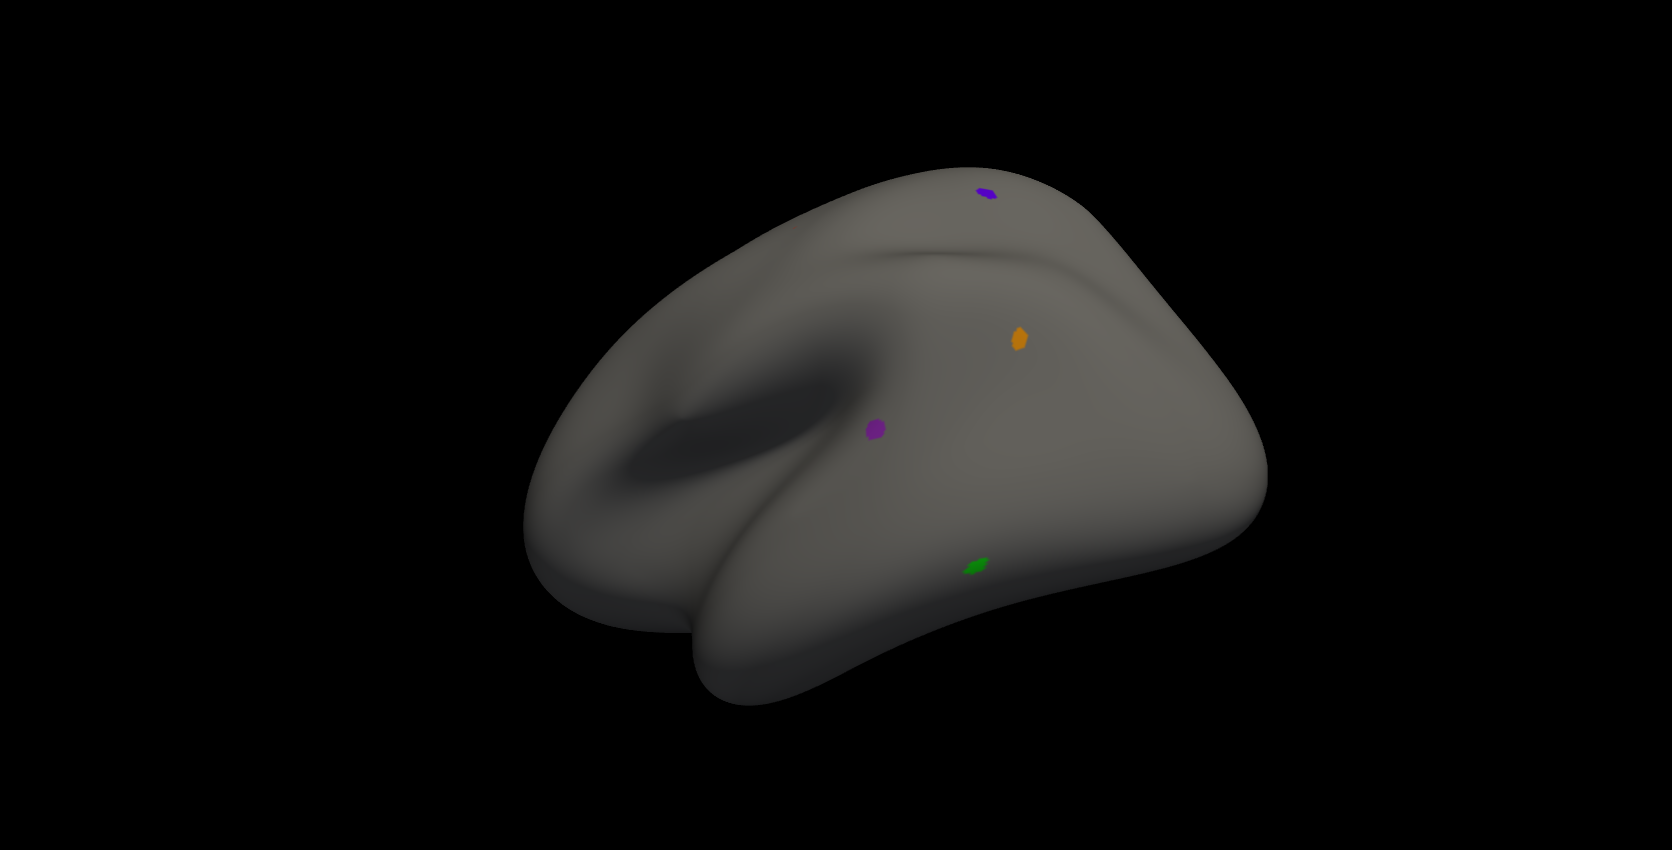
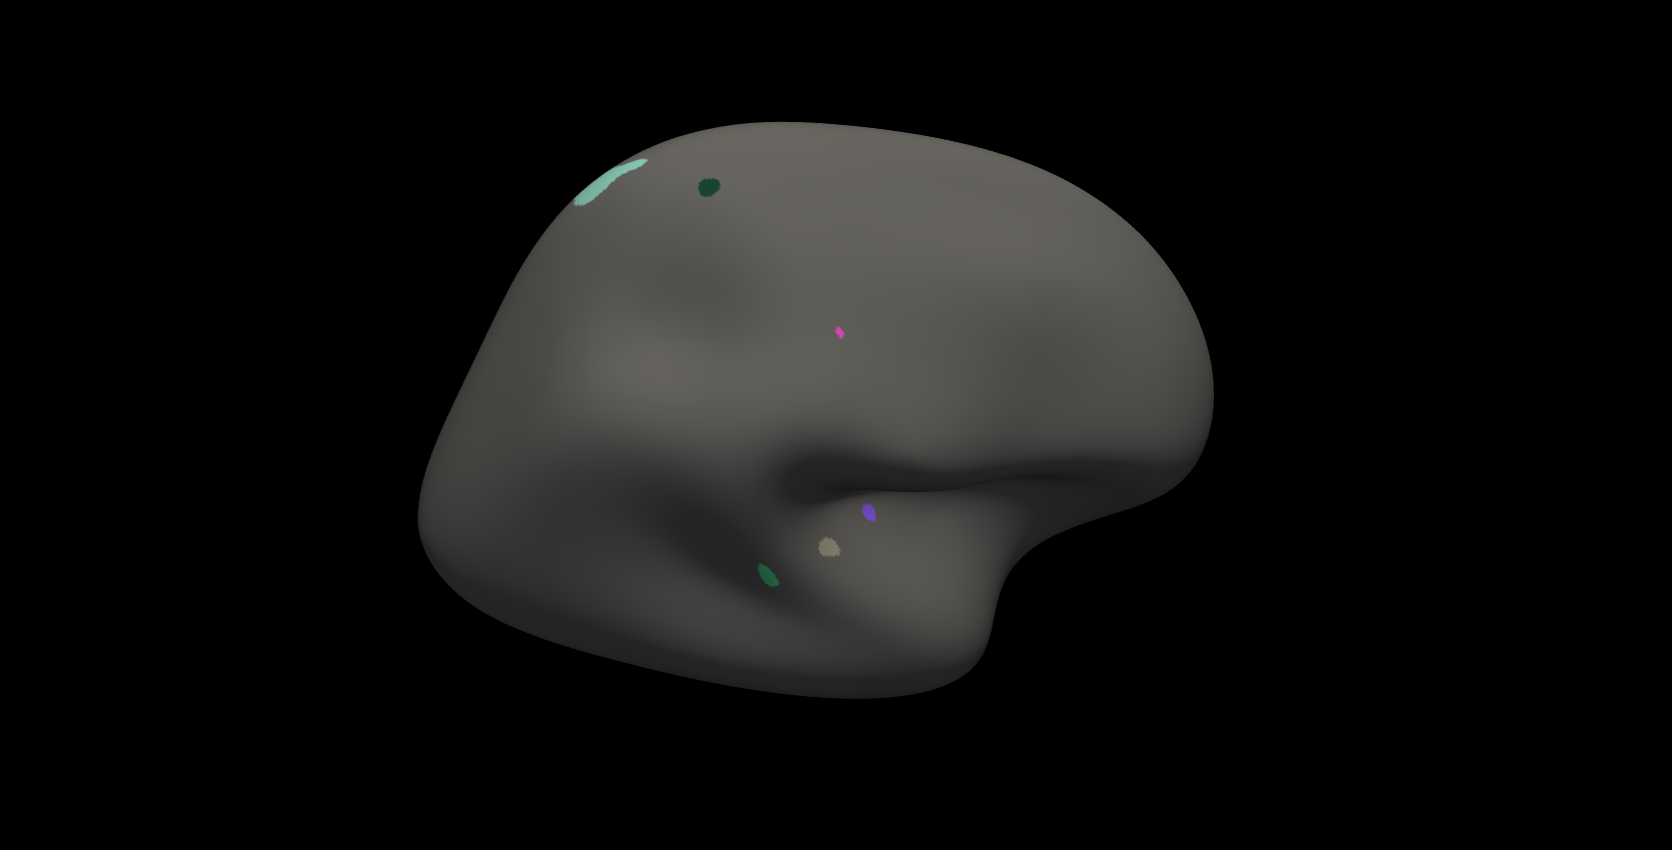
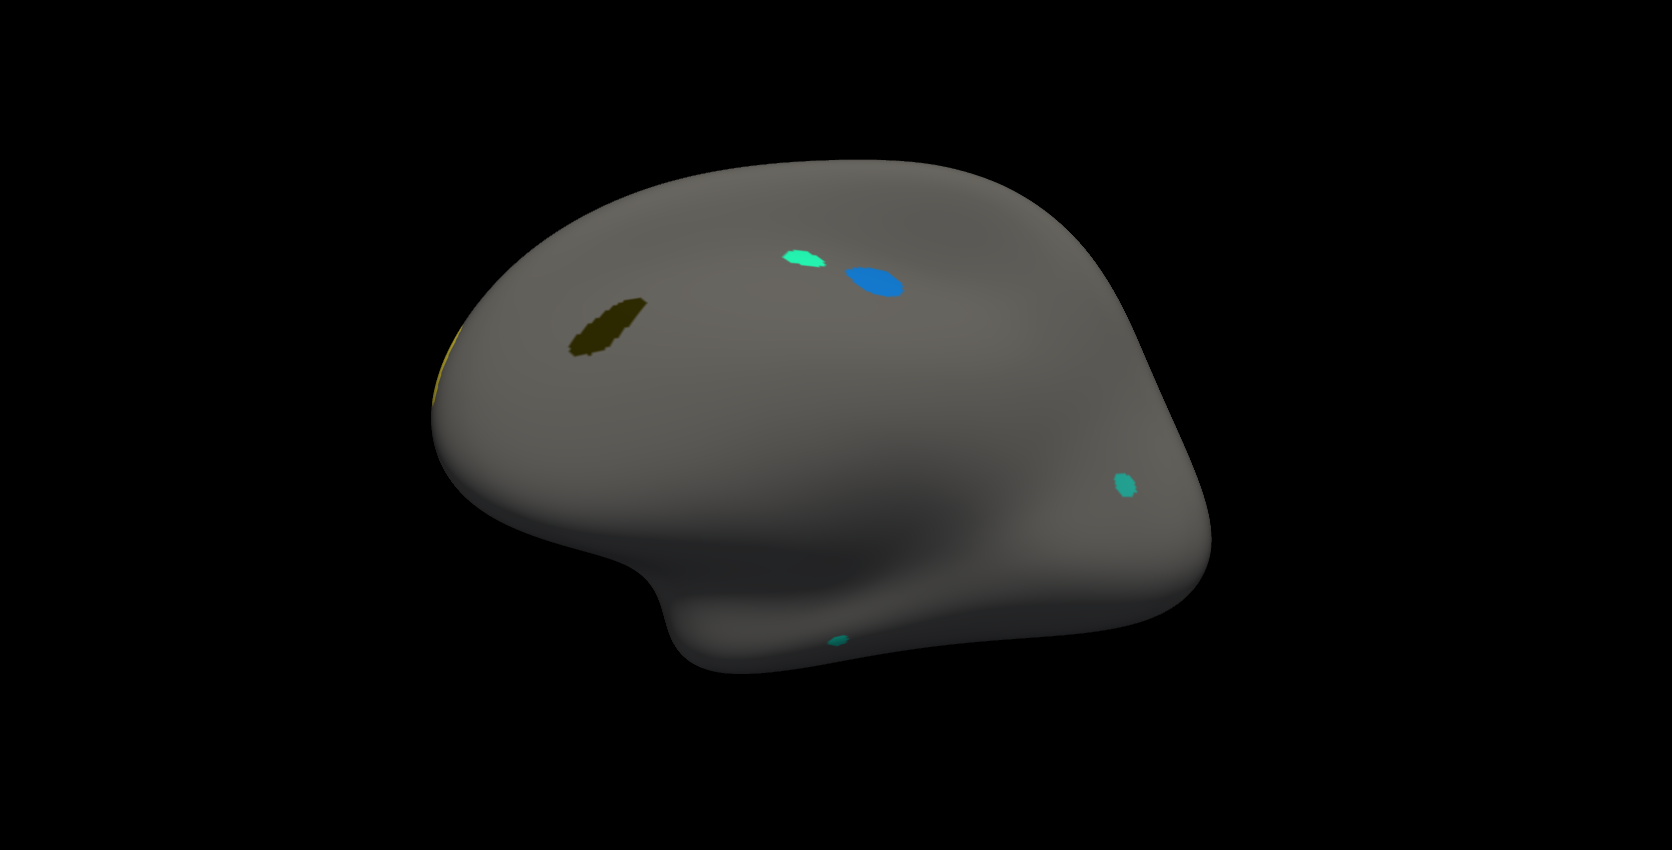
1) Since my contrast is (-1 1 0 0 representing control>stroke), it should be red/yellow and if blue, it should be control<stroke. However, I see clusters with colors different from the aformentioned (see attached screenshot). How should I interpret them?
2) I want to view the uncorrected p-values, which of the columns in the summary text file should I concentrate, and should the p < or > 0.05?
3) Looking at the CWP column in the summary text file, can I conclude that the obtained regions/clusters are significant? This is because non of the cluster-wise p-values are below 0.05 (--cwp 0.05).
4) Which of the columns represent the sign of my contrast i.e. where Control>Stroke and Control<Stroke because i used abs? Max?
FSGD file GroupDescriptorFile Title StrokevsControl Class1 Stroke Class2 Control Variable bmi Input 6001 Stroke 20 Input 8001 Control 30
Contrast: -1 1 0 0 (Control>Stroke removing the effects of bmi)
Thank you, Paul
I forgot to send the cluster summary sheet. Here is it.
# Input lh.stroke.fsgd.glmdir/contrast/sig.mgh
# Frame Number 0
# srcsubj fsaverage
# hemi lh
# surface white
# annot aparc
# SUBJECTS_DIR /Users/CT/Documents/stroke
# SearchSpace_mm2 65416.6
# SearchSpace_vtx 149953
# Bonferroni 0
# Minimum Threshold 2
# Maximum Threshold infinity
# Threshold Sign abs
# AdjustThreshWhenOneTail 1
# Area Threshold 0 mm^2
# CSD thresh 2.000000
# CSD nreps 5000
# CSD simtype mc-z
# CSD contrast contrast
# CSD confint 90.000000
# Overall max 2.26504 at vertex 146861
# Overall min -2.73325 at vertex 144073
# NClusters 13
# Total Cortical Surface Area 65416.6 (mm^2)
# FixMNI = 0
#
# ClusterNo Max VtxMax Size(mm^2) MNIX MNIY MNIZ CWP CWPLow CWPHi NVtxs Annot
1 -2.733 144073 70.23 -31.5 -61.0 -15.8 0.99400 0.99260 0.99540 101 fusiform
2 -2.537 153213 28.08 -14.2 40.2 12.1 1.00000 -0.00020 1.00000 57 superiorfrontal
3 -2.348 57351 30.35 -63.3 -39.6 8.0 1.00000 -0.00020 1.00000 77 bankssts
4 2.265 146861 20.30 -38.8 -57.9 25.4 1.00000 -0.00020 1.00000 45 inferiorparietal
5 -2.261 116880 21.63 -33.3 -48.7 60.5 1.00000 -0.00020 1.00000 45 superiorparietal
6 2.248 83406 24.49 -5.2 28.6 18.6 1.00000 -0.00020 1.00000 47 caudalanteriorcingulate
7 -2.182 90669 20.62 -50.9 -56.2 -12.6 1.00000 -0.00020 1.00000 28 inferiortemporal
8 2.143 32579 5.79 -7.9 -10.3 40.1 1.00000 -0.00020 1.00000 14 posteriorcingulate
9 -2.052 159218 3.21 -5.0 -33.8 32.9 1.00000 -0.00020 1.00000 7 isthmuscingulate
10 -2.050 127337 7.16 -17.7 6.2 -15.5 1.00000 -0.00020 1.00000 16 lateralorbitofrontal
11 -2.013 93626 1.61 -37.4 -13.7 54.8 1.00000 -0.00020 1.00000 3 precentral
12 -2.006 9896 0.87 -27.3 -0.6 -35.9 1.00000 -0.00020 1.00000 2 entorhinal
13 -2.001 75892 0.47 -22.0 -33.4 -11.8 1.00000 -0.00020 1.00000 1 parahippocampal
On Fri, Sep 22, 2017 at 9:37 PM, miracle ozzoude miracooloz@gmail.com wrote:
Hello,
I ran cortical thickness analyses using the following contrast and fsgd. After that, I corrected for multiple comparison using monte carlo 5000 with cluster forming threshold of 2 and unsigned/2-tailed t-test (abs). I wanted to confirm my interpretation of the results.
- Since my contrast is (-1 1 0 0 representing control>stroke), it should
be red/yellow and if blue, it should be control<stroke. However, I see clusters with colors different from the aformentioned (see attached screenshot). How should I interpret them?
- I want to view the uncorrected p-values, which of the columns in the
summary text file should I concentrate, and should the p < or > 0.05?
- Looking at the CWP column in the summary text file, can I conclude that
the obtained regions/clusters are significant? This is because non of the cluster-wise p-values are below 0.05 (--cwp 0.05).
- Which of the columns represent the sign of my contrast i.e. where
Control>Stroke and Control<Stroke because i used abs? Max?
FSGD file GroupDescriptorFile Title StrokevsControl Class1 Stroke Class2 Control Variable bmi Input 6001 Stroke 20 Input 8001 Control 30
Contrast: -1 1 0 0 (Control>Stroke removing the effects of bmi)
Thank you, Paul

On 09/24/2017 02:17 PM, miracle ozzoude wrote:
Sent from my BlackBerry 10 smartphone. *From: *miracle ozzoude miracooloz@gmail.com *Sent: *Friday, September 22, 2017 9:37 PM *To: *Douglas N Greve *Subject: *sim-sign abs/ cluster summary results confirmation
Hello,
I ran cortical thickness analyses using the following contrast and fsgd. After that, I corrected for multiple comparison using monte carlo 5000 with cluster forming threshold of 2 and unsigned/2-tailed t-test (abs). I wanted to confirm my interpretation of the results.
- Since my contrast is (-1 1 0 0 representing control>stroke), it
should be red/yellow and if blue, it should be control<stroke. However, I see clusters with colors different from the aformentioned (see attached screenshot). How should I interpret them?
That is a parcellation/segmentation of the clusters, and the colors don't have inherent value. Eg, when you look at the aparc, you see precentral and postcentral are red and blue, but those colors don't mean anything, they are just a way to distinguish between areas. You have chosen abs, so it is not possible to interpret the sign.
- I want to view the uncorrected p-values, which of the columns in
the summary text file should I concentrate, and should the p < or > 0.05?
The uncorrected p-values are the voxel-wise values. The stats file will have the maximum uncorrected p-value (actually, -log10(p)).
- Looking at the CWP column in the summary text file, can I conclude
that the obtained regions/clusters are significant? This is because non of the cluster-wise p-values are below 0.05 (--cwp 0.05).
Not sure which column you are talking about. All the CWP values are close to 1, so nothing is significant
- Which of the columns represent the sign of my contrast i.e. where
Control>Stroke and Control<Stroke because i used abs? Max?
if you used abs, then you can't interpret sign. Having said that, the "Max" column will indicate the sign of the vertex with the maximum -log10(p), and that will probably be the sign of the entire cluster
FSGD file GroupDescriptorFile Title StrokevsControl Class1 Stroke Class2 Control Variable bmi Input 6001 Stroke 20 Input 8001 Control 30
Contrast: -1 1 0 0 (Control>Stroke removing the effects of bmi)
Thank you, Paul
Freesurfer mailing list Freesurfer@nmr.mgh.harvard.edu https://mail.nmr.mgh.harvard.edu/mailman/listinfo/freesurfer
Hello Doug,
Thank you very much for the response. Any reason why I have a list of clusters when none of them were significant (based on the CWP). I thought clusters that appeared on the summary text file should always be significant because they survived correction.
Best, Paul
On Mon, Sep 25, 2017 at 6:01 PM, Douglas N Greve greve@nmr.mgh.harvard.edu wrote:
On 09/24/2017 02:17 PM, miracle ozzoude wrote:
Sent from my BlackBerry 10 smartphone. *From: *miracle ozzoude miracooloz@gmail.com *Sent: *Friday, September 22, 2017 9:37 PM *To: *Douglas N Greve *Subject: *sim-sign abs/ cluster summary results confirmation
Hello,
I ran cortical thickness analyses using the following contrast and fsgd. After that, I corrected for multiple comparison using monte carlo 5000 with cluster forming threshold of 2 and unsigned/2-tailed t-test (abs). I wanted to confirm my interpretation of the results.
- Since my contrast is (-1 1 0 0 representing control>stroke), it
should be red/yellow and if blue, it should be control<stroke. However, I see clusters with colors different from the aformentioned (see attached screenshot). How should I interpret them?
That is a parcellation/segmentation of the clusters, and the colors don't have inherent value. Eg, when you look at the aparc, you see precentral and postcentral are red and blue, but those colors don't mean anything, they are just a way to distinguish between areas. You have chosen abs, so it is not possible to interpret the sign.
- I want to view the uncorrected p-values, which of the columns in
the summary text file should I concentrate, and should the p < or > 0.05?
The uncorrected p-values are the voxel-wise values. The stats file will have the maximum uncorrected p-value (actually, -log10(p)).
- Looking at the CWP column in the summary text file, can I conclude
that the obtained regions/clusters are significant? This is because non of the cluster-wise p-values are below 0.05 (--cwp 0.05).
Not sure which column you are talking about. All the CWP values are close to 1, so nothing is significant
- Which of the columns represent the sign of my contrast i.e. where
Control>Stroke and Control<Stroke because i used abs? Max?
if you used abs, then you can't interpret sign. Having said that, the "Max" column will indicate the sign of the vertex with the maximum -log10(p), and that will probably be the sign of the entire cluster
FSGD file GroupDescriptorFile Title StrokevsControl Class1 Stroke Class2 Control Variable bmi Input 6001 Stroke 20 Input 8001 Control 30
Contrast: -1 1 0 0 (Control>Stroke removing the effects of bmi)
Thank you, Paul
Freesurfer mailing list Freesurfer@nmr.mgh.harvard.edu https://mail.nmr.mgh.harvard.edu/mailman/listinfo/freesurfer
-- Douglas N. Greve, Ph.D. MGH-NMR Center greve@nmr.mgh.harvard.edu Phone Number: 617-724-2358 Fax: 617-726-7422
Bugs: surfer.nmr.mgh.harvard.edu/fswiki/BugReporting FileDrop: https://gate.nmr.mgh.harvard.edu/filedrop2 www.nmr.mgh.harvard.edu/facility/filedrop/index.html Outgoing: ftp://surfer.nmr.mgh.harvard.edu/transfer/outgoing/flat/greve/
Freesurfer mailing list Freesurfer@nmr.mgh.harvard.edu https://mail.nmr.mgh.harvard.edu/mailman/listinfo/freesurfer
The information in this e-mail is intended only for the person to whom it is addressed. If you believe this e-mail was sent to you in error and the e-mail contains patient information, please contact the Partners Compliance HelpLine at http://www.partners.org/complianceline . If the e-mail was sent to you in error but does not contain patient information, please contact the sender and properly dispose of the e-mail.
freesurfer@nmr.mgh.harvard.edu
-
 Douglas N Greve
 -
 miracle ozzoude