
Dear Freesurfer experts,
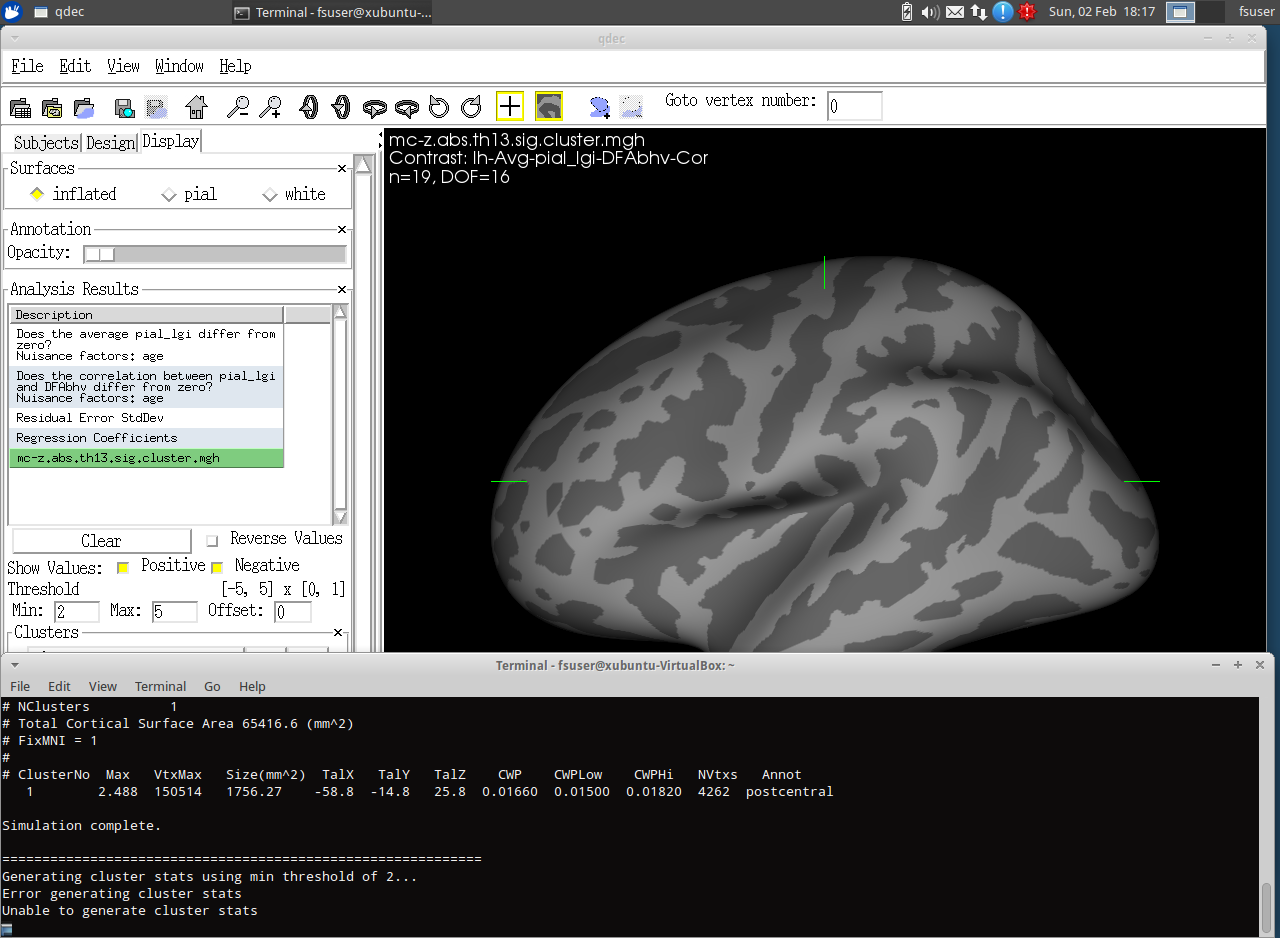
I ran a QDEC analysis for structural data and found, after Monte-Carlo correction@0.05, one significant cluster, annotated as "postcentral" (see screenshot attached). The stats associated with it are displayed in the terminal, however the statistical map on the template brain is blank.
Also, when I press the "Find Cluster and Go To Max" button, I receive an error that no stats can be generated for that cluster.
Not sure if it's relevant, but my dependent variables of interest in this analysis were thickness and local gyrification index (lGI). It seems I'm getting the above problem only when lGI is the DV, and whether or not there is a group factor among the categorical predictors. I do have, however, lGI analyses where the significant cluster shows up fine both on the template and in the terminal window.
Can anyone help? Many thanks in advance!
Best wishes, Tudor

Hi Tudor,
Seems to me that it could be just a display issue, as you didn't adjust the visualisation threshold (you have min = 2), whereas you run your Monte Carlo with a threshold of 0.05 (i.e. 1.3), and your cluster seem to be just in between.
Hope it helps,
Marie
On Feb 2, 2014, at 10:55 AM, Tudor Popescu tudor3@gmail.com wrote:
Dear Freesurfer experts,
I ran a QDEC analysis for structural data and found, after Monte-Carlo correction@0.05, one significant cluster, annotated as "postcentral" (see screenshot attached). The stats associated with it are displayed in the terminal, however the statistical map on the template brain is blank.
Also, when I press the "Find Cluster and Go To Max" button, I receive an error that no stats can be generated for that cluster.
Not sure if it's relevant, but my dependent variables of interest in this analysis were thickness and local gyrification index (lGI). It seems I'm getting the above problem only when lGI is the DV, and whether or not there is a group factor among the categorical predictors. I do have, however, lGI analyses where the significant cluster shows up fine both on the template and in the terminal window.
Can anyone help? Many thanks in advance!
Best wishes, Tudor <2014.02.02, 18-17-31.png>_______________________________________________ Freesurfer mailing list Freesurfer@nmr.mgh.harvard.edu https://mail.nmr.mgh.harvard.edu/mailman/listinfo/freesurfer
The information in this e-mail is intended only for the person to whom it is addressed. If you believe this e-mail was sent to you in error and the e-mail contains patient information, please contact the Partners Compliance HelpLine at http://www.partners.org/complianceline . If the e-mail was sent to you in error but does not contain patient information, please contact the sender and properly dispose of the e-mail.
Hi Marie,
Ah yes, thanks, that was indeed the problem! Strangely though, the Max for that cluster is t=2.488 initially, above the default t=2 Min value in the QDEC visualisation settings! But after pressing the FindClusters button, Max becomes t=1.779 and so the Min probably needs to be lowered in order for the entire cluster (not just its Max vertex) to become visible. Or am I misunderstanding something here?...
Tudor
On 2 February 2014 20:45, Marie Schaer Marie.Schaer@unige.ch wrote:
Hi Tudor,
Seems to me that it could be just a display issue, as you didn't adjust the visualisation threshold (you have min = 2), whereas you run your Monte Carlo with a threshold of 0.05 (i.e. 1.3), and your cluster seem to be just in between.
Hope it helps,
Marie
On Feb 2, 2014, at 10:55 AM, Tudor Popescu tudor3@gmail.com wrote:
Dear Freesurfer experts,
I ran a QDEC analysis for structural data and found, after Monte-Carlo
correction@0.05, one significant cluster, annotated as "postcentral" (see screenshot attached). The stats associated with it are displayed in the terminal, however the statistical map on the template brain is blank.
Also, when I press the "Find Cluster and Go To Max" button, I receive an
error that no stats can be generated for that cluster.
Not sure if it's relevant, but my dependent variables of interest in
this analysis were thickness and local gyrification index (lGI). It seems I'm getting the above problem only when lGI is the DV, and whether or not there is a group factor among the categorical predictors. I do have, however, lGI analyses where the significant cluster shows up fine both on the template and in the terminal window.
Can anyone help? Many thanks in advance!
Best wishes, Tudor <2014.02.02, 18-17-31.png>_______________________________________________ Freesurfer mailing list Freesurfer@nmr.mgh.harvard.edu https://mail.nmr.mgh.harvard.edu/mailman/listinfo/freesurfer
The information in this e-mail is intended only for the person to whom
it is
addressed. If you believe this e-mail was sent to you in error and the
contains patient information, please contact the Partners Compliance
HelpLine at
http://www.partners.org/complianceline . If the e-mail was sent to you
in error
but does not contain patient information, please contact the sender and
properly
dispose of the e-mail.

You have the "Min" set to 2 which means that you are not seeing cluster less significant than p=.01. Try setting it to 1.3 (p=.05) doug
On 02/02/2014 01:55 PM, Tudor Popescu wrote:
Dear Freesurfer experts,
I ran a QDEC analysis for structural data and found, after Monte-Carlo correction@0.05, one significant cluster, annotated as "postcentral" (see screenshot attached). The stats associated with it are displayed in the terminal, however the statistical map on the template brain is blank.
Also, when I press the "Find Cluster and Go To Max" button, I receive an error that no stats can be generated for that cluster.
Not sure if it's relevant, but my dependent variables of interest in this analysis were thickness and local gyrification index (lGI). It seems I'm getting the above problem only when lGI is the DV, and whether or not there is a group factor among the categorical predictors. I do have, however, lGI analyses where the significant cluster shows up fine both on the template and in the terminal window.
Can anyone help? Many thanks in advance!
Best wishes, Tudor
Freesurfer mailing list Freesurfer@nmr.mgh.harvard.edu https://mail.nmr.mgh.harvard.edu/mailman/listinfo/freesurfer
Thanks Doug. I only now gather that the statistical maps are displayed in terms of the negative common (base 10) logarithm of the p-value. Two questions: 1) I'm probably wrong here, but if they were displayed (and thresholded) in terms of the corresponding *t*-value instead, would that not be more convenient since you could also see at a glance the direction of the effect (i.e. whether group A or B has the greater thickness), rather than having to check the group means in the output files of the design? 2) given that p-values lie between 0 and 1, -log10(p) should be between 0 and infinity. How come, then, that the colour-bar also shows negative values?
Tudor
On 4 February 2014 17:09, Douglas N Greve greve@nmr.mgh.harvard.edu wrote:
You have the "Min" set to 2 which means that you are not seeing cluster less significant than p=.01. Try setting it to 1.3 (p=.05) doug
On 02/02/2014 01:55 PM, Tudor Popescu wrote:
Dear Freesurfer experts,
I ran a QDEC analysis for structural data and found, after Monte-Carlo correction@0.05, one significant cluster, annotated as "postcentral" (see screenshot attached). The stats associated with it are displayed in the terminal, however the statistical map on the template brain is blank.
Also, when I press the "Find Cluster and Go To Max" button, I receive an error that no stats can be generated for that cluster.
Not sure if it's relevant, but my dependent variables of interest in this analysis were thickness and local gyrification index (lGI). It seems I'm getting the above problem only when lGI is the DV, and whether or not there is a group factor among the categorical predictors. I do have, however, lGI analyses where the significant cluster shows up fine both on the template and in the terminal window.
Can anyone help? Many thanks in advance!
Best wishes, Tudor
Freesurfer mailing list Freesurfer@nmr.mgh.harvard.edu https://mail.nmr.mgh.harvard.edu/mailman/listinfo/freesurfer
-- Douglas N. Greve, Ph.D. MGH-NMR Center greve@nmr.mgh.harvard.edu Phone Number: 617-724-2358 Fax: 617-726-7422
Bugs: surfer.nmr.mgh.harvard.edu/fswiki/BugReporting FileDrop: https://gate.nmr.mgh.harvard.edu/filedrop2 www.nmr.mgh.harvard.edu/facility/filedrop/index.html Outgoing: ftp://surfer.nmr.mgh.harvard.edu/transfer/outgoing/flat/greve/
Freesurfer mailing list Freesurfer@nmr.mgh.harvard.edu https://mail.nmr.mgh.harvard.edu/mailman/listinfo/freesurfer
The information in this e-mail is intended only for the person to whom it is addressed. If you believe this e-mail was sent to you in error and the e-mail contains patient information, please contact the Partners Compliance HelpLine at http://www.partners.org/complianceline . If the e-mail was sent to you in error but does not contain patient information, please contact the sender and properly dispose of the e-mail.
The value displayed is actually sign(effect)*log10(p), which I think answers both of your questions doug
On 02/04/2014 01:00 PM, Tudor Popescu wrote:
Thanks Doug. I only now gather that the statistical maps are displayed in terms of the negative common (base 10) logarithm of the p-value. Two questions:
- I'm probably wrong here, but if they were displayed (and
thresholded) in terms of the corresponding *t*-value instead, would that not be more convenient since you could also see at a glance the direction of the effect (i.e. whether group A or B has the greater thickness), rather than having to check the group means in the output files of the design? 2) given that p-values lie between 0 and 1, -log10(p) should be between 0 and infinity. How come, then, that the colour-bar also shows negative values?
Tudor
On 4 February 2014 17:09, Douglas N Greve <greve@nmr.mgh.harvard.edu mailto:greve@nmr.mgh.harvard.edu> wrote:
You have the "Min" set to 2 which means that you are not seeing
cluster
less significant than p=.01. Try setting it to 1.3 (p=.05)
doug

On 02/02/2014 01:55 PM, Tudor Popescu wrote:
> Dear Freesurfer experts,
>
> I ran a QDEC analysis for structural data and found, after
Monte-Carlo
> correction@0.05, one significant cluster, annotated as "postcentral"
> (see screenshot attached). The stats associated with it are
displayed
> in the terminal, however the statistical map on the template
brain is
> blank.
>
> Also, when I press the "Find Cluster and Go To Max" button, I
receive
> an error that no stats can be generated for that cluster.
>
> Not sure if it's relevant, but my dependent variables of interest in
> this analysis were thickness and local gyrification index (lGI). It
> seems I'm getting the above problem only when lGI is the DV, and
> whether or not there is a group factor among the categorical
> predictors. I do have, however, lGI analyses where the significant
> cluster shows up fine both on the template and in the terminal
window.
>
> Can anyone help? Many thanks in advance!
>
> Best wishes,
> Tudor
>
>
> _______________________________________________
> Freesurfer mailing list
> Freesurfer@nmr.mgh.harvard.edu
<mailto:Freesurfer@nmr.mgh.harvard.edu>
> https://mail.nmr.mgh.harvard.edu/mailman/listinfo/freesurfer

--
Douglas N. Greve, Ph.D.
MGH-NMR Center
greve@nmr.mgh.harvard.edu <mailto:greve@nmr.mgh.harvard.edu>
Phone Number: 617-724-2358
Fax: 617-726-7422

Bugs: surfer.nmr.mgh.harvard.edu/fswiki/BugReporting
<http://surfer.nmr.mgh.harvard.edu/fswiki/BugReporting>
FileDrop: https://gate.nmr.mgh.harvard.edu/filedrop2
www.nmr.mgh.harvard.edu/facility/filedrop/index.html
<http://www.nmr.mgh.harvard.edu/facility/filedrop/index.html>
Outgoing:
ftp://surfer.nmr.mgh.harvard.edu/transfer/outgoing/flat/greve/

_______________________________________________
Freesurfer mailing list
Freesurfer@nmr.mgh.harvard.edu <mailto:Freesurfer@nmr.mgh.harvard.edu>
https://mail.nmr.mgh.harvard.edu/mailman/listinfo/freesurfer


The information in this e-mail is intended only for the person to
whom it is
addressed. If you believe this e-mail was sent to you in error and
the e-mail
contains patient information, please contact the Partners
Compliance HelpLine at
http://www.partners.org/complianceline . If the e-mail was sent to
you in error
but does not contain patient information, please contact the
sender and properly
dispose of the e-mail.
It does indeed, thanks Doug T
On 4 February 2014 18:19, Douglas N Greve greve@nmr.mgh.harvard.edu wrote:
The value displayed is actually sign(effect)*log10(p), which I think answers both of your questions doug
On 02/04/2014 01:00 PM, Tudor Popescu wrote:
Thanks Doug. I only now gather that the statistical maps are displayed in terms of the negative common (base 10) logarithm of the p-value. Two questions:
- I'm probably wrong here, but if they were displayed (and
thresholded) in terms of the corresponding *t*-value instead, would that not be more convenient since you could also see at a glance the direction of the effect (i.e. whether group A or B has the greater thickness), rather than having to check the group means in the output files of the design? 2) given that p-values lie between 0 and 1, -log10(p) should be between 0 and infinity. How come, then, that the colour-bar also shows negative values?
Tudor
On 4 February 2014 17:09, Douglas N Greve <greve@nmr.mgh.harvard.edu mailto:greve@nmr.mgh.harvard.edu> wrote:
You have the "Min" set to 2 which means that you are not seeing
cluster
less significant than p=.01. Try setting it to 1.3 (p=.05)
doug

On 02/02/2014 01:55 PM, Tudor Popescu wrote:
> Dear Freesurfer experts,
>
> I ran a QDEC analysis for structural data and found, after
Monte-Carlo
> correction@0.05, one significant cluster, annotated as
"postcentral"
> (see screenshot attached). The stats associated with it are
displayed
> in the terminal, however the statistical map on the template
brain is
> blank.
>
> Also, when I press the "Find Cluster and Go To Max" button, I
receive
> an error that no stats can be generated for that cluster.
>
> Not sure if it's relevant, but my dependent variables of interest
in
> this analysis were thickness and local gyrification index (lGI). It
> seems I'm getting the above problem only when lGI is the DV, and
> whether or not there is a group factor among the categorical
> predictors. I do have, however, lGI analyses where the significant
> cluster shows up fine both on the template and in the terminal
window.
>
> Can anyone help? Many thanks in advance!
>
> Best wishes,
> Tudor
>
>
> _______________________________________________
> Freesurfer mailing list
> Freesurfer@nmr.mgh.harvard.edu
<mailto:Freesurfer@nmr.mgh.harvard.edu>
> https://mail.nmr.mgh.harvard.edu/mailman/listinfo/freesurfer

--
Douglas N. Greve, Ph.D.
MGH-NMR Center
greve@nmr.mgh.harvard.edu <mailto:greve@nmr.mgh.harvard.edu>
Phone Number: 617-724-2358
Fax: 617-726-7422

Bugs: surfer.nmr.mgh.harvard.edu/fswiki/BugReporting
<http://surfer.nmr.mgh.harvard.edu/fswiki/BugReporting>
FileDrop: https://gate.nmr.mgh.harvard.edu/filedrop2
www.nmr.mgh.harvard.edu/facility/filedrop/index.html
<http://www.nmr.mgh.harvard.edu/facility/filedrop/index.html>
Outgoing:
ftp://surfer.nmr.mgh.harvard.edu/transfer/outgoing/flat/greve/

_______________________________________________
Freesurfer mailing list
Freesurfer@nmr.mgh.harvard.edu <mailto:
Freesurfer@nmr.mgh.harvard.edu>
https://mail.nmr.mgh.harvard.edu/mailman/listinfo/freesurfer


The information in this e-mail is intended only for the person to
whom it is
addressed. If you believe this e-mail was sent to you in error and
the e-mail
contains patient information, please contact the Partners
Compliance HelpLine at
http://www.partners.org/complianceline . If the e-mail was sent to
you in error
but does not contain patient information, please contact the
sender and properly
dispose of the e-mail.
-- Douglas N. Greve, Ph.D. MGH-NMR Center greve@nmr.mgh.harvard.edu Phone Number: 617-724-2358 Fax: 617-726-7422
Bugs: surfer.nmr.mgh.harvard.edu/fswiki/BugReporting FileDrop: https://gate.nmr.mgh.harvard.edu/filedrop2 www.nmr.mgh.harvard.edu/facility/filedrop/index.html Outgoing: ftp://surfer.nmr.mgh.harvard.edu/transfer/outgoing/flat/greve/
Freesurfer mailing list Freesurfer@nmr.mgh.harvard.edu https://mail.nmr.mgh.harvard.edu/mailman/listinfo/freesurfer
freesurfer@nmr.mgh.harvard.edu
-
 Douglas N Greve
 -
 Marie Schaer
 -
 Tudor Popescu