
External Email - Use Caution
Hi,
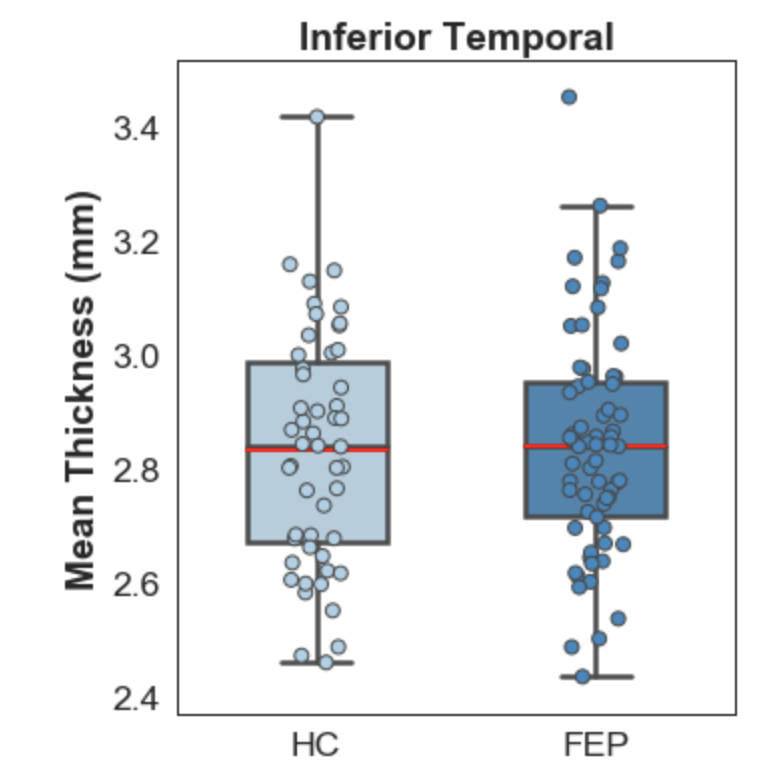
I plotted the data from the *.y.ocn.dat file and the graph still shows no apparent significant difference between the groups (see attached pic). Then I found a post with the following:
the ocn.dat files have data that is uncorrected in that sense and might need to nuisance factors removed before plotting.
There is a design matrix in there (Xg.dat). You can load that into matlab along with the ocn.dat, compute beta = inv(X'*X)*(X'*ocn)
to get the betas. You can then compute yhat = X2*beta2 where X2 has nuisance columns removed and beta2 has the same nuisance coefficients removed, then treat yhat as your data to be plotted.
I tried that since I have 2 nuisance factors (age and TICV) and want to plot my significant cluster w/o any nuisance effects. This is what I get
1.8973
1.8973
1.8973
…
3.4728
3.4728
3.4728
…
Are these the mean averages for each group (cortical thickness). If so, is there a way to get a score for each subject?
Best,
Omar
[cid:image001.png@01D568A6.6E149480]
Look in the *.y.ocn.dat file.
From mri_glmfit-sim --help
csdbase.y.ocn.dat - this is a summary of the input (y) over each
cluster. It has a column for each cluster. Each row is a subject. The
value is the average of the input (y) in each cluster. This is a
simple text file.
On 9/3/2019 5:16 PM, Maximo, Jose Omar wrote:
External Email - Use Caution
Hi,
Which specific file should I load? I see cluster.mgh, cluster.summary, sign.ocn.annot, sig.ocn.mgh, sig.vertex.mgh, and pdf.dat.
How can I extract the values from fsaverage space?
Basically, what is the correct way to extract values from these significant clusters?
Many thanks,
Omar
Date: Tue, 3 Sep 2019 15:15:02 +0000
From: "Greve, Douglas N.,Ph.D." <DGREVE at mgh.harvard.edu<https://mail.nmr.mgh.harvard.edu/mailman/listinfo/freesurfer>>
Subject: Re: [Freesurfer] qdec contrast and data extraction
To: "freesurfer at nmr.mgh.harvard.edu<https://mail.nmr.mgh.harvard.edu/mailman/listinfo/freesurfer>" <freesurfer at nmr.mgh.harvard.edu<https://mail.nmr.mgh.harvard.edu/mailman/listinfo/freesurfer>>
Message-ID: <2286f9bf-37a4-1be9-2252-0bccc833a218 at mgh.harvard.edu<https://mail.nmr.mgh.harvard.edu/mailman/listinfo/freesurfer>>
Content-Type: text/plain; charset="utf-8"
You might have done something wrong along the way. When you run the montecarlo correction, it will create a file with the thickness values in it for each cluster. the first thing to do is to load that and see if you see the expected differences. The other thing is to not go back into native space to extract the numbers. There are several operations that happen as it moves into fsaverage space and in preparation for group analysis (interpolation, and smoothing); sometimes these make a big difference. if the ROI is small, it may not map accurately back into the native space (and you should not need to draw it in the first place)
On 8/30/2019 11:36 AM, Maximo, Jose Omar wrote:
External Email - Use Caution
Hi,
I have a question:
My design is 2 groups (HC and Patients in that respective order) and 2 nuisance factors (age and eTIV). When I look at the average volume difference between the 2 groups, I get blue and red clusters. I presume the color coding is where each group is greater than the other (Blue = Patients > HC and Red = HC > Patients).
Then, I processed to extract individual values from each cluster in order to plot them. When I extract data from the blue clusters and plot them, the two groups show no difference in thickness at all, whereas when I look at volume, HC show more than patients in blue clusters (see attached figure). I would assume that both figures would show patients > HC based on the negative statistic.
Am I interpreting the colors wrong? Or am I doing something wrong?
These are my steps 1) After applying montecarlo correction, I drew my ROIs to extract the data from; 2) map it onto every single subject; and then 3) used mris_anatomical_stats to extract the data from each subject.
Any suggestions are welcome.
Best,
Omar
Jose O. Maximo, Ph.D. | Postdoctoral Fellow
Department of Psychiatry & Behavioral Neurobiology
UAB School of Medicine
University of Alabama at Birmingham
Cell Phone: (619) 252-3492
Email: jomaximo at uabmc.edu<https://mail.nmr.mgh.harvard.edu/mailman/listinfo/freesurfer><mailto:jomaximo at uabmc.edu<https://mail.nmr.mgh.harvard.edu/mailman/listinfo/freesurfer>>

If you say y = ocn.dat, then beta = (X'*X)*X'*y; res = y - X*beta; yhat = X(:,1:2)*beta(1:2) + res; yhat will be a score for each subject with the nuisance variables removed.
On 9/11/19 2:40 PM, Maximo, Jose Omar wrote:
External Email - Use Caution
Hi,
I plotted the data from the *.y.ocn.dat file and the graph still shows no apparent significant difference between the groups (see attached pic). Then I found a post with the following:
the ocn.dat files have data that is uncorrected in that sense and might need to nuisance factors removed before plotting.
There is a design matrix in there (Xg.dat). You can load that into matlab along with the ocn.dat, compute beta = inv(X'*X)*(X'*ocn)
to get the betas. You can then compute yhat = X2*beta2 where X2 has nuisance columns removed and beta2 has the same nuisance coefficients removed, then treat yhat as your data to be plotted.
I tried that since I have 2 nuisance factors (age and TICV) and want to plot my significant cluster w/o any nuisance effects. This is what I get
1.8973
1.8973
1.8973
…
3.4728
3.4728
3.4728
…
Are these the mean averages for each group (cortical thickness). If so, is there a way to get a score for each subject?
Best,
Omar
[cid:part1.BC9D3770.ABA20769@mgh.harvard.edu]
Look in the *.y.ocn.dat file.
From mri_glmfit-sim --help
csdbase.y.ocn.dat - this is a summary of the input (y) over each
cluster. It has a column for each cluster. Each row is a subject. The
value is the average of the input (y) in each cluster. This is a
simple text file.
On 9/3/2019 5:16 PM, Maximo, Jose Omar wrote:
External Email - Use Caution
Hi,
Which specific file should I load? I see cluster.mgh, cluster.summary, sign.ocn.annot, sig.ocn.mgh, sig.vertex.mgh, and pdf.dat.
How can I extract the values from fsaverage space?
Basically, what is the correct way to extract values from these significant clusters?
Many thanks,
Omar
Date: Tue, 3 Sep 2019 15:15:02 +0000
From: "Greve, Douglas N.,Ph.D." <DGREVE at mgh.harvard.edu<https://mail.nmr.mgh.harvard.edu/mailman/listinfo/freesurfer>>
Subject: Re: [Freesurfer] qdec contrast and data extraction
To: "freesurfer at nmr.mgh.harvard.edu<https://mail.nmr.mgh.harvard.edu/mailman/listinfo/freesurfer>" <freesurfer at nmr.mgh.harvard.edu<https://mail.nmr.mgh.harvard.edu/mailman/listinfo/freesurfer>>
Message-ID: <2286f9bf-37a4-1be9-2252-0bccc833a218 at mgh.harvard.edu<https://mail.nmr.mgh.harvard.edu/mailman/listinfo/freesurfer>>
Content-Type: text/plain; charset="utf-8"
You might have done something wrong along the way. When you run the montecarlo correction, it will create a file with the thickness values in it for each cluster. the first thing to do is to load that and see if you see the expected differences. The other thing is to not go back into native space to extract the numbers. There are several operations that happen as it moves into fsaverage space and in preparation for group analysis (interpolation, and smoothing); sometimes these make a big difference. if the ROI is small, it may not map accurately back into the native space (and you should not need to draw it in the first place)
On 8/30/2019 11:36 AM, Maximo, Jose Omar wrote:
External Email - Use Caution
Hi,
I have a question:
My design is 2 groups (HC and Patients in that respective order) and 2 nuisance factors (age and eTIV). When I look at the average volume difference between the 2 groups, I get blue and red clusters. I presume the color coding is where each group is greater than the other (Blue = Patients > HC and Red = HC > Patients).
Then, I processed to extract individual values from each cluster in order to plot them. When I extract data from the blue clusters and plot them, the two groups show no difference in thickness at all, whereas when I look at volume, HC show more than patients in blue clusters (see attached figure). I would assume that both figures would show patients > HC based on the negative statistic.
Am I interpreting the colors wrong? Or am I doing something wrong?
These are my steps 1) After applying montecarlo correction, I drew my ROIs to extract the data from; 2) map it onto every single subject; and then 3) used mris_anatomical_stats to extract the data from each subject.
Any suggestions are welcome.
Best,
Omar
Jose O. Maximo, Ph.D. | Postdoctoral Fellow
Department of Psychiatry & Behavioral Neurobiology
UAB School of Medicine
University of Alabama at Birmingham
Cell Phone: (619) 252-3492
Email: jomaximo at uabmc.edu<https://mail.nmr.mgh.harvard.edu/mailman/listinfo/freesurfer><mailto:jomaximo at uabmc.edu<https://mail.nmr.mgh.harvard.edu/mailman/listinfo/freesurfer>>
_______________________________________________ Freesurfer mailing list Freesurfer@nmr.mgh.harvard.edumailto:Freesurfer@nmr.mgh.harvard.edu https://mail.nmr.mgh.harvard.edu/mailman/listinfo/freesurfer
External Email - Use Caution
Hi,
I tried that and it seemed to work. My averages between the 2 groups look different now instead of almost identical. Thanks!
I have another similar question. I have a cluster that shows a significant difference between the groups when looking at volume. When I look at the y.ocn.dat file, the values are in the 0.74188 - 2.16321 range, which are pretty low for volume. I found a post where it says that you can multiply those values with the cluster size(mm^2) from the summary file to convert them to volume. Then, I tried using the formula you provided below (beta, res, yhat), but then I get some negative values. Negative volumetric values do not make sense, so I was thinking if using the absolute value would correct for that.
Any thoughts?
Thanks for all the help so far.
If you say y = ocn.dat, then beta = (X'*X)*X'*y; res = y - X*beta; yhat = X(:,1:2)*beta(1:2) + res; yhat will be a score for each subject with the nuisance variables removed.
On 9/11/19 2:40 PM, Maximo, Jose Omar wrote:
External Email - Use Caution
Hi,
I plotted the data from the *.y.ocn.dat file and the graph still shows no apparent significant difference between the groups (see attached pic). Then I >found a post with the following:
the ocn.dat files have data that is uncorrected in that sense and might need to nuisance factors removed before plotting.
There is a design matrix in there (Xg.dat). You can load that into matlab along with the ocn.dat, compute beta = inv(X'*X)*(X'*ocn)
to get the betas. You can then compute yhat = X2*beta2 where X2 has nuisance columns removed and beta2 has the same nuisance coefficients removed, then treat yhat as your data to be plotted.
I tried that since I have 2 nuisance factors (age and TICV) and want to plot my significant cluster w/o any nuisance effects. This is what I get
1.8973
1.8973
1.8973
…
3.4728
3.4728
3.4728
…
Are these the mean averages for each group (cortical thickness). If so, is there a way to get a score for each subject?
Best,
Omar
>
Look in the *.y.ocn.dat file.
From mri_glmfit-sim --help
csdbase.y.ocn.dat - this is a summary of the input (y) over each
cluster. It has a column for each cluster. Each row is a subject. The
value is the average of the input (y) in each cluster. This is a
simple text file.
On 9/3/2019 5:16 PM, Maximo, Jose Omar wrote:
External Email - Use Caution
Hi,
Which specific file should I load? I see cluster.mgh, cluster.summary, sign.ocn.annot, sig.ocn.mgh, sig.vertex.mgh, and pdf.dat.
How can I extract the values from fsaverage space?
Basically, what is the correct way to extract values from these significant clusters?
Many thanks,
Omar
Date: Tue, 3 Sep 2019 15:15:02 +0000
From: "Greve, Douglas N.,Ph.D." <DGREVE at mgh.harvard.edu<https://mail.nmr.mgh.harvard.edu/mailman/listinfo/freesurfer>>
Subject: Re: [Freesurfer] qdec contrast and data extraction
To: "freesurfer at nmr.mgh.harvard.edu<https://mail.nmr.mgh.harvard.edu/mailman/listinfo/freesurfer>" <freesurfer at nmr.mgh.harvard.edu<https://mail.nmr.mgh.harvard.edu/mailman/listinfo/freesurfer>>
Message-ID: <2286f9bf-37a4-1be9-2252-0bccc833a218 at mgh.harvard.edu<https://mail.nmr.mgh.harvard.edu/mailman/listinfo/freesurfer>>
Content-Type: text/plain; charset="utf-8"
You might have done something wrong along the way. When you run the montecarlo correction, it will create a file with the thickness values in it for each cluster. the first thing to do is to load that and see if you see the expected differences. The other thing is to not go back into native space to extract the numbers. There are several operations that happen as it moves into fsaverage space and in preparation for group analysis (interpolation, and smoothing); sometimes these make a big difference. if the ROI is small, it may not map accurately back into the native space (and you should not need to draw it in the first place)
On 8/30/2019 11:36 AM, Maximo, Jose Omar wrote:
External Email - Use Caution
Hi,
I have a question:
My design is 2 groups (HC and Patients in that respective order) and 2 nuisance factors (age and eTIV). When I look at the average volume difference between the 2 groups, I get blue and red clusters. I presume the color coding is where each group is greater than the other (Blue = Patients > HC and Red = HC > Patients).
Then, I processed to extract individual values from each cluster in order to plot them. When I extract data from the blue clusters and plot them, the two groups show no difference in thickness at all, whereas when I look at volume, HC show more than patients in blue clusters (see attached figure). I would assume that both figures would show patients > HC based on the negative statistic.
Am I interpreting the colors wrong? Or am I doing something wrong?
These are my steps 1) After applying montecarlo correction, I drew my ROIs to extract the data from; 2) map it onto every single subject; and then 3) used mris_anatomical_stats to extract the data from each subject.
Any suggestions are welcome.
Best,
Omar
Jose O. Maximo, Ph.D. | Postdoctoral Fellow
Department of Psychiatry & Behavioral Neurobiology
UAB School of Medicine
University of Alabama at Birmingham
Cell Phone: (619) 252-3492
Email: jomaximo at uabmc.edu<https://mail.nmr.mgh.harvard.edu/mailman/listinfo/freesurfer><mailto:jomaximo at uabmc.edu<https://mail.nmr.mgh.harvard.edu/mailman/listinfo/freesurfer>>
If you are getting negative values, it probably means that your model (instantiated by the X matrix) is not proper in some ranges. The formula below extrapolates the effects of the covariates in order to subtract them off of a subject's value. If the model is not quite right, then the extrapolation will not be quite right, and you can get uninterpretable numbers. I don't have a solution for it.
On 9/18/19 11:56 AM, Maximo, Jose Omar wrote:
External Email - Use Caution
Hi,
I tried that and it seemed to work. My averages between the 2 groups look different now instead of almost identical. Thanks!
I have another similar question. I have a cluster that shows a significant difference between the groups when looking at volume. When I look at the y.ocn.dat file, the values are in the 0.74188 - 2.16321 range, which are pretty low for volume. I found a post where it says that you can multiply those values with the cluster size(mm^2) from the summary file to convert them to volume. Then, I tried using the formula you provided below (beta, res, yhat), but then I get some negative values. Negative volumetric values do not make sense, so I was thinking if using the absolute value would correct for that.
Any thoughts?
Thanks for all the help so far.
If you say y = ocn.dat, then
beta = (X'*X)*X'*y;
res = y - X*beta;
yhat = X(:,1:2)*beta(1:2) + res;
yhat will be a score for each subject with the nuisance variables removed.
On 9/11/19 2:40 PM, Maximo, Jose Omar wrote:
External Email - Use Caution
Hi,
I plotted the data from the *.y.ocn.dat file and the graph still shows
no apparent significant difference between the groups (see attached pic). Then I >found a post with the following:
/the ocn.dat files have data that is uncorrected in that sense and might need to nuisance factors removed before plotting./ /There is a design matrix in there (Xg.dat). You can load that into matlab along with the ocn.dat, compute beta = inv(X'*X)*(X'*ocn)/ /to get the betas. You can then compute yhat = X2*beta2 where X2 has nuisance columns removed and beta2 has the same nuisance coefficients removed, then treat yhat as your data to be plotted./
I tried that since I have 2 nuisance factors (age and TICV) and want
to plot my significant cluster w/o any nuisance effects. This is what I get
1.8973 1.8973 1.8973 … 3.4728 3.4728 3.4728 …
Are these the mean averages for each group (cortical thickness). If so, is
there a way to get a score for each subject?
Best, Omar
>Look in the *.y.ocn.dat file.
From mri_glmfit-sim --help
csdbase.y.ocn.dat - this is a summary of the input (y) over each cluster. It has a column for each cluster. Each row is a subject. The value is the average of the input (y) in each cluster. This is a simple text file.
On 9/3/2019 5:16 PM, Maximo, Jose Omar wrote: / External Email - Use Caution/ // /Hi,/ // /Which specific file should I load? I see cluster.mgh,
cluster.summary, sign.ocn.annot, sig.ocn.mgh, sig.vertex.mgh, and pdf.dat./
// /How can I extract the values from fsaverage space?/ // /Basically, what is the correct way to extract values from these
significant clusters?/
// /Many thanks,/ /Omar/ // / Date: Tue, 3 Sep 2019 15:15:02 +0000/ / From: "Greve, Douglas N.,Ph.D." <DGREVE at mgh.harvard.edu
https://mail.nmr.mgh.harvard.edu/mailman/listinfo/freesurfer>/
/ Subject: Re: [Freesurfer] qdec contrast and data extraction/ / To: "freesurfer at nmr.mgh.harvard.edu
https://mail.nmr.mgh.harvard.edu/mailman/listinfo/freesurfer" <freesurfer at nmr.mgh.harvard.edu https://mail.nmr.mgh.harvard.edu/mailman/listinfo/freesurfer>/
/ Message-ID: <2286f9bf-37a4-1be9-2252-0bccc833a218 at
mgh.harvard.edu https://mail.nmr.mgh.harvard.edu/mailman/listinfo/freesurfer>/
/ Content-Type: text/plain; charset="utf-8"/ // / You might have done something wrong along the way. When you run
the montecarlo correction, it will create a file with the thickness values in it for each cluster. the first thing to do is to load that and see if you see the expected differences. The other thing is to not go back into native space to extract the numbers. There are several operations that happen as it moves into fsaverage space and in preparation for group analysis (interpolation, and smoothing); sometimes these make a big difference. if the ROI is small, it may not map accurately back into the native space (and you should not need to draw it in the first place)/
// / On 8/30/2019 11:36 AM, Maximo, Jose Omar wrote:/ // / External Email - Use Caution/ / Hi,/ // / I have a question:/ // / My design is 2 groups (HC and Patients in that respective
order) and 2 nuisance factors (age and eTIV). When I look at the average volume difference between the 2 groups, I get blue and red clusters. I presume the color coding is where each group is greater than the other (Blue = Patients > HC and Red = HC > Patients)./
// / Then, I processed to extract individual values from each
cluster in order to plot them. When I extract data from the blue clusters and plot them, the two groups show no difference in thickness at all, whereas when I look at volume, HC show more than patients in blue clusters (see attached figure). I would assume that both figures would show patients > HC based on the negative statistic./
// / Am I interpreting the colors wrong? Or am I doing something wrong?/ // / These are my steps 1) After applying montecarlo correction, I
drew my ROIs to extract the data from; 2) map it onto every single subject; and then 3) used mris_anatomical_stats to extract the data from each subject./
// / Any suggestions are welcome./ // / Best,/ / Omar/ // / Jose O. Maximo, Ph.D. | Postdoctoral Fellow/ / Department of Psychiatry & Behavioral Neurobiology/ / UAB School of Medicine/ / University of Alabama at Birmingham/ / Cell Phone: (619) 252-3492/ / Email: jomaximo at uabmc.edu
https://mail.nmr.mgh.harvard.edu/mailman/listinfo/freesurfer<mailto:jomaximo at uabmc.edu https://mail.nmr.mgh.harvard.edu/mailman/listinfo/freesurfer>/
Freesurfer mailing list Freesurfer@nmr.mgh.harvard.edu https://mail.nmr.mgh.harvard.edu/mailman/listinfo/freesurfer
freesurfer@nmr.mgh.harvard.edu
-
 Greve, Douglas N.,Ph.D.
 -
 Maximo, Jose Omar