
External Email - Use Caution
Hello Jon,
Looks like you are already running with -debug and -allowcoredump option, and the shell limits do not look like they are too small to allow the coredump to be written. I don't know offhand if that coredump option causes a file to be written somewhere, but I will try and find out if there is a location for it.
When the program exits you could try looking at the end of the system log to see if their is any info logged there, e.g.,
$ tail -50 /var/log/syslog
- and look for events that match the timestamp of when the program ran/stopped running.
If you can reproduce running a trac* command from the terminal that causes the crash, then you could try running that same command with gdb, e.g.,
$ gdb /usr/local/freesurfer/bin/trac-all -debug -allowcoredump -path -c /data/Abeona/648TT/run_648TT_path.txt
.... gdb will output some text then at the gdb prompt type run...
(gdb) run
.... then wait for the program to stop and try to get the backtrace with the back trace command ....
(gdb) bt full
.... which may yield some more info about the crash .....
On Oct 29, 2018, at 16:59, Whitney, Jon <jon.whitney@ert.com> wrote: External Email - Use Caution I got someone to help me, and based on what they told me the trac-all.log is where the debug information gets stored (I tried using -x +x in my bash command script and it only gave me upper level debugging information), so I have attached the trac-all.log file. I also was able to get help from someone who was able to save the core dump for when the system crashed, but it is extremely large (1.7GB). I can upload the core dump file if that would be helpful. I watched the system resources while the program ran, and I noticed that the memory usage only got up to 4% while the CPU usage was 100%, so I don't think I'm running out of memory. We looked at the core dump file, and my linux expert friend suggested that it may be a memory overflow error because it references memory at 0x0000000etc.<image.png>unfortunately, without the source code to help us interpret the core dump, I don't think I can provide much more in the way of specific information. Please let me know if there's somewhere I can upload the core dump if you want to look at it.Thanks!

External Email - Use Caution
Hey! Thanks for your help. Looking at the end of the system log: [image: image.png] It's a bunch of mysterious hex.
using gdb on trac-all doesn't work because gdb claims it will only work on executable files, not scripts.
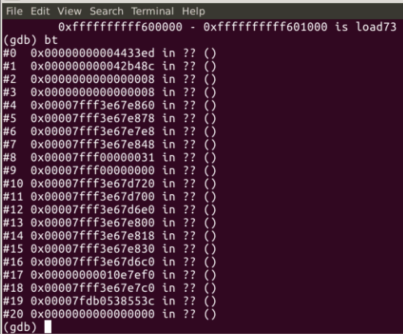
However, my Linux guru was able to get the backtrace for the crash.
[image: image.png]
which is also in inscrutable hex. He says that the only way to really identify the error is by combining data (such as the core dump) with the original code to decode this hex data.
Thoughts?
On Mon, Oct 29, 2018 at 5:41 PM fsbuild fsbuild@contbay.com wrote:
External Email - Use CautionHello Jon,
Looks like you are already running with -debug and -allowcoredump option, and the shell limits do not look like they are too small to allow the coredump to be written. I don't know offhand if that coredump option causes a file to be written somewhere, but I will try and find out if there is a location for it.
When the program exits you could try looking at the end of the system log to see if their is any info logged there, e.g.,
$ tail -50 /var/log/syslog
- and look for events that match the timestamp of when the program
ran/stopped running.
If you can reproduce running a trac* command from the terminal that causes the crash, then you could try running that same command with gdb, e.g.,
$ gdb /usr/local/freesurfer/bin/trac-all -debug -allowcoredump -path -c /data/Abeona/648TT/run_648TT_path.txt
... gdb will output some text then at the gdb prompt type run....
(gdb) run
... then wait for the program to stop and try to get the backtrace with the back trace command ....
(gdb) bt full
... which may yield some more info about the crash ....
On Oct 29, 2018, at 16:59, Whitney, Jon jon.whitney@ert.com wrote:
External Email - Use CautionI got someone to help me, and based on what they told me the trac-all.log is where the debug information gets stored (I tried using -x +x in my bash command script and it only gave me upper level debugging information), so I have attached the trac-all.log file. I also was able to get help from someone who was able to save the core dump for when the system crashed, but it is extremely large (1.7GB). I can upload the core dump file if that would be helpful. I watched the system resources while the program ran, and I noticed that the memory usage only got up to 4% while the CPU usage was 100%, so I don't think I'm running out of memory. We looked at the core dump file, and my linux expert friend suggested that it may be a memory overflow error because it references memory at 0x0000000etc.
<image.png> unfortunately, without the source code to help us interpret the core dump, I don't think I can provide much more in the way of specific information. Please let me know if there's somewhere I can upload the core dump if you want to look at it.
Thanks!
Freesurfer mailing list Freesurfer@nmr.mgh.harvard.edu https://mail.nmr.mgh.harvard.edu/mailman/listinfo/freesurfer
External Email - Use Caution
Also, I have located the core dump file if that helps.
Thanks!
On Tue, Oct 30, 2018 at 11:01 AM Whitney, Jon jon.whitney@ert.com wrote:
Hey! Thanks for your help. Looking at the end of the system log: [image: image.png] It's a bunch of mysterious hex.
using gdb on trac-all doesn't work because gdb claims it will only work on executable files, not scripts.
However, my Linux guru was able to get the backtrace for the crash.
[image: image.png]
which is also in inscrutable hex. He says that the only way to really identify the error is by combining data (such as the core dump) with the original code to decode this hex data.
Thoughts?
On Mon, Oct 29, 2018 at 5:41 PM fsbuild fsbuild@contbay.com wrote:
External Email - Use CautionHello Jon,
Looks like you are already running with -debug and -allowcoredump option, and the shell limits do not look like they are too small to allow the coredump to be written. I don't know offhand if that coredump option causes a file to be written somewhere, but I will try and find out if there is a location for it.
When the program exits you could try looking at the end of the system log to see if their is any info logged there, e.g.,
$ tail -50 /var/log/syslog
- and look for events that match the timestamp of when the program
ran/stopped running.
If you can reproduce running a trac* command from the terminal that causes the crash, then you could try running that same command with gdb, e.g.,
$ gdb /usr/local/freesurfer/bin/trac-all -debug -allowcoredump -path -c /data/Abeona/648TT/run_648TT_path.txt
... gdb will output some text then at the gdb prompt type run....
(gdb) run
... then wait for the program to stop and try to get the backtrace with the back trace command ....
(gdb) bt full
... which may yield some more info about the crash ....
On Oct 29, 2018, at 16:59, Whitney, Jon jon.whitney@ert.com wrote:
External Email - Use CautionI got someone to help me, and based on what they told me the trac-all.log is where the debug information gets stored (I tried using -x +x in my bash command script and it only gave me upper level debugging information), so I have attached the trac-all.log file. I also was able to get help from someone who was able to save the core dump for when the system crashed, but it is extremely large (1.7GB). I can upload the core dump file if that would be helpful. I watched the system resources while the program ran, and I noticed that the memory usage only got up to 4% while the CPU usage was 100%, so I don't think I'm running out of memory. We looked at the core dump file, and my linux expert friend suggested that it may be a memory overflow error because it references memory at 0x0000000etc.
<image.png> unfortunately, without the source code to help us interpret the core dump, I don't think I can provide much more in the way of specific information. Please let me know if there's somewhere I can upload the core dump if you want to look at it.
Thanks!
Freesurfer mailing list Freesurfer@nmr.mgh.harvard.edu https://mail.nmr.mgh.harvard.edu/mailman/listinfo/freesurfer
--
*Jon Whitney* Image Analysis Engineer ERT | 26801 Miles Rd | Cleveland, OH 44128 | USA ert.com
https://www.ert.com/ http://signature.ert.com/uc/5ae1cd7003abc93ec2b1d227
freesurfer@nmr.mgh.harvard.edu
-
 fsbuild
 -
 Whitney, Jon