
Dear Freesurfers,
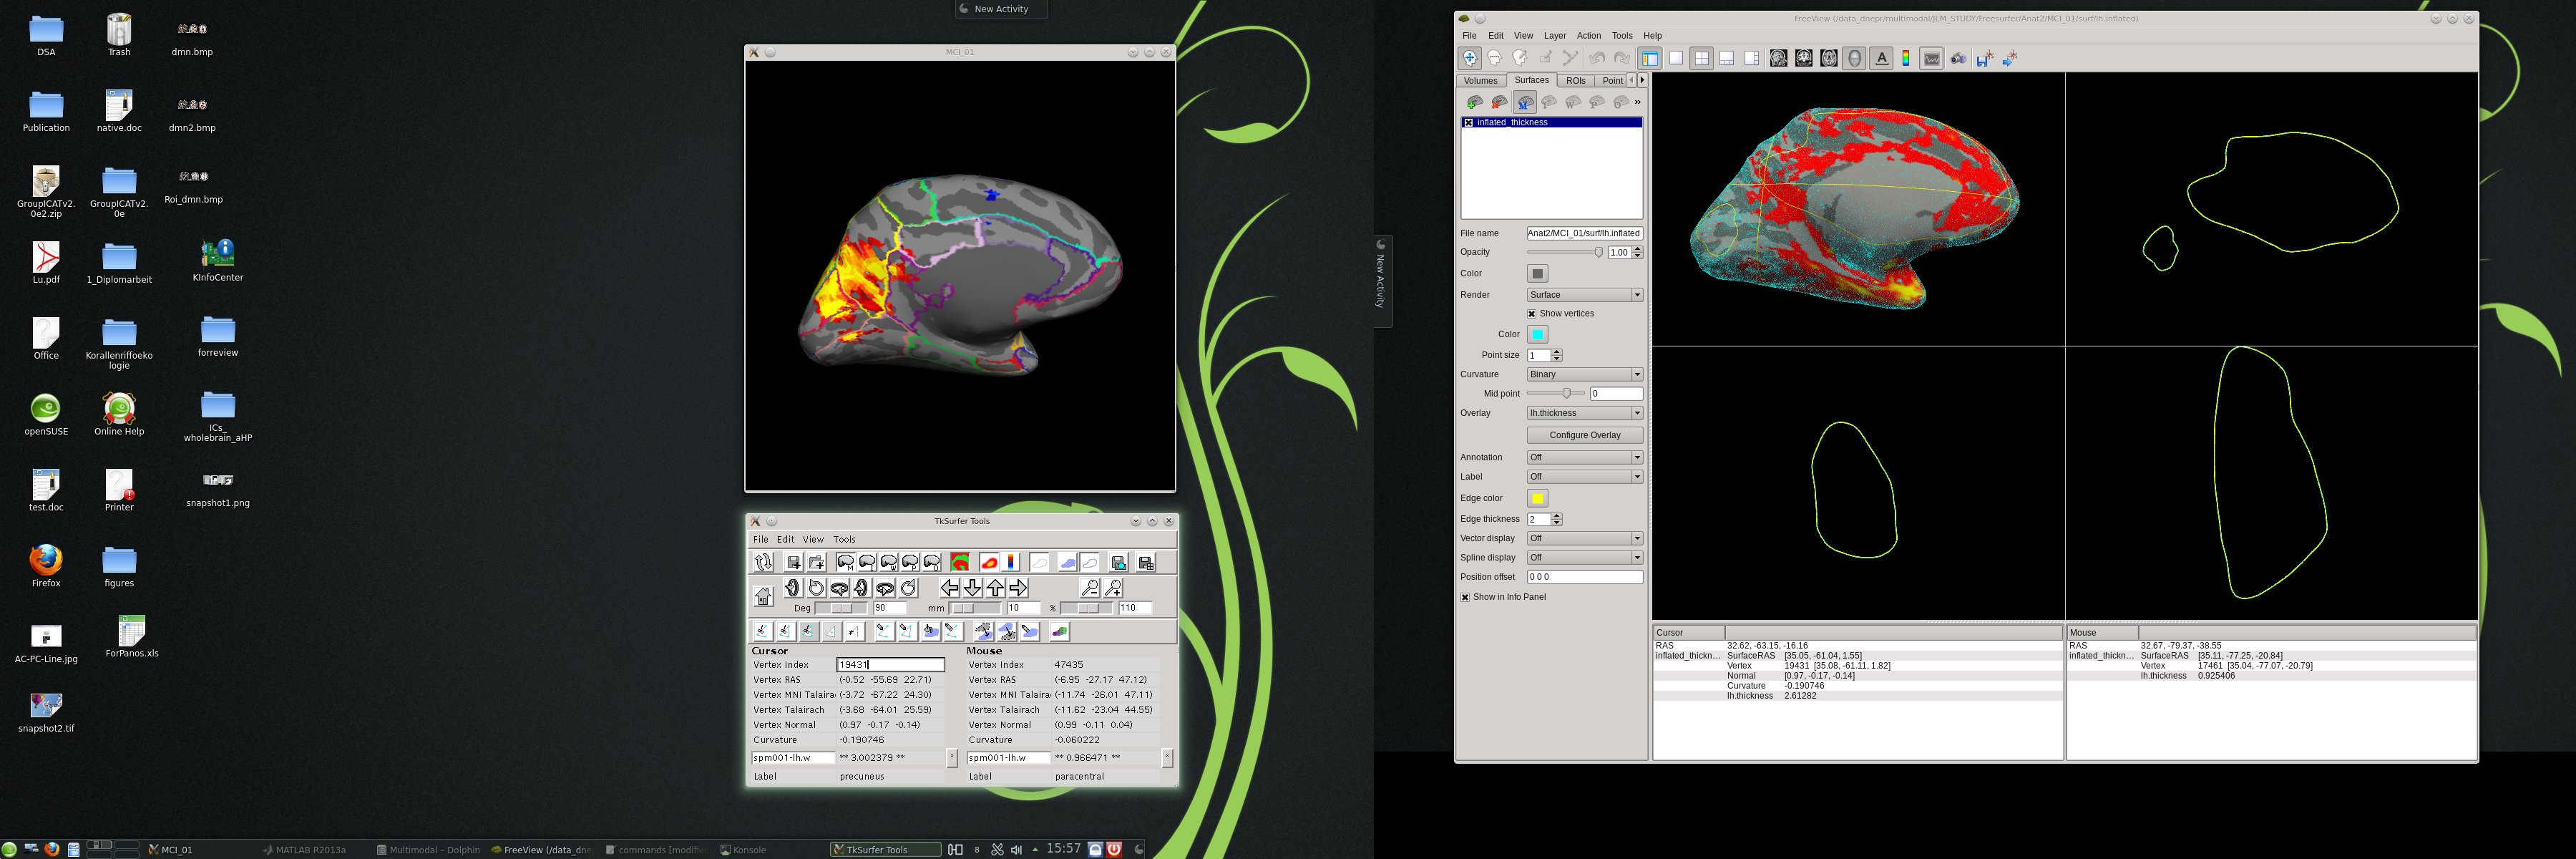
I am currently investigating the relationship between functional activation and cortical thickness at a within-subject vertex-based level. For this purpose I have mapped my activation on the vertex surface in the same subject. As you can see from the attached screenshot, I am able to visualize for the same vertex (e.g. coordinates vertex normal [0.97 -0.17 -0.14], curvature -0.190746) the value of the individual activation map (3.002379 on TkSurfer) and the individual cortical thickness value (2.61282 on FreeView).
What I need, is for every vertex in my surface the activation value and the correspondent cortical thickness value to be able to compute a vertex-based individual correlation of both modalities. How ca I extract this information from my data? The activation map is saved in .w (paint format)... is it possible to extract such a matrix by saving my data in an other format? I have been trying read_annotation and other matlab commands as read_surf but could not access a matrix of vertex specific thickness/activation values. Is there a more elegant way to compute an individual correlation/general linear model in freesurfer (please note that the analysis in WITHIN a subject)? Or should I use softwares as SurfStat (http://www.math.mcgill.ca/keith/surfstat/)?
Any help would be very appreciated, thanks,
Lorenzo

Why do you have your activation in a .w file? If you can save it as .mgh, then things get a lot easier. You can convert it to mgh using mri_surf2surf. You'll need to convert the thickness to mgh with mri_convert lh.thickness lh.thickness.mgh. Then load the two mgh files into matlab, eg,
thick = MRIread('lh.thickness.mgh'); fmri = MRIread('yourfmri.mgh');
thick and fmri will be structures where the .vol element is the data you want
On 09/08/2014 10:00 AM, lorenzo pasquini wrote:
Dear Freesurfers,
I am currently investigating the relationship between functional activation and cortical thickness at a within-subject vertex-based level. For this purpose I have mapped my activation on the vertex surface in the same subject. As you can see from the attached screenshot, I am able to visualize for the same vertex (e.g. coordinates vertex normal [0.97 -0.17 -0.14], curvature -0.190746) the value of the individual activation map (3.002379 on TkSurfer) and the individual cortical thickness value (2.61282 on FreeView).
What I need, is for every vertex in my surface the activation value and the correspondent cortical thickness value to be able to compute a vertex-based individual correlation of both modalities. How ca I extract this information from my data? The activation map is saved in .w (paint format)... is it possible to extract such a matrix by saving my data in an other format? I have been trying read_annotation and other matlab commands as read_surf but could not access a matrix of vertex specific thickness/activation values. Is there a more elegant way to compute an individual correlation/general linear model in freesurfer (please note that the analysis in WITHIN a subject)? Or should I use softwares as SurfStat (http://www.math.mcgill.ca/keith/surfstat/)?
Any help would be very appreciated, thanks,
Lorenzo
Freesurfer mailing list Freesurfer@nmr.mgh.harvard.edu https://mail.nmr.mgh.harvard.edu/mailman/listinfo/freesurfer
freesurfer@nmr.mgh.harvard.edu
-
 Douglas N Greve
 -
 lorenzo pasquini