
Hello All,
Many thanks for all the help that you provide to freesurfer users.
I have a few questions -
1. Where do I find ch2better brain ? I want to pipe it through freesurfer all the way to register to the spherical atlas and plot functional data across subjects to it.
2. I have retinotopy data (expanding rings and wedges) for 6 subjects and I want to generate average functional eccentricity and polar angle data for these subjects in surface or sphere space. Can you tell me how do I average the functional data across subjects in the surface domain ? That will be gr8 help.
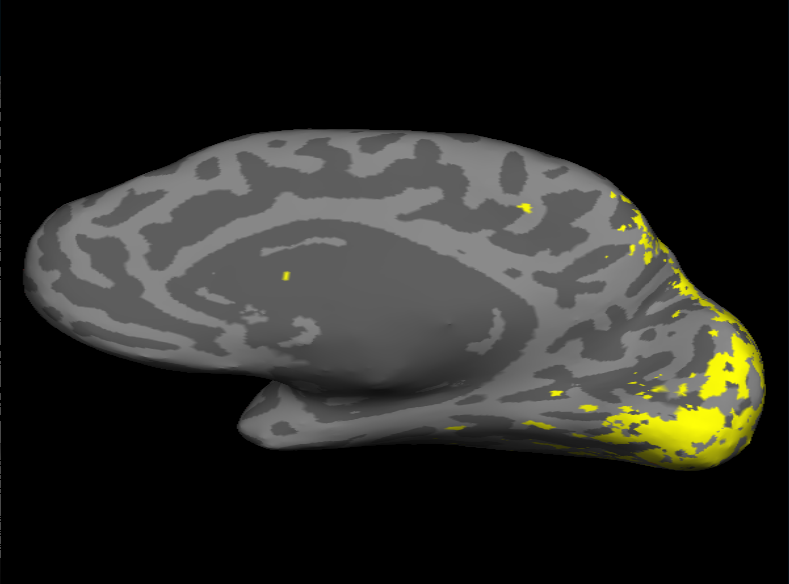
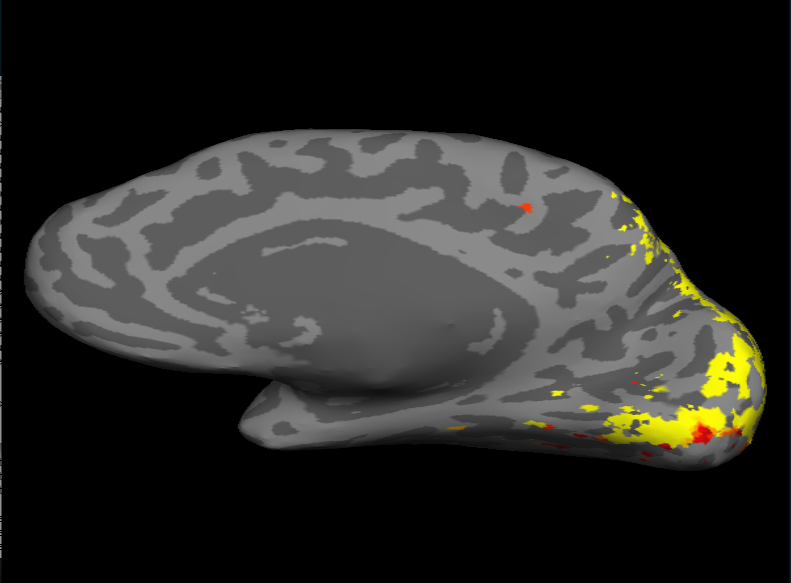
3. I was trying to plot the retinotopy data for 1 subject onto the inflated surface using tksurfer (following the instructions http://surfer.nmr.mgh.harvard.edu/fswiki/TkSurferGuide/TkSurferWorkingWithDa...) and am able to plot it but I am not able to fit a proper color scale and threshold to show color gradation reflecting the different phases. Can anyone please suggest what am I doing wrong ? I have attached a figure here. This is how it plots before any fiddling.
4. Also is there a way to calculate gray matter thickness of V1 in subjects after it has been registered to the spherical atlas. I have already generated V1 labels using Dr. Fischl and Dr. Hind's method.
Thanks a lot for your help
Ri

Ritobrato Datta wrote:
Hello All,
Many thanks for all the help that you provide to freesurfer users.
I have a few questions -
- Where do I find ch2better brain ? I want to pipe it through freesurfer all the way to register to the spherical atlas and plot functional data across subjects to it.
What is the ch2better brain?
- I have retinotopy data (expanding rings and wedges) for 6 subjects and I want to generate average functional eccentricity and polar angle data for these subjects in surface or sphere space. Can you tell me how do I average the functional data across subjects in the surface domain ? That will be gr8 help.
What are you trying to do, exactly? Eg, average the phase maps across subjects?
- I was trying to plot the retinotopy data for 1 subject onto the inflated surface using tksurfer (following the instructions http://surfer.nmr.mgh.harvard.edu/fswiki/TkSurferGuide/TkSurferWorkingWithDa...) and am able to plot it but I am not able to fit a proper color scale and threshold to show color gradation reflecting the different phases. Can anyone please suggest what am I doing wrong ? I have attached a figure here. This is how it plots before any fiddling.
I've created a new retinotopy-related script that you can get from here: ftp://surfer.nmr.mgh.harvard.edu/transfer/outgoing/flat/greve/sfa2fieldsign It makes running the retinotopy analysis a little easier. See the --help for how to run it and, more to the point, there are example tksurfer commands for visualization, including how to set the color scale.
- Also is there a way to calculate gray matter thickness of V1 in subjects after it has been registered to the spherical atlas. I have already generated V1 labels using Dr. Fischl and Dr. Hind's method.
It is easier to do in the individual space with mris_anatomical_stats. You'll have to use mri_segstats passing it the label and using the thickness map in fsaverage space as the input.
Thanks a lot for your help
Ri
Freesurfer mailing list Freesurfer@nmr.mgh.harvard.edu https://mail.nmr.mgh.harvard.edu/mailman/listinfo/freesurfer
freesurfer@nmr.mgh.harvard.edu
-
 Douglas N Greve
 -
 Ritobrato Datta