
External Email - Use Caution
Dear freesurfer team.
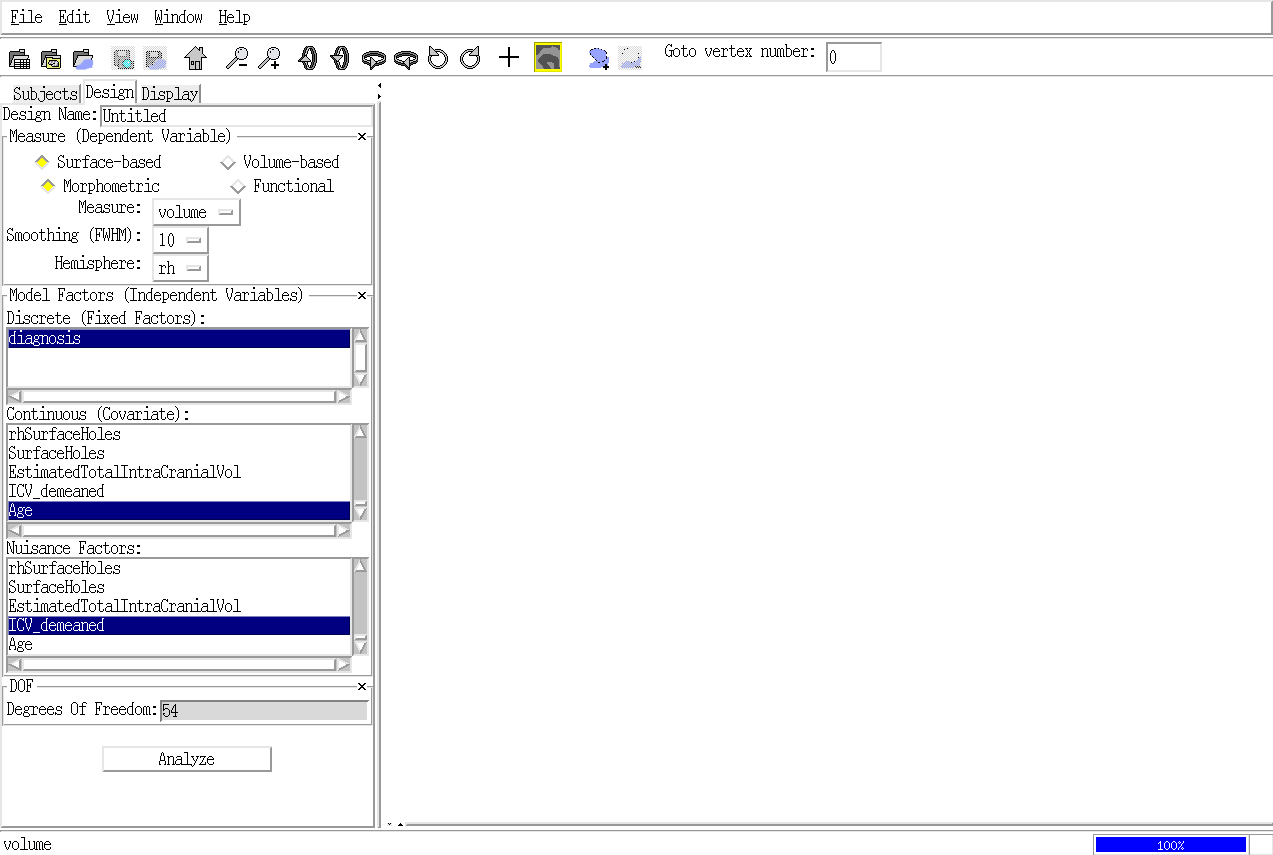
I am running an analysis betweene two groups Normal and Patients. Here is an example of my particular design diagnosis :- Normal vs Bipolar Co-variate :- Age Nuisance factor :- Total_Intra cranial volume
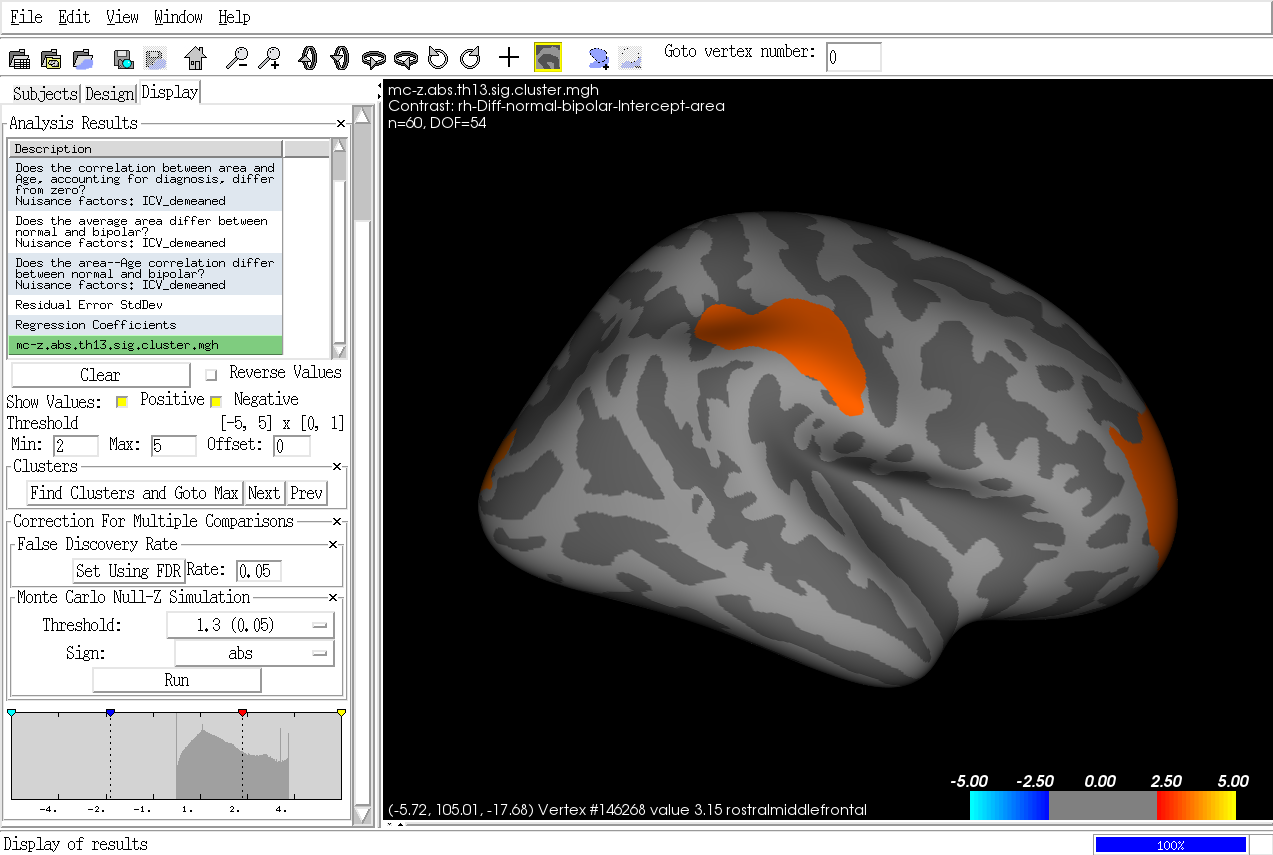
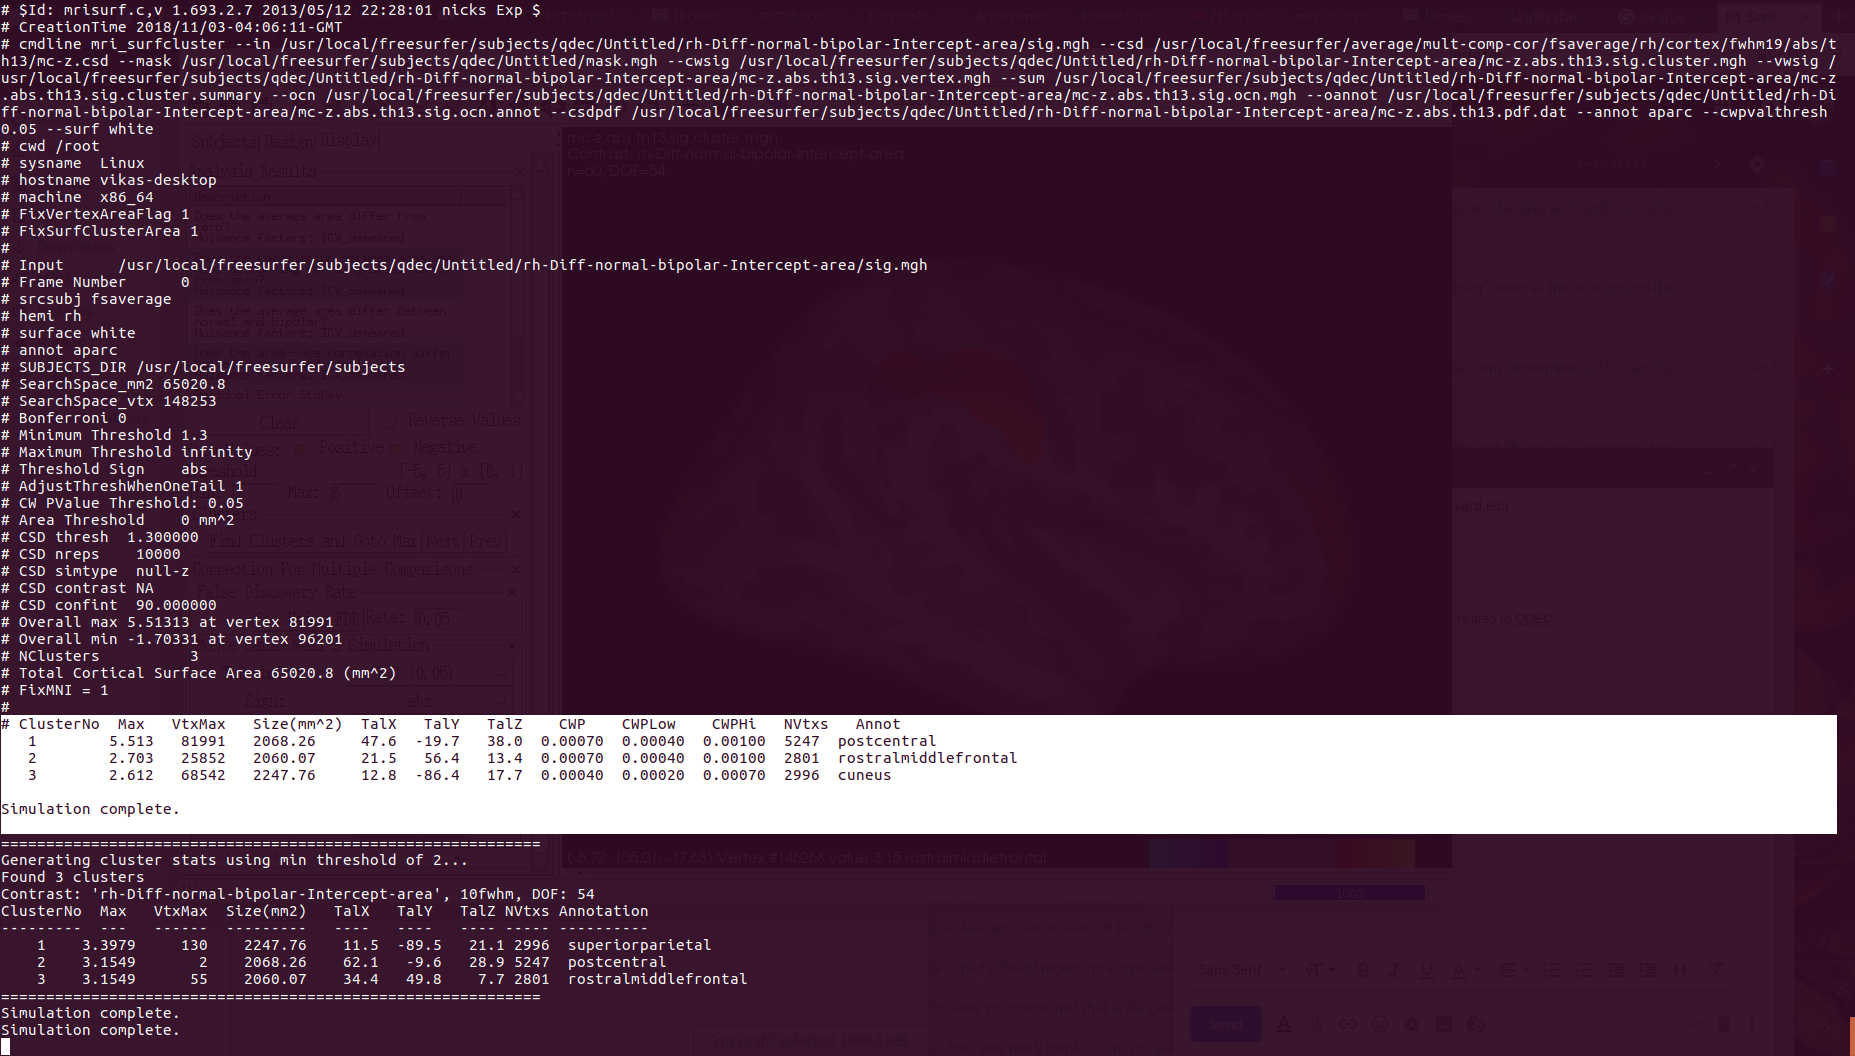
I would please like to know a couple of things related to QDEC 1.I am looking for difference in volume between patients and controls and the analysis. For correcting for multiple comparisons I ran Monte carlo - Z simulation at threshold of 1.3 My understanding is the analysis overall runs a two-tailed t-test first and then when we select to run MC-z simulation it iterates for multiple comparisions (by repeating the saem say 1000 times ) and gives out 'clusterwise p-value' Is my understanding correct?
2.I would like to extract T-values for the same . Are we getting cluster wise T-value similar to cluster wise p-value ? in the terminal
3. Where would I find t-values for the analysis ???
4.Are there any methods to extract T-values in qdec or freesurfer . If so,please specify.
I am enclosing screenshots from my analysis for the same . Kindly request you to please have a look please help me out with this ??
Thanking You,
Yours sincerely , Dr.Vikas Bandalli
-- Bangalore Medical College and Research Institute (BMCRI), Bangalore,India, Ph : +918904286825

On 11/03/2018 02:20 AM, Vikas Bandalli wrote:
External Email - Use Caution
Dear freesurfer team.
I am running an analysis betweene two groups Normal and Patients. Here is an example of my particular design diagnosis :- Normal vs Bipolar Co-variate :- Age Nuisance factor :- Total_Intra cranial volume
I would please like to know a couple of things related to QDEC 1.I am looking for difference in volume between patients and controls and the analysis. For correcting for multiple comparisons I ran Monte carlo - Z simulation at threshold of 1.3 My understanding is the analysis overall runs a two-tailed t-test first and then when we select to run MC-z simulation it iterates for multiple comparisions (by repeating the saem say 1000 times ) and gives out 'clusterwise p-value' Is my understanding correct?
It synthesizes a z-field, then smoothes it based on the smoothness of the residual of the real data, then thresholds, finds the max cluster size. It then repeats 1000 times. It then computes the p-value of your cluster based on the number of times it saw a cluster of the same size or bigger out of the 1000 trials. Note: for a threshold of 1.3, we recommend that you do permutation instead since the cluster p-value is very liberal using the MCZ simulation.
2.I would like to extract T-values for the same . Are we getting cluster wise T-value similar to cluster wise p-value ? in the terminal
The cluster pvalue is not based on a t-test. You can get t-value from the original voxel-wise analysis. Look in the output folder under each contrast. You will find F.mgh and gamma.mgh. t = sign(gamma)*sqrt(F) (assuming it is a t-contrast and not an F)
- Where would I find t-values for the analysis ???
See above
4.Are there any methods to extract T-values in qdec or freesurfer . If so,please specify.
I am enclosing screenshots from my analysis for the same . Kindly request you to please have a look please help me out with this ??
Thanking You,
Yours sincerely , Dr.Vikas Bandalli
-- Bangalore Medical College and Research Institute (BMCRI), Bangalore,India, Ph : +918904286825
freesurfer@nmr.mgh.harvard.edu
-
 Greve, Douglas N.,Ph.D.
 -
 Vikas Bandalli