
Dear All,
I have some questions in regard to the FreeSurfer group analyses (I am using the 3.0 Version), for which I would appreciate your help.
I am trying to compare a patient to a control group with respect to cortical thickness (regressing out variables such as age and IQ) and also to see if associations exist in specific ROIs between cortical thickness and cognitive variables (for the groups separately).
I started constructing a group descriptor file containing the two classes (patient and control) and the variable age. First, I wanted to compare the groups disregarding any other variable and so I constructed the following contrast vector: (1 -1 0), assuming doss and thinking that the ³0² meant that this column of the design matrix would not be taken into account in the model. However, this yielded the same result as running (1 -1 1). Do I have to construct a separate fsgd file only containing the classes and then a contrast vector (1 -1)?
What about regressing out more than 1 variable (e.g. age and IQ), how does the contrast vector have to look like then?
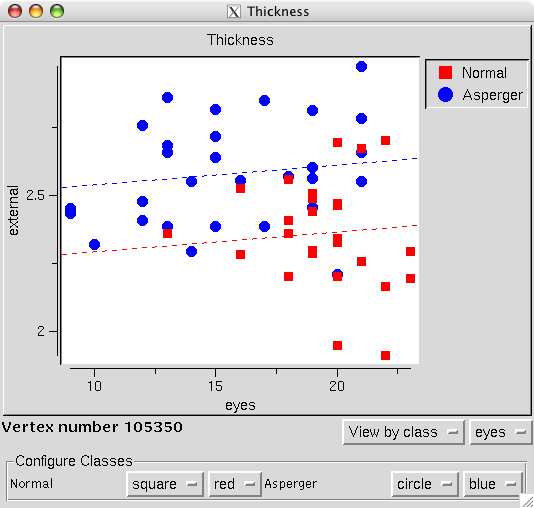
Also, how do I look at correlations between those variables and cortical thickness for the groups separately? When loading the scatter plots of the fsgd, the regression line for the separate groups seems to run always parallel, which does not seem very likely (see attached jpg). Are these regression lines at all? Where can I obtain the Rs in numbers?
Can I, alternatively, stream out the numbers for the cortical thickness of a defined ROI to then run correlations in SPSS. Where would I find those numbers?
I was also wondering about corrections for intracranial vault. Does the registration to the group¹s average brain takes care of differences in overall head size or is it advisable to put icv as a separate regressor (as is done in very few studies)?
Thanks a lot for your help and happy holidays,
Isabel
************************************** Isabel Dziobek, PhD Postdoctoral Research Fellow Independent Junior Research Group Neurocognition of Decision-Making Max-Planck Institute for Human Development Lentzeallee 94 14195 Berlin
Phone: +49 30 82406 619 Fax: +49 30 82406 616 dziobek@mpib-berlin.mpg.de

Dziobek, Isabel wrote:
Dear All,
I have some questions in regard to the FreeSurfer group analyses (I am using the 3.0 Version), for which I would appreciate your help.
I am trying to compare a patient to a control group with respect to cortical thickness (regressing out variables such as age and IQ) and also to see if associations exist in specific ROIs between cortical thickness and cognitive variables (for the groups separately).
I started constructing a group descriptor file containing the two classes (patient and control) and the variable age. First, I wanted to compare the groups disregarding any other variable and so I constructed the following contrast vector: (1 -1 0), assuming doss and thinking that the ³0² meant that this column of the design matrix would not be taken into account in the model. However, this yielded the same result as running (1 -1 1). Do I have to construct a separate fsgd file only containing the classes and then a contrast vector (1 -1)?
It looks like you did it correctly. Where they *exactly* the same? Down to 5 or 6 decimal places? It could be that there was no real age effect, so it would not matter what you put as the final element.
What about regressing out more than 1 variable (e.g. age and IQ), how does the contrast vector have to look like then?
You'd add another Variable to the FSGD. Then you'd just [1 -1 0 0].
Also, how do I look at correlations between those variables and cortical thickness for the groups separately?
Use DODS. You will have to change your contrast vector.
When loading the scatter plots of the fsgd, the regression line for the separate groups seems to run always parallel, which does not seem very likely (see attached jpg). Are these regression lines at all? Where can I obtain the Rs in numbers?
Yes they are regression. It is because you are using DOSS. The "SS" means "Same Slope", which is what you are seeing. You technically cannot get an R value for multiple regression, only single regression. However, you can get something like an R using a partial model fit, but I'd have to think about how to compute it from the regression coefficients.
Can I, alternatively, stream out the numbers for the cortical thickness of a defined ROI to then run correlations in SPSS. Where would I find those numbers?
Do you want all the vertices in the ROI or just an average over the ROI?
I was also wondering about corrections for intracranial vault. Does the registration to the group¹s average brain takes care of differences in overall head size or is it advisable to put icv as a separate regressor (as is done in very few studies)?
This is not taken into account, so you can include it as a covariate.
Thanks a lot for your help and happy holidays,
Isabel
Isabel Dziobek, PhD Postdoctoral Research Fellow Independent Junior Research Group Neurocognition of Decision-Making Max-Planck Institute for Human Development Lentzeallee 94 14195 Berlin
Phone: +49 30 82406 619 Fax: +49 30 82406 616 dziobek@mpib-berlin.mpg.de
Freesurfer mailing list Freesurfer@nmr.mgh.harvard.edu https://mail.nmr.mgh.harvard.edu/mailman/listinfo/freesurfer
freesurfer@nmr.mgh.harvard.edu
-
 Doug Greve
 -
 Dziobek, Isabel