
Hello Freesurfer Experts,
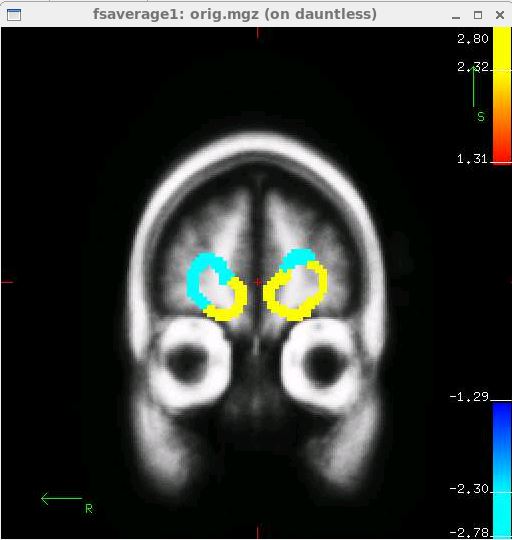
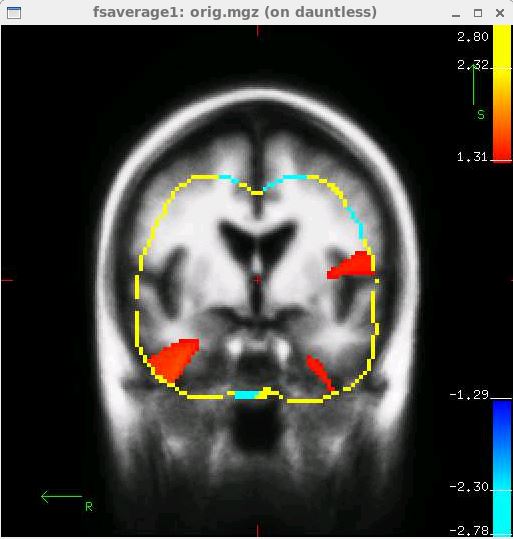
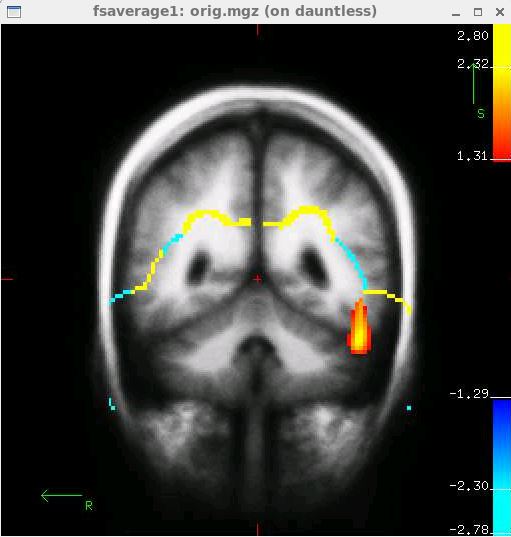
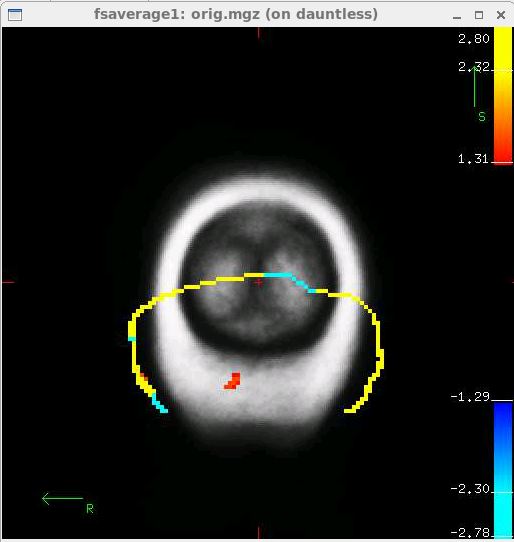
I’m attempting to look at activity in a working memory paradigm using blood folate levels as my covariate of interest while controlling for gender and age in 137 subjects. There were no errors (that I could find) in the concatenation or mri_glmfit commands, and subject registration looked ok for the functional data. When visualizing the right and left hemisphere surface sig.mgh files using tksurfer everything looks reasonable. However, when using tkmedit (tkmedit fsaverage1 orig.mgz –overlay sig.mgh –fminmax 1.3 3.3 –fmid 2.3) I am getting odd continuous bands of incredibly high and incredibly low activation spanning throughout most the volume (I’ve attached some screen grabs – the functional values in these bands are either 10000000000 or -10000000000 and look continuous from slice to slice).
I’ve taken a look at the list and was not able to find a similar problem discussed. I would be most grateful for any guidance or trouble shooting suggestions you might have!
I’ve also attached a text file copy of the glm and tkmedit results in case they would be of use.
I'm using Freesurfer version 5.3 (nmr-stable53-env) on a Linux (Release 6.7 (Santiago), Kernel Linux 2.6.32-573.12.1.el6.x86_64 and GNOME 2.28.2)
Thank you! Kevin
Kevin Dowling Clinical Research Coordinator Brain Genomics Laboratory Division of Psychiatric Neuroimaging Massachusetts General Hospital 149 13th Street Charlestown, MA, 02129 (p) (617) 643 - 2479

How did you create sig.mgh? If you used a surface-based mri_glmfit analysis, then you'll need to convert sig.mgh to the volume (mri_surf2vol)
On 12/05/2016 02:25 PM, Dowling, Kevin Francis wrote:
Hello Freesurfer Experts,
I’m attempting to look at activity in a working memory paradigm using blood folate levels as my covariate of interest while controlling for gender and age in 137 subjects. There were no errors (that I could find) in the concatenation or mri_glmfit commands, and subject registration looked ok for the functional data. When visualizing the right and left hemisphere surface sig.mgh files using tksurfer everything looks reasonable. However, when using tkmedit (tkmedit fsaverage1 orig.mgz –overlay sig.mgh –fminmax 1.3 3.3 –fmid 2.3) I am getting odd continuous bands of incredibly high and incredibly low activation spanning throughout most the volume (I’ve attached some screen grabs – the functional values in these bands are either 10000000000 or -10000000000 and look continuous from slice to slice).
I’ve taken a look at the list and was not able to find a similar problem discussed. I would be most grateful for any guidance or trouble shooting suggestions you might have!
I’ve also attached a text file copy of the glm and tkmedit results in case they would be of use.
I'm using Freesurfer version 5.3 (nmr-stable53-env) on a Linux (Release 6.7 (Santiago), Kernel Linux 2.6.32-573.12.1.el6.x86_64 and GNOME 2.28.2)
Thank you!
Kevin
Kevin Dowling
Clinical Research Coordinator
Brain Genomics Laboratory
Division of Psychiatric Neuroimaging
Massachusetts General Hospital
149 13th Street
Charlestown, MA, 02129
(p) (617) 643 - 2479
Freesurfer mailing list Freesurfer@nmr.mgh.harvard.edu https://mail.nmr.mgh.harvard.edu/mailman/listinfo/freesurfer
freesurfer@nmr.mgh.harvard.edu
-
 Douglas N Greve
 -
 Dowling, Kevin Francis