
Dear Freesurfer experts,
I’m doing a longitudinal study on cortical thickness and subcortical volumes and got some questions. I used the longitudinal stream for the preprocessing
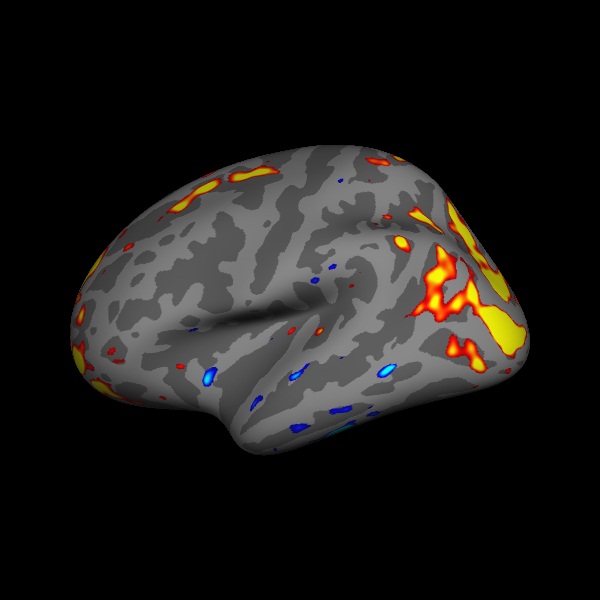
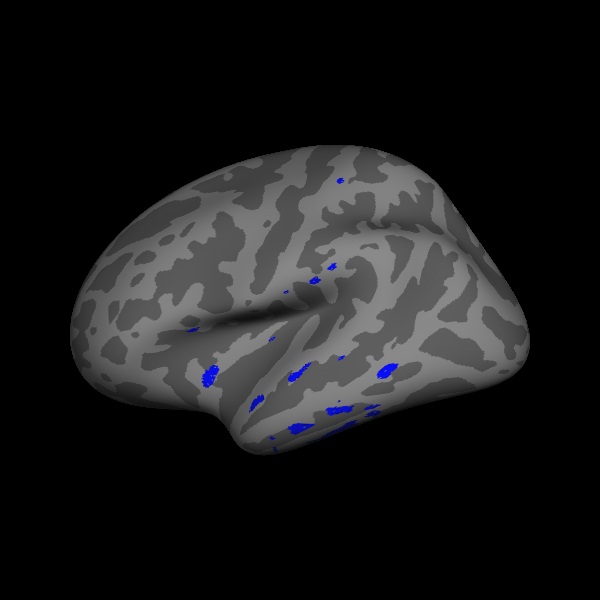
1. On cortical thickness, I’m doing a paired analysis as described in https://surfer.nmr.mgh.harvard.edu/fswiki/PairedAnalysis, and then a cluster-wise correction as described in https://surfer.nmr.mgh.harvard.edu/fswiki/FsTutorial/GroupAnalysis, with 5000 simulations instead of 5, and a vertex-wise threshold of 3 . But I don’t get the ocn.annot map, instead I get a ocn.mgh and ocn.lut. The CSD file also looks weird (constantly about 150 clusters with max size one or 2) and the resulting cluster.summary also gives a huge list of very small but significant clusters. Am I doing something wrong? How should I go about this? I’m using FS 4.5. Files are included (jpg for sig.mgh and cluster.mgh for negative simulation, and csd (zipped), summary and simulation log)
2. For the subcortical volumetric analysis I use the aseg.stats. Is the ICV a reliable measure to correct for overall brain size? I heard ICV measurements are not very reliable on T1’s (I get a mean of 2,4% decrease over 16 months...). Are other methods preferable to this one.
3. Is there a logic or rule of thumb for choosing the vertex-wise threshold?
Thanks for your help!
Pieter
*Sorry if I'm posting double, I had some trouble with my last post and don't know if it is published or not*
Dear Freesurfer experts,
I’m doing a longitudinal study on cortical thickness and subcortical volumes and got some questions. I used the longitudinal stream for the preprocessing
1. On cortical thickness, I’m doing a paired analysis as described in https://surfer.nmr.mgh.harvard.edu/fswiki/PairedAnalysis, and then a cluster-wise correction as described in https://surfer.nmr.mgh.harvard.edu/fswiki/FsTutorial/GroupAnalysis, with 5000 simulations instead of 5, and a vertex-wise threshold of 3 . But I don’t get the ocn.annot map, instead I get a ocn.mgh and ocn.lut. The CSD file also looks weird (constantly about 150 clusters with max size one or 2) and the resulting cluster.summary also gives a huge list of very small but significant clusters. Am I doing something wrong? How should I go about this? I’m using FS 4.5. Files are included (jpg for sig.mgh and cluster.mgh for negative simulation, and csd (zipped), summary and simulation log)
2. For the subcortical volumetric analysis I use the aseg.stats. Is the ICV a reliable measure to correct for overall brain size? I heard ICV measurements are not very reliable on T1’s (I get a mean of 2,4% decrease over 16 months...). Are other methods preferable to this one.
3. Is there a logic or rule of thumb for choosing the vertex-wise threshold?
Thanks for your help!
Pieter

Hi Pieter, something has gone wrong, but I'm not sure what. The smoothing level in the CSD is nan (not-a-number). Can you tar up the glmdir and drop it to me at the file drop address at the end of this email?
doug
Pieter van de Vijver wrote:
/Sorry if I'm posting double, I had some trouble with my last post and don't know if it is published or not/
Dear Freesurfer experts,
I’m doing a longitudinal study on cortical thickness and subcortical volumes and got some questions. I used the longitudinal stream for the preprocessing
On cortical thickness, I’m doing a paired analysis asdescribed in https://surfer.nmr.mgh.harvard.edu/fswiki/PairedAnalysis, and then a cluster-wise correction as described in https://surfer.nmr.mgh.harvard.edu/fswiki/FsTutorial/GroupAnalysis, with 5000 simulations instead of 5, and a vertex-wise threshold of 3 . But I don’t get the ocn.annot map, instead I get a ocn.mgh and ocn.lut. The CSD file also looks weird (constantly about 150 clusters with max size one or 2) and the resulting cluster.summary also gives a huge list of very small but significant clusters. Am I doing something wrong? How should I go about this? I’m using FS 4.5. Files are included (jpg for sig.mgh and cluster.mgh for negative simulation, and csd (zipped), summary and simulation log)
For the subcortical volumetric analysis I use the aseg.stats.Is the ICV a reliable measure to correct for overall brain size? I heard ICV measurements are not very reliable on T1’s (I get a mean of 2,4% decrease over 16 months...). Are other methods preferable to this one.
Is there a logic or rule of thumb for choosing thevertex-wise threshold?
Thanks for your help!
Pieter
Freesurfer mailing list Freesurfer@nmr.mgh.harvard.edu https://mail.nmr.mgh.harvard.edu/mailman/listinfo/freesurfer

Hi Pieter,
I think I may have run into this problem before by using mri_glmfit on a surface dataset and forgetting to to include --surf <subject> <hemi>. The model fitting runs fine, but you end up with confusing problems at the corrections stage because the residual smoothness estimation doesn't work properly. Do you happen to know whether you included --surf in your mri_glmfit call?
Cheers, Mike
On Sun, Feb 27, 2011 at 6:37 PM, Pieter van de Vijver pvijver@gmail.com wrote:
Dear Freesurfer experts,
I’m doing a longitudinal study on cortical thickness and subcortical volumes and got some questions. I used the longitudinal stream for the preprocessing
1. On cortical thickness, I’m doing a paired analysis as described in https://surfer.nmr.mgh.harvard.edu/fswiki/PairedAnalysis, and then a cluster-wise correction as described in https://surfer.nmr.mgh.harvard.edu/fswiki/FsTutorial/GroupAnalysis, with 5000 simulations instead of 5, and a vertex-wise threshold of 3 . But I don’t get the ocn.annot map, instead I get a ocn.mgh and ocn.lut. The CSD file also looks weird (constantly about 150 clusters with max size one or 2) and the resulting cluster.summary also gives a huge list of very small but significant clusters. Am I doing something wrong? How should I go about this? I’m using FS 4.5. Files are included (jpg for sig.mgh and cluster.mgh for negative simulation, and csd (zipped), summary and simulation log)
2. For the subcortical volumetric analysis I use the aseg.stats. Is the ICV a reliable measure to correct for overall brain size? I heard ICV measurements are not very reliable on T1’s (I get a mean of 2,4% decrease over 16 months...). Are other methods preferable to this one.
3. Is there a logic or rule of thumb for choosing the vertex-wise threshold?
Thanks for your help!
Pieter
Freesurfer mailing list Freesurfer@nmr.mgh.harvard.edu https://mail.nmr.mgh.harvard.edu/mailman/listinfo/freesurfer
The information in this e-mail is intended only for the person to whom it is addressed. If you believe this e-mail was sent to you in error and the e-mail contains patient information, please contact the Partners Compliance HelpLine at http://www.partners.org/complianceline . If the e-mail was sent to you in error but does not contain patient information, please contact the sender and properly dispose of the e-mail.
That worked, didn't work out that good for the significance of my data though... :-(
Thanks, Doug & Mike!
On Wed, Mar 2, 2011 at 1:19 PM, Michael Waskom mwaskom@mit.edu wrote:
Hi Pieter,
I think I may have run into this problem before by using mri_glmfit on a surface dataset and forgetting to to include --surf <subject> <hemi>. The model fitting runs fine, but you end up with confusing problems at the corrections stage because the residual smoothness estimation doesn't work properly. Do you happen to know whether you included --surf in your mri_glmfit call?
Cheers, Mike
On Sun, Feb 27, 2011 at 6:37 PM, Pieter van de Vijver pvijver@gmail.com wrote:
Dear Freesurfer experts,
I’m doing a longitudinal study on cortical thickness and subcortical volumes and got some questions. I used the longitudinal stream for the preprocessing
On cortical thickness, I’m doing a paired analysis as describedin
https://surfer.nmr.mgh.harvard.edu/fswiki/PairedAnalysis, and then a cluster-wise correction as described in https://surfer.nmr.mgh.harvard.edu/fswiki/FsTutorial/GroupAnalysis, with 5000 simulations instead of 5, and a vertex-wise threshold of 3 . But I don’t get the ocn.annot map, instead I get a ocn.mgh and ocn.lut. The CSD file also looks weird (constantly about 150 clusters with max
size
one or 2) and the resulting cluster.summary also gives a huge list of
very
small but significant clusters. Am I doing something wrong? How should I
go
about this? I’m using FS 4.5. Files are included (jpg for sig.mgh and cluster.mgh for negative simulation, and csd (zipped), summary and simulation log)
For the subcortical volumetric analysis I use the aseg.stats. Isthe ICV a reliable measure to correct for overall brain size? I heard ICV measurements are not very reliable on T1’s (I get a mean of 2,4% decrease over 16 months...). Are other methods preferable to this one.
Is there a logic or rule of thumb for choosing the vertex-wisethreshold?
Thanks for your help!
Pieter
Freesurfer mailing list Freesurfer@nmr.mgh.harvard.edu https://mail.nmr.mgh.harvard.edu/mailman/listinfo/freesurfer
The information in this e-mail is intended only for the person to whom it
is
addressed. If you believe this e-mail was sent to you in error and the e-mail contains patient information, please contact the Partners Compliance HelpLine at http://www.partners.org/complianceline . If the e-mail was sent to you
in
error but does not contain patient information, please contact the sender and properly dispose of the e-mail.
freesurfer@nmr.mgh.harvard.edu
-
 Douglas N Greve
 -
 Michael Waskom
 -
 Pieter van de Vijver