
External Email - Use Caution
Hi. We have a question about the raw cortical thickness (CT) data exported from FS with read_curv. As an example, I loaded in the "bert" sample dataset, read the left hand cortical thicknesses and then dumped to a text file (attached).
This comes straight from the FS Wiki (https://secure-web.cisco.com/1xTVjn_11mS7O8kpk-Z_1qWqdnYVJGSS8DDdmA7uqHC1a7r...) Q. How can I make a histogram of cortical thickness? A: In Matlab you can use the read_curv() function, as in the example below.
* thick = read_curv ('/usr/local/freesurfer/subjects/bert/surfer/lh.thickness'); hist (thick,100);
Notice that there are many zero values that refer to areas where there's no cortical surface. The best procedure is to create a new array without the zero values and then make the histogram.
The matlab code are just in these three lines. thick = read_curv(bert); fileID2 = fopen(outfile,'w'); fprintf(fileID2,'%s \n',thick);
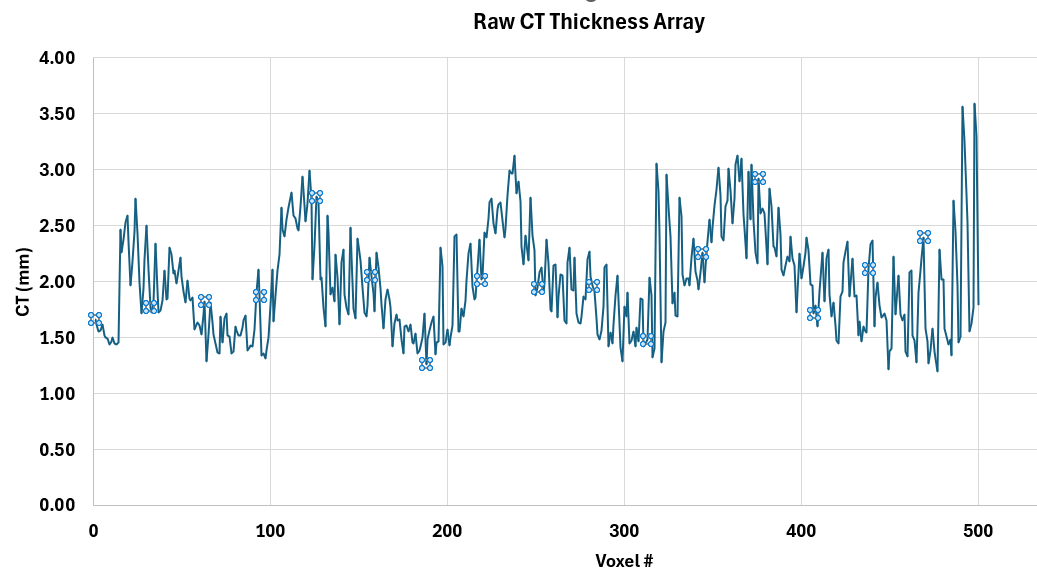
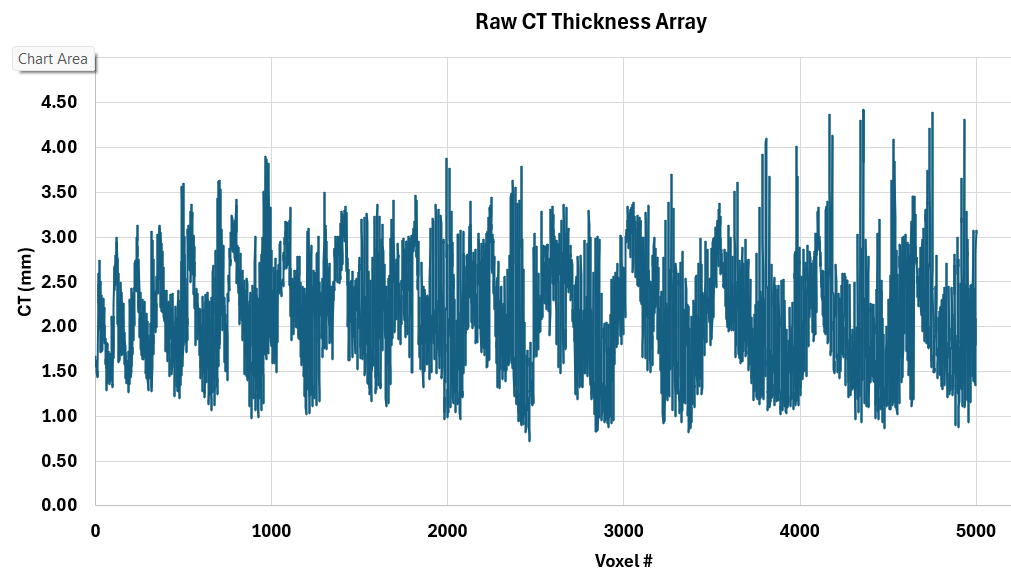
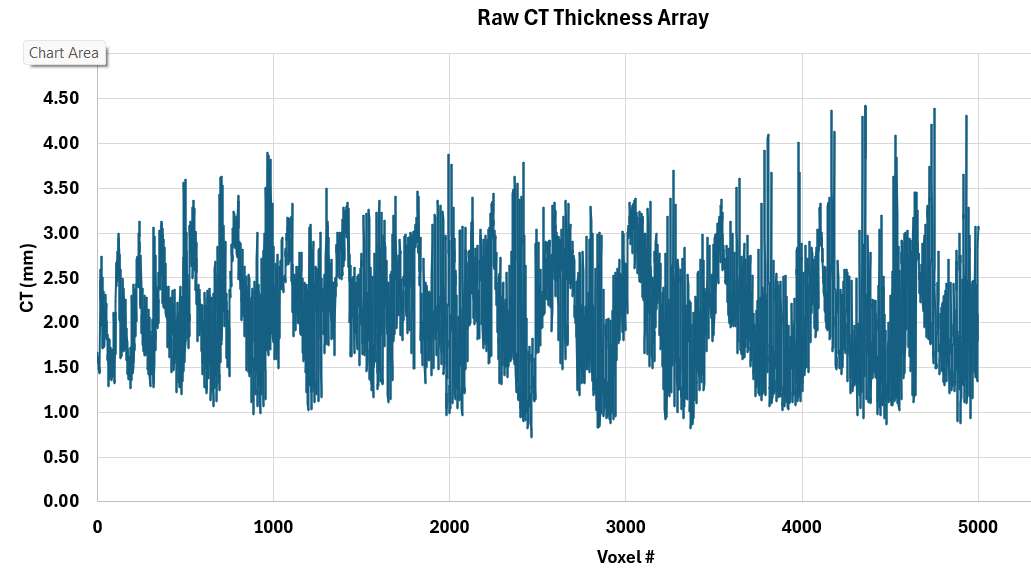
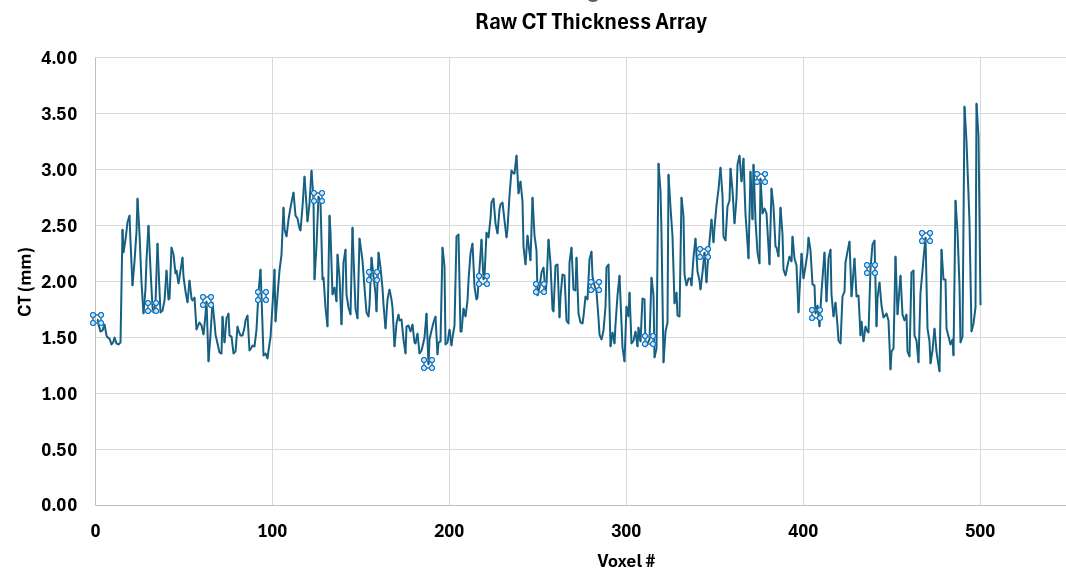
The first image below shows the first 500 thicknesses in the array while the second image shows the first 5,000. There is a distinct oscillation/periodicity in the data that is written out. We were wondering if this has to do with the way that FS rasters across the brain going from sulci to gyri, etc? If the data is placed in a histogram, in a normal control subject we do get and expect a Gaussian distribution.
Please let us know! Thanks, Jon
[cid:image001.png@01DC39D4.C0D9EE30] [cid:image002.png@01DC39D4.C0D9EE30]
Jonathan P. Dyke, Ph.D., DABMP (MRI) Professor of Physics Research in Radiology Weill Cornell Medicine Citigroup Biomedical Imaging Center 516 East 72nd Street, New York, NY 10021 T: (212) 746-5781 jpd2001@med.cornell.edumailto:jpd2001@med.cornell.edu https://secure-web.cisco.com/10j0E5YHOxocBnWfcrDQ216C6nsc2hKJWtNPtq-wJom6YsI...https://secure-web.cisco.com/1Lnkj1qw7ihDOCfmxSKCVFoSzRb4AchVJ4tZveXJcU8yLEdjQ0SiNexyVkMVoKXFw8t9hKloT7bF_OxrZB5p23iZ0g5Jo1Y5VOsXrnL2Ur9wSWzb6SyMX5iBCTOFiqMe_j4-RcbjFerJ9kwpdmofEsgzTROhBJGgFDR3QB6rDIlvmw9Zviph2JHGjAiVZ7cvM8poxgkMbJCDoJNSkEVKzaioN0Kd5mW9qNHKRc0S9ufNt0ZzRFEmrPALGfZJDYavXqP_sju3yZNlIoJpaw6NXElxWgcYhPnre-vPUDA5z0b-IB1BalQdvVIjamqxPKQCvCF872_ynRVjJchbP-iDSsQ/https%3A%2F%2Fcbic.weill.cornell.edu%2F https://secure-web.cisco.com/1Vk4ZlA8td_XcHqE_xIWYF3DPPZztt5RTvnCLZOXo3Xbv-u... https://secure-web.cisco.com/11foGvXt-9ehohguhfB8iiX-faywHX81Sf7kmgUKGn3FBAo...

The thickness is set to 0 in the portion of the medial wall where there is no cortex. You can just removed values that are exactly 0
On 10/10/2025 11:03 AM, Jonathan P Dyke wrote:
External Email - Use Caution
Hi. We have a question about the raw cortical thickness (CT) data exported from FS with read_curv. As an example, I loaded in the “bert” sample dataset, read the left hand cortical thicknesses and then dumped to a text file (attached).
This comes straight from the FS Wiki (https://surfer.nmr.mgh.harvard.edu/fswiki/UserContributions/FAQ https://secure-web.cisco.com/1xTVjn_11mS7O8kpk-Z_1qWqdnYVJGSS8DDdmA7uqHC1a7rhOtiJbptxFE15lIun8_mIquAeosBqpFD5pOnN09hmfLeskizMibZui86HBIODqoByTo-gqhhBdJ1Oy0BjqwTTFaMxH8b296QRcIRrQcBLy6-9hSjRdV8pB68BY4hytiDqpt5eONmXo-SrXd5SCFHh-3K13txWV_I3wYCN_ixZZ7bHZFiarfL8amfevgW4IE6AmzpI4fM4bbdugXH8yrJeO-drtNzl14JiizLVkJbu95HEQBFckAVhoFf9F7H_eee3clSIt4MOeGK6XdHxEIZPpMUzsdJXlNaLHIgXm1A/https%3A%2F%2Fsurfer.nmr.mgh.harvard.edu%2Ffswiki%2FUserContributions%2FFAQ)
*Q. How can I make a histogram of cortical thickness?*
A: In Matlab you can use the read_curv() function, as in the example below.
*thick = read_curv ('/usr/local/freesurfer/subjects/bert/surfer/lh.thickness'); hist (thick,100);*
Notice that there are many zero values that refer to areas where there's no cortical surface. The best procedure is to create a new array without the zero values and then make the histogram.
The matlab code are just in these three lines.
thick = read_curv(bert);
fileID2 = fopen(outfile,'w');
fprintf(fileID2,’%s \n’,thick);
The first image below shows the first 500 thicknesses in the array while the second image shows the first 5,000. There is a distinct oscillation/periodicity in the data that is written out. We were wondering if this has to do with the way that FS rasters across the brain going from sulci to gyri, etc? If the data is placed in a histogram, in a normal control subject we do get and expect a Gaussian distribution.
Please let us know!
Thanks,
Jon
*Jonathan P. Dyke, Ph.D., DABMP (MRI)*
Professor of Physics Research in Radiology
*Weill Cornell Medicine*
Citigroup Biomedical Imaging Center
516 East 72nd Street, New York, NY10021
*T: (212) 746-5781*
jpd2001@med.cornell.edu mailto:jpd2001@med.cornell.edu
https://cbic.weill.cornell.edu https://secure-web.cisco.com/1Lnkj1qw7ihDOCfmxSKCVFoSzRb4AchVJ4tZveXJcU8yLEdjQ0SiNexyVkMVoKXFw8t9hKloT7bF_OxrZB5p23iZ0g5Jo1Y5VOsXrnL2Ur9wSWzb6SyMX5iBCTOFiqMe_j4-RcbjFerJ9kwpdmofEsgzTROhBJGgFDR3QB6rDIlvmw9Zviph2JHGjAiVZ7cvM8poxgkMbJCDoJNSkEVKzaioN0Kd5mW9qNHKRc0S9ufNt0ZzRFEmrPALGfZJDYavXqP_sju3yZNlIoJpaw6NXElxWgcYhPnre-vPUDA5z0b-IB1BalQdvVIjamqxPKQCvCF872_ynRVjJchbP-iDSsQ/https%3A%2F%2Fcbic.weill.cornell.edu%2F
https://radiology.weill.cornell.edu/research/mri-research-institute/jonathan... https://secure-web.cisco.com/1Vk4ZlA8td_XcHqE_xIWYF3DPPZztt5RTvnCLZOXo3Xbv-uQuStYy-Bja6WMBJ0AdgsmLi8lhRqc3ctUniHnCRPODdi549axkUIfHzNzXyk7gJhHofi84v85rMskDAgnK_hgOB48XtSLqpBd40KPXjwXABg1QFoDtDOF_FK_PQq53o54qRBJbpIA_uuswq1VYZ-pBUlZFOVjHmAPgWPnzahdUli0QLi2aGfuMzRFW_D49_0d3y1cNIIAq54mfP5IiakB-rWyXGjmUI3QV7ZHTKz_Ewyyo7lFHcYAIQDP4QWiWX0AUuTVVT0THcGB9-XDiVhAZCA73ZS9qZffQAwePDg/https%3A%2F%2Fradiology.weill.cornell.edu%2Fresearch%2Fmri-research-institute%2Fjonathan-dyke-laboratory
https://vivo.weill.cornell.edu/display/cwid-jpd2001 https://secure-web.cisco.com/11foGvXt-9ehohguhfB8iiX-faywHX81Sf7kmgUKGn3FBAonpRqdavXlDCwBoYrIEQb47I2RJIudZIRlC9goZUoOYvShYnAOEwcnc7RHAUBEJVKcZBW7D-HqXOIRNqapkX0FQAU6JZSaSw4FdTuT-CmKrEgYD3KTPlPzNa9hjOw_OAqdhhNGPNrhdbLpqTVyHOeTyRy315v1kTdZxUmaKFOXHR1js2tozwEVCMpee0YbacEE-XY4rKx5FsVcs3WDjLtzrmAgDnCoLXfgp_ZfVGF4hRuMwsWejqzrTb_GPz1n4nMRd1lZ6aIm79ElPH7oGYoNbK3k1FHb0E87U8JyR_w/https%3A%2F%2Fvivo.weill.cornell.edu%2Fdisplay%2Fcwid-jpd2001
Freesurfer mailing list --freesurfer@nmr.mgh.harvard.edu To unsubscribe send an email tofreesurfer-leave@nmr.mgh.harvard.edu https://mail.nmr.mgh.harvard.edu/mailman3/lists/freesurfer@nmr.mgh.harvard.e...
freesurfer@nmr.mgh.harvard.edu
-
 Douglas N. Greve
 -
 Jonathan P Dyke