
Still looking for an answer to this question:
So in doing a more complicated version of the analysis with paradigm weighting, I had another experiment where I wanted to test out two different models, 1) that BOLD activity was related to my behavioral measure alone or 2) that BOLD activity was related to my behavioral activity plus a factor that represented the number of distractors present (which is constant across set size) (had a high and low distractor condition, so that this factor was effectively 0 for the low distractor condition and something like 1 for the high distractor condition). I modelled the second my simply adding the behavior measure and the distractor factor together (which means that in practicality, nothing changed for the low distractor conditions between model 1 and model 2, but that the weight was increased by a constant factor in the high distractor conditions between model 1 and model 2).
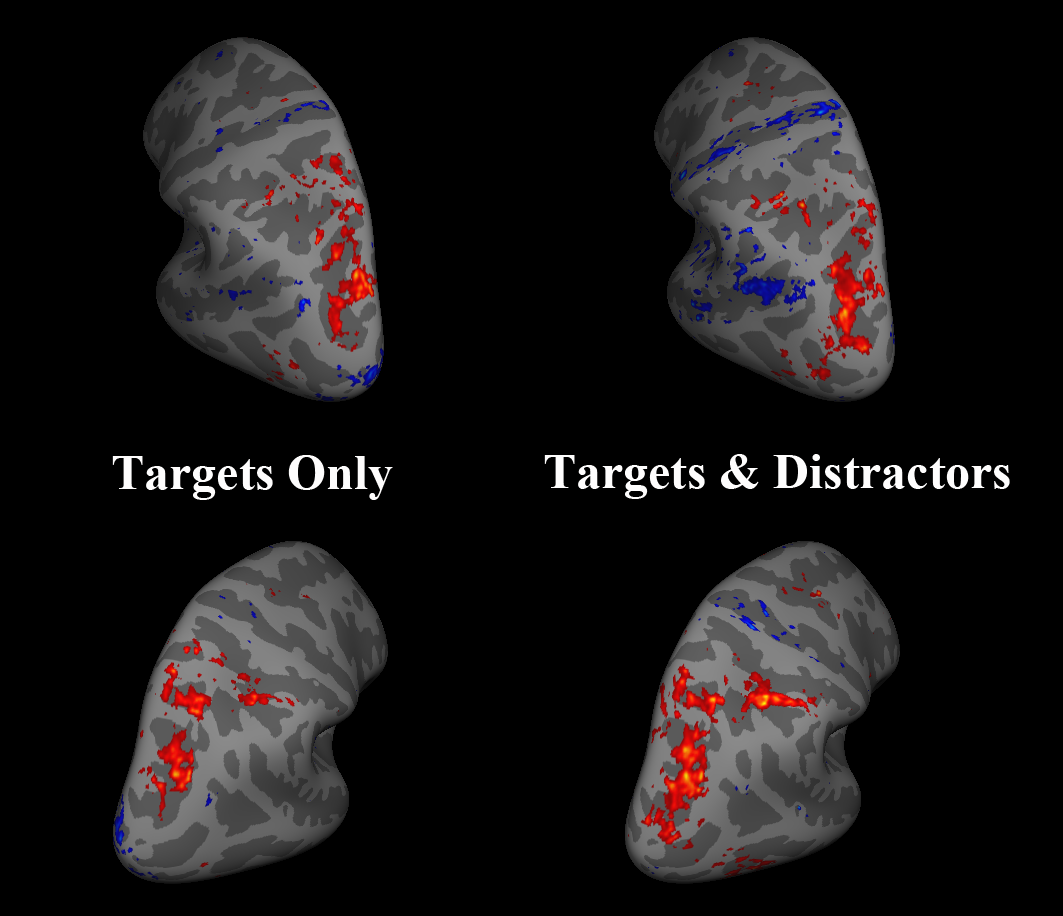
When I ran this analysis, what I got (shown in the attached picture in a group average) was an increase in the amount of activity and area of activity for model 2 (targets & distractors) compared with model 1 (targets only). Am I right in interpreting this as model 2 being a better fit? Or is can these maps be compared to show areas that are a better fit for model 1 and other areas that are a better fit for model 2?
I have ROI data on the unweighted analyses that goes along with the idea of model 2 being better, but I wanted to make sure I was intrepreting the activity in this weighted analysis correctly.
Thanks,
Katie
On Tue, Feb 22, 2011 at 1:35 PM, Douglas N Greve greve@nmr.mgh.harvard.eduwrote:
Yes, your understanding is correct. People might choose Version 1 because they strongly feel that it accurately represents the underlying mechanism. It saves one DoF, but that's not going to change much. I think the problem with Version 1 is that, for most designs, it forces you to extrapolate outside of your data range. Few things are truly linear, but they are often well modeled by straight lines over a limited range. For your data, you might really expect the response to be 0 at x=0, but it become a very non-linear curve in that region.
doug
Katie Bettencourt wrote:
Ok, so just so that I understand (I realize I'm being a bit dense, and I appreciate you walking me through this). If I am weighting my paradigm by my behavioral measure, then the activity I see with this weighted analysis, is areas where we are seeing a linear relationship between BOLD activity and my behavioral measure. In version 1:1vs0, this assumes that my linear fit passes through xy=0. However, in version 2:2vs0, we put an offset (or a sort of y intercept?) into the model so that the data doesn't have to pass through xy=0. And you are saying that the larger amount of activated area that I am getting in Version 1:1vs0, is because I'm seeing areas activated for the fact that there's an increase from baseline but not exactly the linear fit between BOLD and behavioral measures, but for Version 2:2vs0, I see only the areas that show this linear correlation? Does that sound about right?
And if I am right, why would anyone do Verison1? Is it just because if your fit does pass through xy=0, you get more power this way compared with Version 2?
Katie
On Tue, Feb 22, 2011 at 1:00 PM, Douglas N Greve < greve@nmr.mgh.harvard.edu mailto:greve@nmr.mgh.harvard.edu> wrote:
Katie Bettencourt wrote:
      You should also look at Version2:1v0. I bet a lot of the areas
      from Version1:1v0 will also show up. You can also create a
      Version3 in which you divide your presentations into a
   low-weight
      and a high-weight (but set the weight=1). Then create
   contrasts of
      low+high and high-low. The low+high should look like
   Version2:1v0
      and the high-low should look like Version2:2v0.


   So, what would this say?  That the extra activity I'm getting
   in Version 1 is just the slope/offset, and isn't actually load
   related data that I am trying to get at (ie. isn't activity
   that is increasing as the number of items the subjects is
   remembering increases, but is just baseline visual stimulation
   activity or something?)
Yes. It's easier to explain if I can draw it out. But imagine an xy plot with your weight on the x axis and the fMRI response on the y axis. If there is an offset but no change in fMRI with weight, then the data points will be on a horizontal line. Now what happens if you try to fit that data with a line that is forced to pass through xy=0? You'll get some positive slope, but overall it won't fit very well.
   And What exactly to do you mean by divide my presentations
   into low and high weight?  What exactly would this be
   comparing?  Sorry if I'm being dense.
I mean create a new paradigm file with two non-null conditions. Condition 1 would be all presentations with weight < 0.5 (low weight); Condition 2 would be all those with weight>0.5. You should pick your own weight threshold of course.
doug
   Katie


      doug


      Katie Bettencourt wrote:

          Yes, those are the maps I"ve been comparing.  I've been
          comparing it to BV sort of, but that analysis is not
   surface
          based and I"m not used to it, so I can't quite tell
   which is
          more accurate, though Version 2 gives a much smaller
   area of
          activity, which fits with the description of what I've been
          given about what to expect in BV.  Attached is two
   pictures of
          the difference I get for Version 1:1v0 (labeled with
   "single"
          in the image name) and Version 2:2v0 (labeled with
   "double" in
          the name).  As you can see, Version1 activates a much
   larger
          area than Version 2.

          I guess part of my problem is that I'm having trouble
          understanding exactly what these two versions are
   telling me
          about the data and what the differences is.  Can you try to
          give me a sort of layman's explanation?

          Katie


          On Tue, Feb 22, 2011 at 11:45 AM, Douglas N Greve
          <greve@nmr.mgh.harvard.edu
   <mailto:greve@nmr.mgh.harvard.edu>
   <mailto:greve@nmr.mgh.harvard.edu
   <mailto:greve@nmr.mgh.harvard.edu>>
          <mailto:greve@nmr.mgh.harvard.edu
   <mailto:greve@nmr.mgh.harvard.edu>
          <mailto:greve@nmr.mgh.harvard.edu
   <mailto:greve@nmr.mgh.harvard.edu>>>> wrote:

             I assume that you are comparing maps of Version1:1v0 and
             Version2:2v0 ? I could imagine it going either way.
   If the true
             slope is 0 but the offset is non-0, then Version1
   will give
          you an
             artificially high slope (and Verion2 will give you
   the correct
             slope at 0, and so no activation). Are you comparing
   this
          to a BV
             analysis?

             doug


             Katie Bettencourt wrote:

                 So I created a weighted regression analysis to
   look at the
                 effect of memory load in a particular brain region.
          Basically,
                 I weighted the paradigms by a behavioral measure
   that
                 reflected the number of items actually
   remembered (as
          set size
                 was increased).  As far as Doug told me there are
          basically 2
                 ways to weight your paradigm files.

                 Version 1:
                 Have 2 conditions, baseline (condition 0) and
   all the set
                 sizes (condition 1).  Condition 1 would then be
   weighted by
                 the behavioral measure.

                 Version 2:
                 Have 3 conditions, baseline (condition 0), and
   then I
                 represented each presentation as two different
          conditions, one
                 with a weight that is always 1 (condition 1),
   the other
                 weighted according to the behavioral measure
   (condition 2).


                 The difference, as far as I understand it, in
   version
          1, it is
                 assumed that the response amplitude is ) when the
          weight is 0
                 (ie. that when you are attending to 0 items, brain
          activity =
                 0).  Whereas, version 2, tests the slope of the HRF
          amplitude
                 vs weight without the assumption above.

                 However, I'm a bit confused as to the results I got.
           When I
                 looked at the data from both versions, version 1
   provided a
                 much higher amount of activation and more areas
          activated than
                 version 2.  However, I believe version 2 better fits
          with the
                 multiple regression analysis that is done in
   Brain Voyager.
                 Can anyone give me a better explanation of what the
          difference
                 between these analysis models is?

                 Katie


             --     Douglas N. Greve, Ph.D.
             MGH-NMR Center
             greve@nmr.mgh.harvard.edu
   <mailto:greve@nmr.mgh.harvard.edu>
          <mailto:greve@nmr.mgh.harvard.edu
   <mailto:greve@nmr.mgh.harvard.edu>>
          <mailto:greve@nmr.mgh.harvard.edu
   <mailto:greve@nmr.mgh.harvard.edu>
          <mailto:greve@nmr.mgh.harvard.edu
   <mailto:greve@nmr.mgh.harvard.edu>>>

             Phone Number: 617-724-2358 Fax: 617-726-7422

             Bugs: surfer.nmr.mgh.harvard.edu/fswiki/BugReporting
   <http://surfer.nmr.mgh.harvard.edu/fswiki/BugReporting>
          <http://surfer.nmr.mgh.harvard.edu/fswiki/BugReporting>
             <http://surfer.nmr.mgh.harvard.edu/fswiki/BugReporting>

             FileDrop:
          www.nmr.mgh.harvard.edu/facility/filedrop/index.html
   <http://www.nmr.mgh.harvard.edu/facility/filedrop/index.html>
                 <
http://www.nmr.mgh.harvard.edu/facility/filedrop/index.html%3E < http://www.nmr.mgh.harvard.edu/facility/filedrop/index.html%3E
             The information in this e-mail is intended only for the
          person to
             whom it is
             addressed. If you believe this e-mail was sent to you in
          error and
             the e-mail
             contains patient information, please contact the
   Partners
             Compliance HelpLine at
             http://www.partners.org/complianceline . If the
   e-mail was
          sent to
             you in error
             but does not contain patient information, please
   contact the
             sender and properly
             dispose of the e-mail.
      --     Douglas N. Greve, Ph.D.
      MGH-NMR Center
      greve@nmr.mgh.harvard.edu
   <mailto:greve@nmr.mgh.harvard.edu>
   <mailto:greve@nmr.mgh.harvard.edu
   <mailto:greve@nmr.mgh.harvard.edu>>
      Phone Number: 617-724-2358 Fax: 617-726-7422

      Bugs: surfer.nmr.mgh.harvard.edu/fswiki/BugReporting
   <http://surfer.nmr.mgh.harvard.edu/fswiki/BugReporting>
      <http://surfer.nmr.mgh.harvard.edu/fswiki/BugReporting>
      FileDrop:
   www.nmr.mgh.harvard.edu/facility/filedrop/index.html
   <http://www.nmr.mgh.harvard.edu/facility/filedrop/index.html>
      <http://www.nmr.mgh.harvard.edu/facility/filedrop/index.html>
-- Douglas N. Greve, Ph.D. MGH-NMR Center greve@nmr.mgh.harvard.edu mailto:greve@nmr.mgh.harvard.edu Phone Number: 617-724-2358 Fax: 617-726-7422
Bugs: surfer.nmr.mgh.harvard.edu/fswiki/BugReporting http://surfer.nmr.mgh.harvard.edu/fswiki/BugReporting FileDrop: www.nmr.mgh.harvard.edu/facility/filedrop/index.html http://www.nmr.mgh.harvard.edu/facility/filedrop/index.html
-- Douglas N. Greve, Ph.D. MGH-NMR Center greve@nmr.mgh.harvard.edu Phone Number: 617-724-2358 Fax: 617-726-7422
Bugs: surfer.nmr.mgh.harvard.edu/fswiki/BugReporting FileDrop: www.nmr.mgh.harvard.edu/facility/filedrop/index.html
freesurfer@nmr.mgh.harvard.edu
-
 Katie Bettencourt