
Hello, I am a new user of freesurfer and I have not found any pages on the wiki that address my issue.
I am running a correlational analysis between regions of the brain and cognitive scores for controls and patients with schizophrenia. After preprocessing all of the MPRAGESs, I generated stats tables for all of the structures in the brain for all of my sample on freesurfer. I then took the raw stats values and did massive correlation matrix on spss to see what regions of the brain most correlated with my factor scores. After this, I isolated the most significant values to see if I could determine any sort of pattern from the data and used this for reference as I continued the analysis on qdec.
From qdec, I tried to reproduce my correlations from the raw stats table data and none of the correlations that I produced were viewable on the brains in Freesurfer. I have included a selection of pictures to illustrate my process, so that you all better understand my predicament.
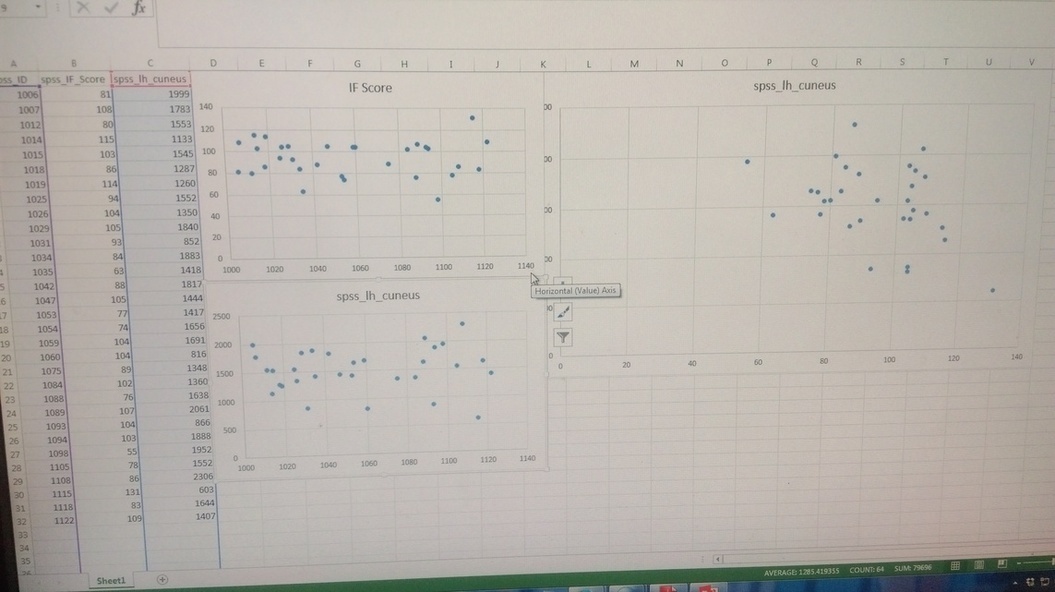
(Picture1) These are three simple graphs I created in excel from the data I was using on spss. The graph on the top left are my factor scores for all of my patients. The graph on the bottom left are the areas of the cuneus for all of my patients. The graph on the right is the correlation between those two values, which produces a correlation of -.55 at a .002 significance.
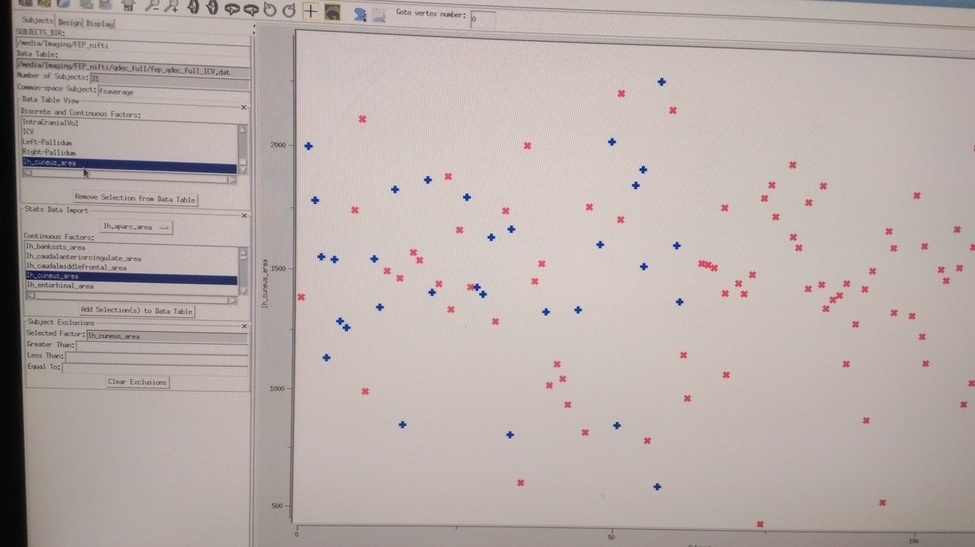
(Picture 2 and 3) I then replicated the two graphs from my excel sheet on qdec. I generated the stats tables for my sample again, then used the area of the cuneus produced by qdec. My factor score (picture 2) and the area of the cuneus (picture 3) match my two original graphs exactly. This leads me to believe that qdec is using the exact same values that I was using in spss.
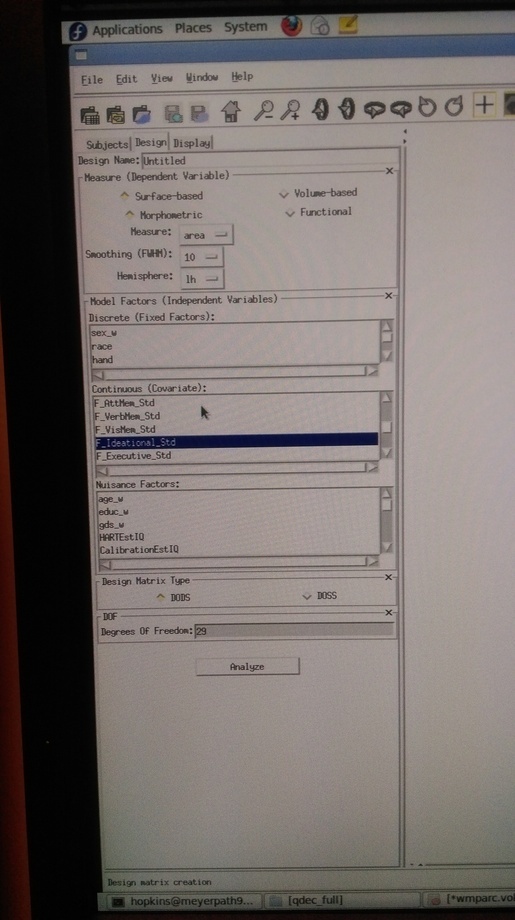
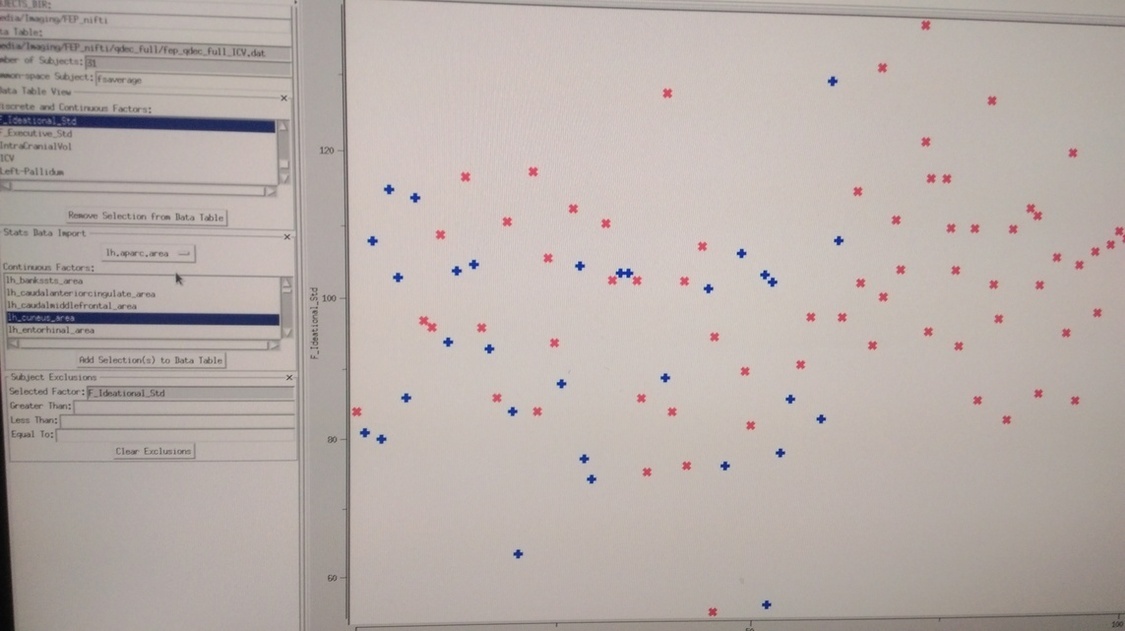
(Picture 4) These are my design parameters that I inputted. I am measuring area, FWHM of 10, left hemisphere, no discrete factor (since I only want the correlation run on the 31 patients I selected initially), my factor score is my continuous variable, no nuisance factor, and am using DODS.
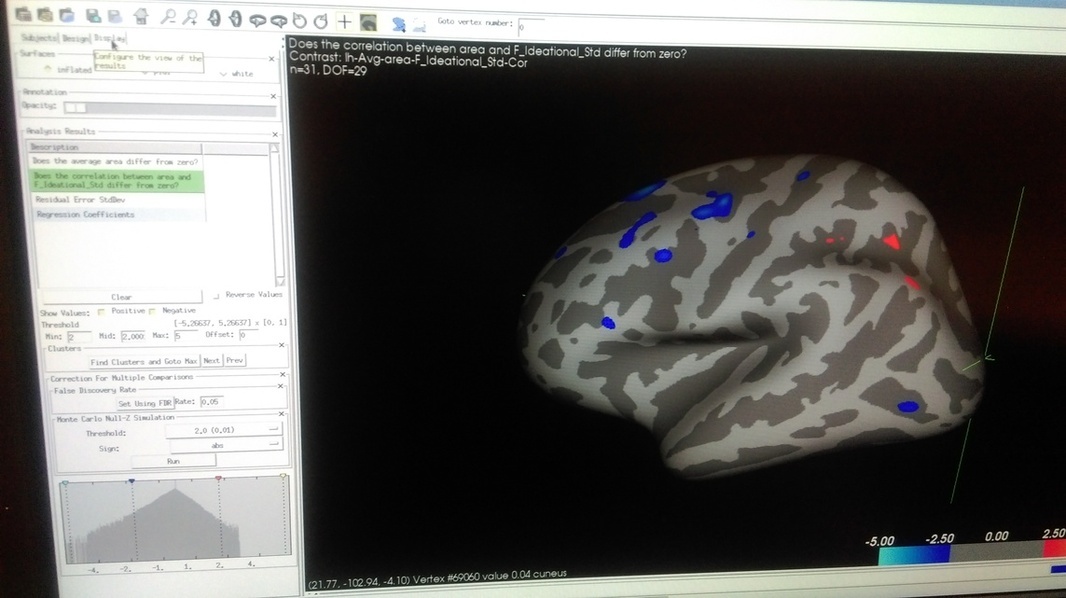
(Picture 5) This is the brain that was produced. The marker is placed where the cuneus is located and there is no significant negative correlation in that location.
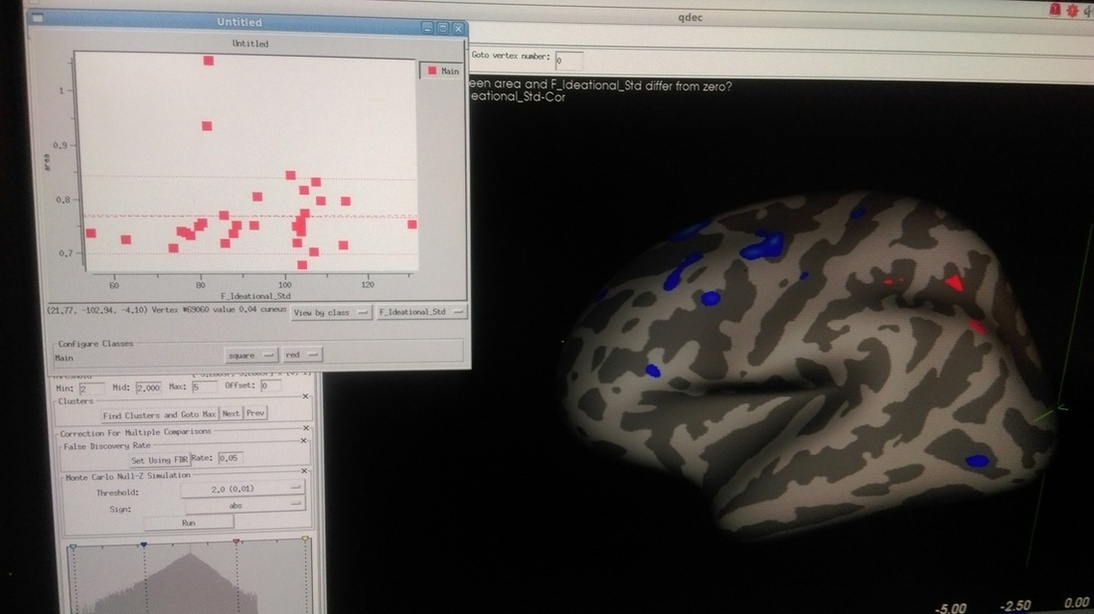
(Picture 6) This is the graph produced by qdec for the correlation between my factor score and the area of the cuneus. It looks nothing like the correlation graph I produced in picture 1, so I am confused.
From talking to my colleague who has used freesurfer before, there should be a consistency between correlations drawn from the raw stats table values and the correlations presented by freesurfer, but I just can't find it. I have feeling that, if I am doing something wrong (the probable case), it is happening at picture 4 where I am inputting the sample information into the analysis. If not, then does freesurfer do any sort of transformation or thresholding that I am not aware of that would change the presentation of the raw results from the stats table? This is of great concern to me, because a large part of my intended analysis will be on subcorical and white matter values, which in my understanding, are only accessible from the raw stats table.
I apologize for my ignorance and hope that someone out there can shed some light on what is going wrong. If you need me to send my stats table or my factors scores, then I can.
Many thanks,
Jeff
freesurfer@nmr.mgh.harvard.edu
-
 Jeffrey Crawford