
External Email - Use Caution
Dear Doug,
Thanks a lot for providing the instructions. It seems it's working fine now. I have following three follow-up concerns:
*1. The text file for the DMN (which has 5 regions) I get at the end looks like the following. I am not sure why I get values of 25 clusters as follows. Although, it seems the first 5 clusters belong to the 5 regions of the DMN. The rest of the clusters from 6th to 25th show 1 voxel only.* *Could you please confirm if my interpretation is correct that the first five belong to 5 ROIs of the DMN? And, what do the rest represent? Can I just ignore those?* (The same is the case for other networks e.g. for the limbic network (which has 2 regions), I get text file of 12 regions with regions 3rd to 12th only 1 voxel, and there it seems the first two ROIs belong to the limbic network.) ..... # ColHeaders Index SegId NVoxels Volume_mm3 StructName Mean StdDev Min Max Range 1 1 15712 15712.0 Seg0001 2.7525 0.6145 0.9909 4.9323 3.9414 2 2 7026 7026.0 Seg0002 3.1722 0.6279 1.6064 5.0000 3.3936 3 3 6268 6268.0 Seg0003 2.7608 0.5594 0.5501 4.8145 4.2644 4 4 5424 5424.0 Seg0004 2.6581 0.5140 0.7961 4.3648 3.5687 5 5 533 533.0 Seg0005 2.8529 0.7931 0.0000 4.9511 4.9511 6 6 1 1.0 Seg0006 2.9284 0.0000 2.9284 2.9284 0.0000 7 7 1 1.0 Seg0007 2.7651 0.0000 2.7651 2.7651 0.0000 8 8 1 1.0 Seg0008 4.5695 0.0000 4.5695 4.5695 0.0000 9 9 1 1.0 Seg0009 3.3998 0.0000 3.3998 3.3998 0.0000 10 10 1 1.0 Seg0010 2.4130 0.0000 2.4130 2.4130 0.0000 11 11 1 1.0 Seg0011 2.3768 0.0000 2.3768 2.3768 0.0000 12 12 1 1.0 Seg0012 2.0668 0.0000 2.0668 2.0668 0.0000 13 13 1 1.0 Seg0013 2.1846 0.0000 2.1846 2.1846 0.0000 14 14 1 1.0 Seg0014 4.4352 0.0000 4.4352 4.4352 0.0000 15 15 1 1.0 Seg0015 2.1129 0.0000 2.1129 2.1129 0.0000 16 16 1 1.0 Seg0016 1.8682 0.0000 1.8682 1.8682 0.0000 17 17 1 1.0 Seg0017 2.4406 0.0000 2.4406 2.4406 0.0000 18 18 1 1.0 Seg0018 2.3616 0.0000 2.3616 2.3616 0.0000 19 19 1 1.0 Seg0019 2.9061 0.0000 2.9061 2.9061 0.0000 20 20 1 1.0 Seg0020 4.0454 0.0000 4.0454 4.0454 0.0000 21 21 1 1.0 Seg0021 3.3300 0.0000 3.3300 3.3300 0.0000 22 22 1 1.0 Seg0022 2.9533 0.0000 2.9533 2.9533 0.0000 23 23 1 1.0 Seg0023 2.4742 0.0000 2.4742 2.4742 0.0000 24 24 1 1.0 Seg0024 3.4334 0.0000 3.4334 3.4334 0.0000 25 25 1 1.0 Seg0025 4.0615 0.0000 4.0615 4.0615 0.0000
*2. Although I extracted thickness measures as we discussed in the previous email (command # 4), somehow the output text file above shows "Volume_mm3"? Could you please help with this as well whether it's thickness or volume as the output above because I never mentioned volume in the command line?*
*3. As there are 5 ROIs in the DMN, how can I interpret which of the values from the above text file belong to which ROI? For example, in the above text, I am not sure to which ROI "Seg0001" belongs to? When I open ocn.mgz file in FreeView, there I get segmentation numbers at the bottom right corner, maybe those are the same as described in the text file? Could you confirm if that's correct?*
*Thanks!*
On Mon, Jul 27, 2020 at 3:25 PM Douglas N. Greve dgreve@mgh.harvard.edu wrote:
You would have to divide them yourself. You can do this by:
- Creating a label of that network (mri_annotation2label)
- Creating a binary mask of that network by converting the label into a
mask (mri_label2label with --outmask option and --regmethod surface) 3. Divide into individual "clusters" using mri_surfcluster --in mask.mgz --thmin 0.5 --ocn ocn.mgz 4. Get measures for each of the clusters, eg, mri_segstats --excludeid 0 --seg ocn.mgz --i lh.thickness --sum sum.network7.thickness.dat
On 7/27/2020 4:08 PM, Martin Juneja wrote:
External Email - Use CautionHi Doug,
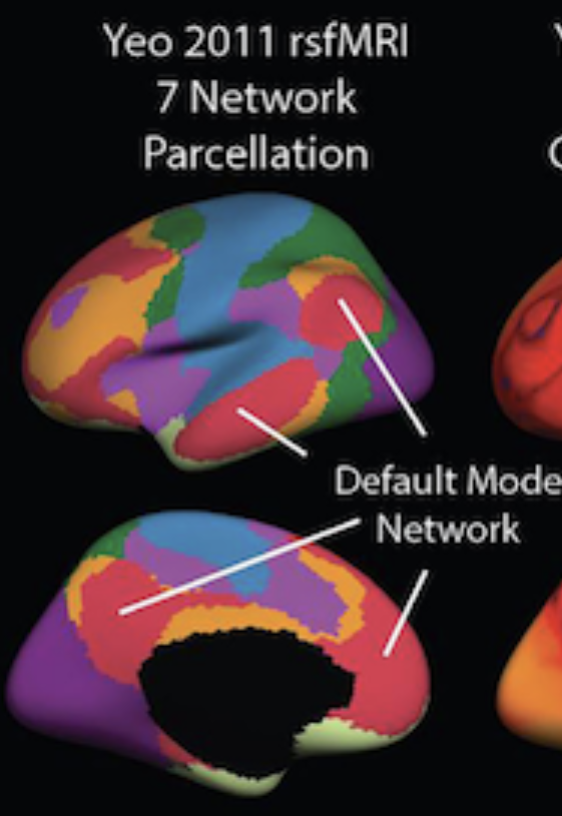
By each region I mean cortical measures of *every individual region that is part of a network*. For example, for the network 7 i.e., DMN, I am interested in getting cortical measures of 4 regions shown in the following screenshot in red color: (and similarly I am interested in getting cortical measures for every individual region of all other 6 networks as well)
[image: DMN_Regions.png]
On Mon, Jul 27, 2020 at 9:33 AM Douglas N. Greve dgreve@mgh.harvard.edu wrote:
What do you mean "each region"? Do you mean each vertex?
On 7/27/2020 2:19 AM, Martin Juneja wrote:
External Email - Use CautionDear Doug,
I ran the following command, but it still gives me network-wise cortical measures. But I am actually looking for cortical measures of *each region* within each network:
*mris_anatomical_stats -th3 -mgz -cortex 2500a/label/lh.cortex.label -f 2500a/stats/lh.aparc.Yeo7.stats -b -a **Yeo2011_7Networks_N1000.annot -c 2500a/label/aparc.annot.Yeo7.ctab 2500a lh white*
INFO: using TH3 volume calc
INFO: assuming MGZ format for volumes.
INFO: using 2500a/label/lh.cortex.label as mask to calc cortex NumVert, SurfArea and MeanThickness.
computing statistics for each annotation in Yeo2011_7Networks_N1000.annot.
reading volume /Volumes/HD-DHTR6/01_Project_FreeSurfer/2500a/mri/wm.mgz...
reading input surface /Volumes/HD-DHTR6/01_Project_FreeSurfer/2500a/surf/lh.white...
Using TH3 vertex volume calc
Total face volume 284736
Total vertex volume 281405 (mask=0)
reading input pial surface /Volumes/HD-DHTR6/01_Project_FreeSurfer/2500a/surf/lh.pial...
reading input white surface /Volumes/HD-DHTR6/01_Project_FreeSurfer/2500a/surf/lh.white...
reading colortable from annotation file...
colortable with 8 entries read (originally MyColorLUT)
Saving annotation colortable 2500a/label/aparc.annot.Yeo7.ctab
table columns are:
number of vertices

total surface area (mm^2)

total gray matter volume (mm^3)

average cortical thickness +- standard deviation (mm)

integrated rectified mean curvature

integrated rectified Gaussian curvature

folding index

intrinsic curvature index

structure name
atlas_icv (eTIV) = 1393613 mm^3 (det: 1.397882 )
lhCtxGM: 279618.799 278859.000 diff= 759.8 pctdiff= 0.272
rhCtxGM: 283065.244 282415.000 diff= 650.2 pctdiff= 0.230
lhCtxWM: 221173.591 221952.500 diff= -778.9 pctdiff=-0.352
rhCtxWM: 221330.870 222469.500 diff=-1138.6 pctdiff=-0.514
SubCortGMVol 57065.000
SupraTentVol 1072714.504 (1069458.000) diff=3256.504 pctdiff=0.304
SupraTentVolNotVent 1066020.504 (1062764.000) diff=3256.504 pctdiff=0.305
BrainSegVol 1210413.000 (1208649.000) diff=1764.000 pctdiff=0.146
BrainSegVolNotVent 1201232.000 (1200612.504) diff=619.496 pctdiff=0.052
BrainSegVolNotVent 1201232.000
CerebellumVol 138356.000
VentChorVol 6694.000
3rd4th5thCSF 2487.000
CSFVol 723.000, OptChiasmVol 112.000
MaskVol 1616427.000
8855 5731 2791 0.977 1.446 0.081 0.035 129 14.2 FreeSurfer_Defined_Medial_Wall
28199 18195 45320 2.362 0.630 0.131 0.031 374 34.3 7Networks_1
21313 13976 38622 2.484 0.632 0.119 0.027 239 22.6 7Networks_2
16377 10929 29338 2.522 0.521 0.116 0.024 192 15.7 7Networks_3
12076 8058 25013 2.797 0.650 0.119 0.028 146 13.2 7Networks_4
11151 7626 29041 3.067 0.733 0.127 0.033 167 14.5 7Networks_5
16205 10841 32923 2.607 0.631 0.123 0.028 228 17.6 7Networks_6
34755 23626 78358 2.825 0.621 0.125 0.029 494 39.7 7Networks_7
On Fri, Jul 17, 2020 at 9:35 AM Douglas N. Greve dgreve@mgh.harvard.edu wrote:
Try something like mris_anatomical_stats -th3 -mgz -cortex ../label/lh.cortex.label -f ../stats/lh.yeo.stats -b -a ../label/lh.yeo.annot -c ../label/yeo.annot.ctab 1040 lh white
Assuming that your yeo atlas is in $SUBJECTS_DIR/$subject/label/lh.yeo.annot
On 7/15/2020 2:05 PM, Martin Juneja wrote:
External Email - Use CautionDear Doug,
Thanks for your response !
Yes, I have Yeo atlas in the individual space, and recon-all.log has the following command:
mris_anatomical_stats -th3 -mgz -cortex ../label/lh.cortex.label -f ../stats/lh.aparc.stats -b -a ../label/lh.aparc.annot -c ../label/aparc.annot.ctab 1040 lh white \n computing statistics for each annotation in ../label/lh.aparc.annot.
Could you please help me in customizing this because it seems it gives me stats for each annotation e.g. stats for 34 areas (for Desikan atlas) and 7 networks (for Yeo 7 network, I think this is averaged over each network, correct?), but I am looking for stats of the regions which constitute those networks (e.g. stats for the areas which are part of the default mode network i.e., 4 individual stats of 4 individual red colored regions in the following figure).
[image: DMN.png]
On Wed, Jul 15, 2020 at 8:54 AM Douglas N. Greve dgreve@mgh.harvard.edu wrote:
If you have the Yeo atlas in the individual space, you can use mris_anatomical_stats to compute stats the same as in the Desikan atlas. Look in recon-all.log for the command line and customize it as needed
On 7/14/2020 5:00 PM, Martin Juneja wrote:
External Email - Use CautionHi experts,
I extracted network-wise cortical measures (i.e., 7 cortical thickness values for 7 networks for Yeo atlas).
I was wondering if there is a way to get the cortical thickness of each ROI within each of these networks e.g., cortical thickness values of all the ROIs which constitute default-mode network of Yeo's 7 network parcellation, and then cortical thickness values of all the ROIs which constitute limbic network of Yeo's 7 network parcellation, and so on.
I know Desikan atlas can be used to get morphometry measures of 34 ROIs per hemisphere. But the problem is that e.g., default-mode ROIs from Desikan atlas do not completely overlap with the DMN of 7-network parcellation from Yeo atlas. In other words, superior frontal cortex from default-mode network of Yeo 7 network parcellation is a big chunk compared to several small ROIs (some partial and some full) in Desikan atlas, so I do not see any way how to find ROIs which just match with that superior frontal cortex of default-mode of Yeo's 7 network.
Any help would be much appreciated !
Freesurfer mailing listFreesurfer@nmr.mgh.harvard.eduhttps://mail.nmr.mgh.harvard.edu/mailman/listinfo/freesurfer
Freesurfer mailing list Freesurfer@nmr.mgh.harvard.edu https://mail.nmr.mgh.harvard.edu/mailman/listinfo/freesurfer
Freesurfer mailing listFreesurfer@nmr.mgh.harvard.eduhttps://mail.nmr.mgh.harvard.edu/mailman/listinfo/freesurfer
Freesurfer mailing list Freesurfer@nmr.mgh.harvard.edu https://mail.nmr.mgh.harvard.edu/mailman/listinfo/freesurfer
Freesurfer mailing listFreesurfer@nmr.mgh.harvard.eduhttps://mail.nmr.mgh.harvard.edu/mailman/listinfo/freesurfer
Freesurfer mailing list Freesurfer@nmr.mgh.harvard.edu https://mail.nmr.mgh.harvard.edu/mailman/listinfo/freesurfer
Freesurfer mailing listFreesurfer@nmr.mgh.harvard.eduhttps://mail.nmr.mgh.harvard.edu/mailman/listinfo/freesurfer
Freesurfer mailing list Freesurfer@nmr.mgh.harvard.edu https://mail.nmr.mgh.harvard.edu/mailman/listinfo/freesurfer