
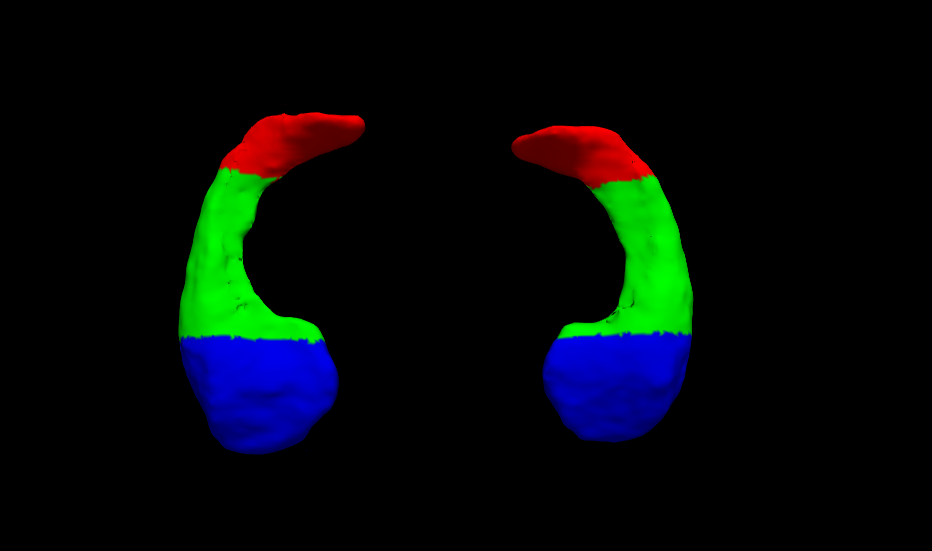
You can use the isosurface approach for a fast visualization. With a little more work you can generate a surface from your data and get a result like the attached picture. Em Qui, 2014-02-06 às 01:04 -0800, Salil Soman escreveu:
Hi,
I generated hippocampal subfield segmentations, can generate statistics, but was wondering if there was a way to visualized the subfield segmentations as a 3D structure? (e.g. like the figure in this paper: http://niacal.northwestern.edu/projects/17)
Thank you for your consideration.
Best wishes,
-- Salil Soman, MD, MS Postdoctoral Research Fellow - Stanford Radiological Sciences Laboratory Fellow - Palo Alto War Related Illness and Injury Study Center WOC Neuroradiology Attending - Veterans Affairs Palo Alto Health Care System
Freesurfer mailing list Freesurfer@nmr.mgh.harvard.edu https://mail.nmr.mgh.harvard.edu/mailman/listinfo/freesurfer
The information in this e-mail is intended only for the person to whom it is addressed. If you believe this e-mail was sent to you in error and the e-mail contains patient information, please contact the Partners Compliance HelpLine at http://www.partners.org/complianceline . If the e-mail was sent to you in error but does not contain patient information, please contact the sender and properly dispose of the e-mail.