
It does not make sense that the rh is all yellow. Are you sure that your contrast is exactly the same as the lh? If so, it would indicate that there might be something wrong with the rh data. You can load the stack (ie, the file passed with --y) into freeview with something like tksurferfv fsaverage lh inflated -ov y.mgz -fmimax .01 3 You can then click on the time course button and see all of your subjects at each vertex; look for outliers
On 1/14/2021 11:12 AM, Swanson,Clayton wrote:
External Email - Use Caution
Hi Doug and FreeSurfer Team, I just wanted to respond to the email below with some additional questions and bring in a new correspondence you previously had: *MailScanner has detected a possible fraud attempt from "secure-web.cisco.com" claiming to be* https://www.mail-archive.com/freesurfer@nmr.mgh.harvard.edu/msg20712.html https://secure-web.cisco.com/1OBQxGFTmLmvcKpGenNMD2bw56whnGR7EzeXaSAS0Yz1Vg_y7fMdaIutH0VGH47Cg-ANSYQLkahmIorcMeN5ieh8ETE8gHBg6ipK0y2Ufp5FaU-MdnLtKRTKfiuXGrQnvfxy1Q-2H0WCJx07D0Nd9xSgm-ZzbdLHb0w-ZsgnRFP6iStuNaylzUao-miaCDD6lLzXn7_iWkW_C7wJJF6oPvJZ7feSH4HWKprLDMfS3vIpmGplXfC8_WR8Inikpbl3KN4B8Ts-pZPWakMytKr2LQA/https%3A%2F%2Fwww.mail-archive.com%2Ffreesurfer%40nmr.mgh.harvard.edu%2Fmsg20712.html because it resembles something similar to what I am trying to do. I am trying to assess cortical thickness differences between Healthy Controls and people with MS. I set up my FSGD file accordingly:
GroupDescriptorFile 1
Title MRS_Age_sex
Class HC_M
Class HC_F
Class MS_M
Class MS_F
Variables Age
Input Subj_002_FLAIR HC_F 37.5
Input Subj_003_FLAIR HC_F 31.7
Input Subj_006_FLAIR HC_F 29.0
Similar to the email in the link _above_ I would like to first test whether there is a group difference for cortical thickness in the age slope by running the contrast [0 0 0 0 .5 .5 -.5 -.5] using --perm 1000 3.0 abs --cwp0.05--2spaces --bg 16. When I run that I do get a couple spots on the brain that are significant for both hemispheres. Therefore, I moved forward to assess group differences with /age/ kept in (instead of removing it and running a DOSS contrast [.5 .5 -.5 -.5 0]). So I used the contrast [.5 .5 -.5 -.5 0 0 0 0], I ran that with a number of permutations including —perm 1000 3.0 abs, —perm 1000 2.0 abs, and --perm 1000 2.0 pos.
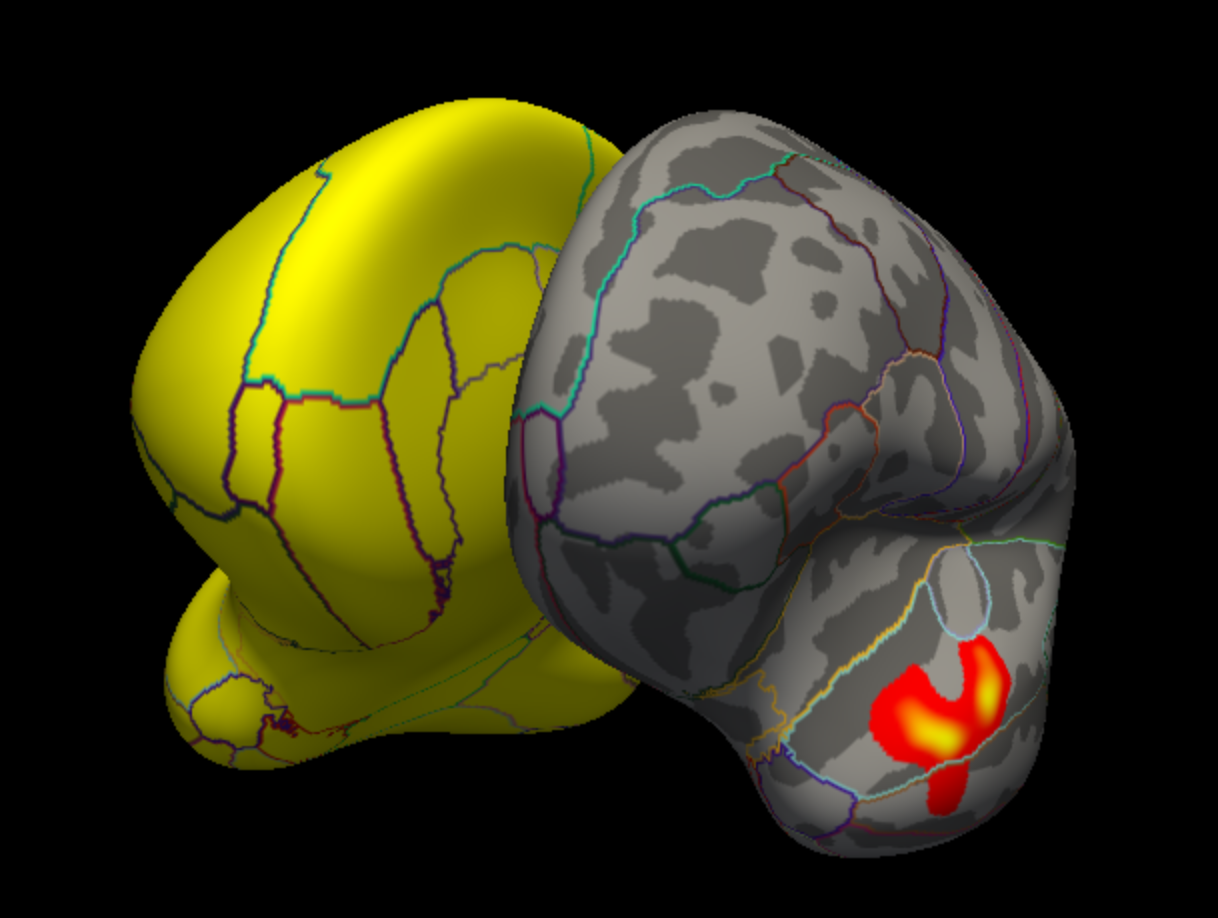
I ran all three of those because when I open up the right hemisphere to view the results the entire hemisphere is yellow (image attached), however for the left hemisphere I do get a region of the brain that is clustered. I am wondering what would cause the entire right hemisphere to be yellow. Do you think it would make sense to forget about age (because the groups were age matched) and just run the DOSS contrast [.5 .5 -.5 -.5 0].
Thanks for any help you are able to provide. Thanks, Clayton
On Jan 3, 2021, at 9:00 PM, Greve, Douglas N.,Ph.D. <DGREVE@mgh.harvard.edu mailto:DGREVE@mgh.harvard.edu> wrote:
I think that contrast computes Female-Male regressing out Dx and age. If you want HC vs MS, then use -0.5 -0.5 0.5 0.5
On 12/29/2020 4:52 PM, Swanson,Clayton wrote:
External Email - Use Caution
Hi Freesurfer Team, I am performing an analysis on 23 HC and 26 people with MS and I would like to perform the stats appropriately. I would like to control for (or regress out) age and sex. Therefore, I created my FSGD file which has 4 classes (HC_Male, HC_Female, MS_Male, MS_Female) with age being the only variable. My contrast for this analysis is: 0.5 -0.5 0.5 -0.5 0 0 0 0. Lastly, I want to run a permutation analysis, so I set it up like this:
#!/bin/tcsh setenv study $argv[1] foreach meas (thickness volume) foreach hemi (lh rh) foreach smoothness (10) foreach dir ({$hemi}.{$meas}.{$study}.{$smoothness}.glmdir) mri_glmfit-sim \ --glmdir {$dir} \ --perm 1000 1.3 pos \ --cwp 0.05 \ --2spaces \ --overwrite end end end end
After running the permutation, my next steps were to view the results in Freeview with the command [ freeview -f $SUBJECTS_DIR/fsaverage/surf/lh.inflated:overlay=perm.th13.pos.sig.cluster.mgh ] because it’s my understanding that would overlay the cluster-wise corrected map and the view I get is an entirely yellow hemisphere. However, there are no significant clusters when viewing the perm.th13.pos.sig.cluster.summary, so I am a bit confused. Also, when I look at the uncorrected results with the sig.mgh file there are a number of spots on the hemisphere.
Does this result mean that there are no cortical thickness differences between HC and MS when controlling for Age and Sex? Or does this result mean something different? What could be the next analysis steps I could perform?
My goals are to assess cortical thickness differences between HC and MS.
Thanks for any help you can provide,
Clayton ________________________________ *Clayton Swanson MS* Graduate Research Assistant & PhD Candidate Sensorimotor Neuroimaging Laboratory Colorado State University Office: (970) 491-6160 Clayton.Swanson@colostate.edu mailto:Clayton.Swanson@colostate.edu (He/Him)
Freesurfer mailing list Freesurfer@nmr.mgh.harvard.edu *MailScanner has detected a possible fraud attempt from "secure-web.cisco.com" claiming to be* https://mail.nmr.mgh.harvard.edu/mailman/listinfo/freesurfer
Freesurfer mailing list Freesurfer@nmr.mgh.harvard.edu mailto:Freesurfer@nmr.mgh.harvard.edu https://mail.nmr.mgh.harvard.edu/mailman/listinfo/freesurfer
Freesurfer mailing list Freesurfer@nmr.mgh.harvard.edu https://mail.nmr.mgh.harvard.edu/mailman/listinfo/freesurfer