
23 Aug
2019
23 Aug
'19
1:12 p.m.
External Email - Use Caution
Hello,
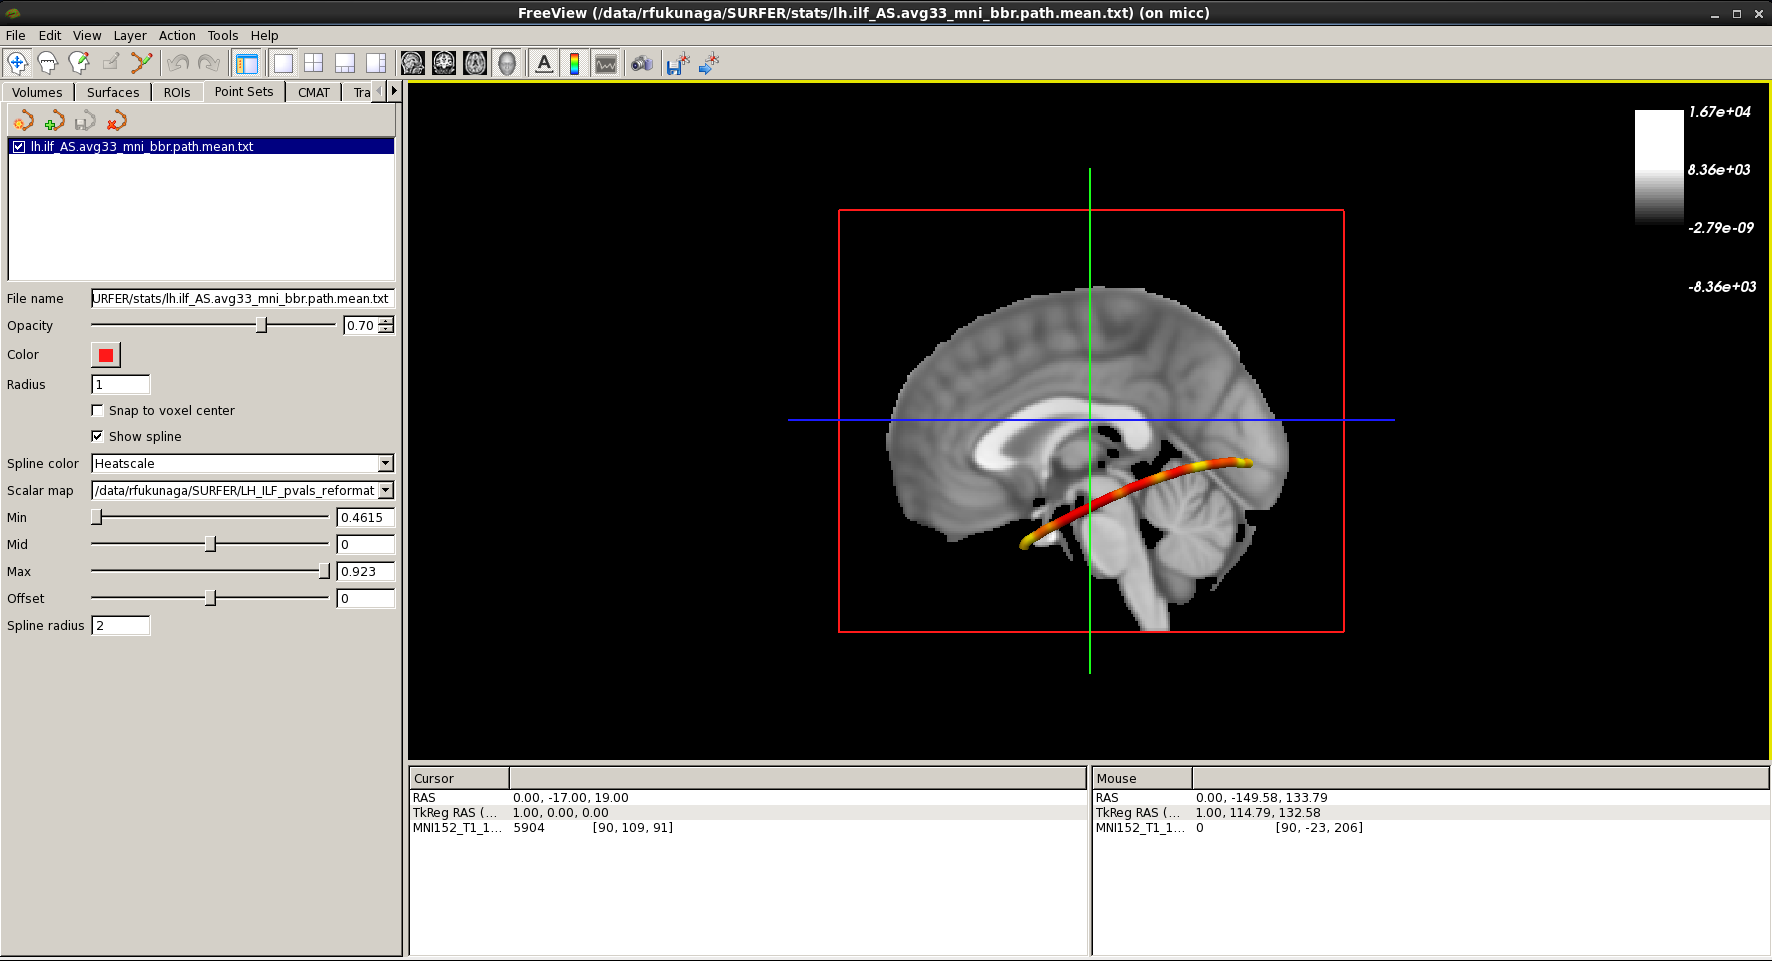
I'm having a bit of trouble with the Show Color Scale option. I have run TRACULA and have loaded a text file containing p-values from an analysis (Spline Color: Heatscale, Scalar map: my p-values file). The values display correctly on the tract.
However, when I use View > Show Color Scale, it looks like the color scale is generated is for the black-and-white volume, instead of for those values. See attached screenshot. I'm instead trying to generate a Color Scale at the right of the figure that shows which colors (yellow to red) correspond to which p-values.
Thanks for your help, Liz