
Dear Freesurfer List
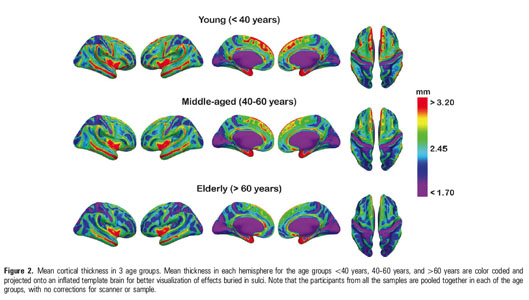
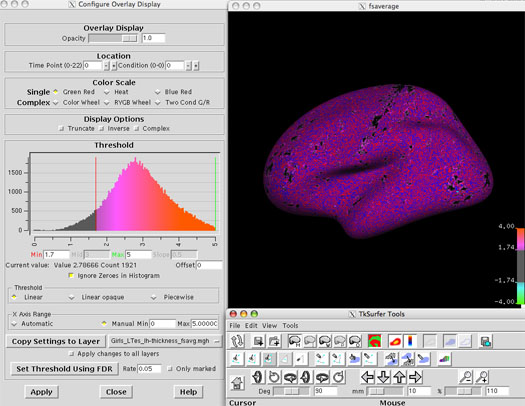
I am trying to make some figures to display mean thickness for my different groups. I have the overlays, but no matter what I do, they look terrible. The only color scale that seems to work is the "hot" scale. Everything else looks completely wrong. Either they look grainy like this or I get a black image. I am attaching screenshot showing what I mean. I am also attaching an example of what I want taken from a paper that also uses Freesurfer. I am studying kids, who have much thicker cortex than adults. I would like to threshold thickness at 1.7, with a max value of 5. Otherwise, I want my figure to look exactly like this one. How can configure the overlay display so that my figures look similar? Thanks
Jen
Jennifer Bramen, Ph.D. Assistant Research Neuroscientist David Geffen School of Medicine at UCLA Developmental Cognitive Neuroimaging 635 Charles Young Drive South Los Angeles, CA 90095-7332 Phone: (310)267-5116 Fax: (310)525-0865 Email: jbramen@mednet.ucla.edu Campus Mail Code 176919
IMPORTANT WARNING: This email (and any attachments) is only intended for the use of the person or entity to which it is addressed, and may contain information that is privileged and confidential. You, the recipient, are obligated to maintain it in a safe, secure and confidential manner. Unauthorized redisclosure or failure to maintain confidentiality may subject you to federal and state penalties. If you are not the intended recipient, please immediately notify us by return email, and delete this message from your computer.