
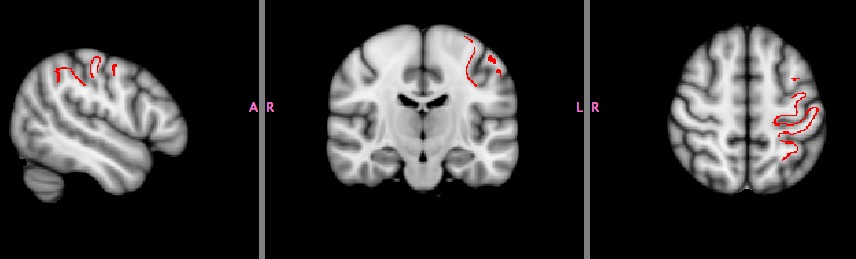
Hi Bruce, I have followed your suggestions using the 'custom fill' botton and then saving the label and using mri_label2vol. This is the command I used:
mri_label2vol --label gyrif_lh.label --temp MNI152_T1_1mm_brain.nii.gz --reg $FREESURFER_HOME/average/mni152.register.dat --o gyrif_lh.nii.gz
However, the nifti file looks like this (see attached) What am I doing wrong? Thank you for your help!
Angela
Hi Angela
in tksurfer you can show the overlay, and use the "custom fill" button to fill the area that is above threshold on the surface. Then save it as a label and use mri_label2vol to write it into a volume. If the output volume you give has the extension .nii.gz it will save it in nifti for you
cheers Bruce
On Sun, 2 Nov 2014, angela.favaro@unipd.it wrote:
Dear all, I found some interesting findings about gyrification and I would like to test any related problem in structural connectivity. My idea was to use the area where I found significant lower gyrification in my sample to perform probabilistic tracking with FSL. My question is: is there any way to label the area of significant difference (or I have to manually draw it) and to transform it in a nifti format?
Angela
Freesurfer mailing list Freesurfer@nmr.mgh.harvard.edu https://mail.nmr.mgh.harvard.edu/mailman/listinfo/freesurfer
Freesurfer mailing list Freesurfer@nmr.mgh.harvard.edu https://mail.nmr.mgh.harvard.edu/mailman/listinfo/freesurfer
The information in this e-mail is intended only for the person to whom it is addressed. If you believe this e-mail was sent to you in error and the e-mail contains patient information, please contact the Partners Compliance HelpLine at http://www.partners.org/complianceline . If the e-mail was sent to you in error but does not contain patient information, please contact the sender and properly dispose of the e-mail.