
Load ocn.mgz as an overlay on the surface (set the lower threshold to 0.5 to see all the clusters). When you click on a cluster, the value of the overlay will be the cluster number. You can also use this to figure out why you have 25 clusters instead of 5. Don't worry about the Volume_mm3, that's just what mri_segstats prints out (this is a fairly non-standard use of it)
On 7/27/2020 7:30 PM, Martin Juneja wrote:
External Email - Use Caution
Dear Doug,
Thanks a lot for providing the instructions. It seems it's working fine now. I have following three follow-up concerns:
*1. The text file for the DMN (which has 5 regions) I get at the end looks like the following. I am not sure why I get values of 25 clusters as follows. Although, it seems the first 5 clusters belong to the 5 regions of the DMN. The rest of the clusters from 6th to 25th show 1 voxel only.* *Could you please confirm if my interpretation is correct that the first five belong to 5 ROIs of the DMN? And, what do the rest represent? Can I just ignore those?* (The same is the case for other networks e.g. for the limbic network (which has 2 regions), I get text file of 12 regions with regions 3rd to 12th only 1 voxel, and there it seems the first two ROIs belong to the limbic network.) ..... # ColHeaders Index SegId NVoxels Volume_mm3 StructName Mean StdDev Min Max Range 1 1 15712 15712.0 Seg0001 2.7525 0.6145 0.9909 4.9323 3.9414 2 2 7026 7026.0 Seg0002 3.1722 0.6279 1.6064 5.0000 3.3936 3 3 6268 6268.0 Seg0003 2.7608 0.5594 0.5501 4.8145 4.2644 4 4 5424 5424.0 Seg0004 2.6581 0.5140 0.7961 4.3648 3.5687 5 5 533 533.0 Seg0005 2.8529 0.7931 0.0000 4.9511 4.9511 6 6 1 1.0 Seg0006 2.9284 0.0000 2.9284 2.9284 0.0000 7 7 1 1.0 Seg0007 2.7651 0.0000 2.7651 2.7651 0.0000 8 8 1 1.0 Seg0008 4.5695 0.0000 4.5695 4.5695 0.0000 9 9 1 1.0 Seg0009 3.3998 0.0000 3.3998 3.3998 0.0000 10 10 1 1.0 Seg0010 2.4130 0.0000 2.4130 2.4130 0.0000 11 11 1 1.0 Seg0011 2.3768 0.0000 2.3768 2.3768 0.0000 12 12 1 1.0 Seg0012 2.0668 0.0000 2.0668 2.0668 0.0000 13 13 1 1.0 Seg0013 2.1846 0.0000 2.1846 2.1846 0.0000 14 14 1 1.0 Seg0014 4.4352 0.0000 4.4352 4.4352 0.0000 15 15 1 1.0 Seg0015 2.1129 0.0000 2.1129 2.1129 0.0000 16 16 1 1.0 Seg0016 1.8682 0.0000 1.8682 1.8682 0.0000 17 17 1 1.0 Seg0017 2.4406 0.0000 2.4406 2.4406 0.0000 18 18 1 1.0 Seg0018 2.3616 0.0000 2.3616 2.3616 0.0000 19 19 1 1.0 Seg0019 2.9061 0.0000 2.9061 2.9061 0.0000 20 20 1 1.0 Seg0020 4.0454 0.0000 4.0454 4.0454 0.0000 21 21 1 1.0 Seg0021 3.3300 0.0000 3.3300 3.3300 0.0000 22 22 1 1.0 Seg0022 2.9533 0.0000 2.9533 2.9533 0.0000 23 23 1 1.0 Seg0023 2.4742 0.0000 2.4742 2.4742 0.0000 24 24 1 1.0 Seg0024 3.4334 0.0000 3.4334 3.4334 0.0000 25 25 1 1.0 Seg0025 4.0615 0.0000 4.0615 4.0615 0.0000
*2. Although I extracted thickness measures as we discussed in the previous email (command # 4), somehow the output text file above shows "Volume_mm3"? Could you please help with this as well whether it's thickness or volume as the output above because I never mentioned volume in the command line?*
*3. As there are 5 ROIs in the DMN, how can I interpret which of the values from the above text file belong to which ROI? For example, in the above text, I am not sure to which ROI "Seg0001" belongs to? When I open ocn.mgz file in FreeView, there I get segmentation numbers at the bottom right corner, maybe those are the same as described in the text file? Could you confirm if that's correct?*
*Thanks!*
On Mon, Jul 27, 2020 at 3:25 PM Douglas N. Greve <dgreve@mgh.harvard.edu mailto:dgreve@mgh.harvard.edu> wrote:
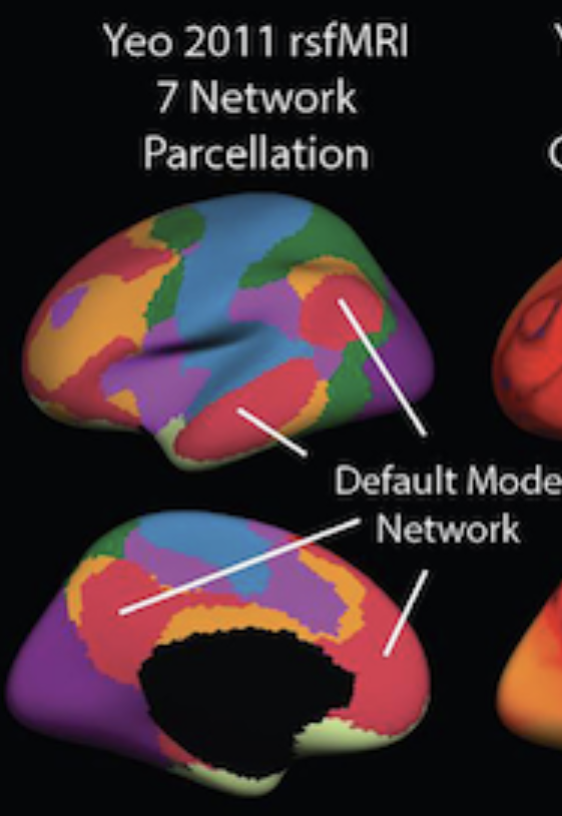
You would have to divide them yourself. You can do this by: 1. Creating a label of that network (mri_annotation2label) 2. Creating a binary mask of that network by converting the label into a mask (mri_label2label with --outmask option and --regmethod surface) 3. Divide into individual "clusters" using mri_surfcluster --in mask.mgz --thmin 0.5 --ocn ocn.mgz 4. Get measures for each of the clusters, eg, mri_segstats --excludeid 0 --seg ocn.mgz --i lh.thickness --sum sum.network7.thickness.dat On 7/27/2020 4:08 PM, Martin Juneja wrote:External Email - Use Caution Hi Doug, By each region I mean cortical measures of *every individual region that is part of a network*. For example, for the network 7 i.e., DMN, I am interested in getting cortical measures of 4 regions shown in the following screenshot in red color: (and similarly I am interested in getting cortical measures for every individual region of all other 6 networks as well) DMN_Regions.png On Mon, Jul 27, 2020 at 9:33 AM Douglas N. Greve <dgreve@mgh.harvard.edu <mailto:dgreve@mgh.harvard.edu>> wrote: What do you mean "each region"? Do you mean each vertex? On 7/27/2020 2:19 AM, Martin Juneja wrote:External Email - Use Caution Dear Doug, I ran the following command, but it still gives me network-wise cortical measures. But I am actually looking for cortical measures of *each region* within each network: *mris_anatomical_stats -th3 -mgz -cortex 2500a/label/lh.cortex.label -f 2500a/stats/lh.aparc.Yeo7.stats -b -a **Yeo2011_7Networks_N1000.annot -c 2500a/label/aparc.annot.Yeo7.ctab 2500a lh white* INFO: using TH3 volume calc INFO: assuming MGZ format for volumes. INFO: using 2500a/label/lh.cortex.label as mask to calc cortex NumVert, SurfArea and MeanThickness. computing statistics for each annotation in Yeo2011_7Networks_N1000.annot. reading volume /Volumes/HD-DHTR6/01_Project_FreeSurfer/2500a/mri/wm.mgz... reading input surface /Volumes/HD-DHTR6/01_Project_FreeSurfer/2500a/surf/lh.white... Using TH3 vertex volume calc Total face volume 284736 Total vertex volume 281405 (mask=0) reading input pial surface /Volumes/HD-DHTR6/01_Project_FreeSurfer/2500a/surf/lh.pial... reading input white surface /Volumes/HD-DHTR6/01_Project_FreeSurfer/2500a/surf/lh.white... reading colortable from annotation file... colortable with 8 entries read (originally MyColorLUT) Saving annotation colortable 2500a/label/aparc.annot.Yeo7.ctab table columns are: number of vertices total surface area (mm^2) total gray matter volume (mm^3) average cortical thickness +- standard deviation (mm) integrated rectified mean curvature integrated rectified Gaussian curvature folding index intrinsic curvature index structure name atlas_icv (eTIV) = 1393613 mm^3(det: 1.397882 ) lhCtxGM: 279618.799 278859.000diff=759.8pctdiff= 0.272 rhCtxGM: 283065.244 282415.000diff=650.2pctdiff= 0.230 lhCtxWM: 221173.591 221952.500diff= -778.9pctdiff=-0.352 rhCtxWM: 221330.870 222469.500diff=-1138.6pctdiff=-0.514 SubCortGMVol57065.000 SupraTentVol1072714.504 (1069458.000) diff=3256.504 pctdiff=0.304 SupraTentVolNotVent1066020.504 (1062764.000) diff=3256.504 pctdiff=0.305 BrainSegVol1210413.000 (1208649.000) diff=1764.000 pctdiff=0.146 BrainSegVolNotVent1201232.000 (1200612.504) diff=619.496 pctdiff=0.052 BrainSegVolNotVent1201232.000 CerebellumVol 138356.000 VentChorVol6694.000 3rd4th5thCSF 2487.000 CSFVol 723.000, OptChiasmVol 112.000 MaskVol 1616427.000 8855 5731 27910.977 1.446 0.081 0.03512914.2FreeSurfer_Defined_Medial_Wall 2819918195453202.362 0.630 0.131 0.03137434.37Networks_1 2131313976386222.484 0.632 0.119 0.02723922.67Networks_2 1637710929293382.522 0.521 0.116 0.02419215.77Networks_3 12076 8058250132.797 0.650 0.119 0.02814613.27Networks_4 11151 7626290413.067 0.733 0.127 0.03316714.57Networks_5 1620510841329232.607 0.631 0.123 0.02822817.67Networks_6 3475523626783582.825 0.621 0.125 0.02949439.77Networks_7 On Fri, Jul 17, 2020 at 9:35 AM Douglas N. Greve <dgreve@mgh.harvard.edu <mailto:dgreve@mgh.harvard.edu>> wrote: Try something like mris_anatomical_stats -th3 -mgz -cortex ../label/lh.cortex.label -f ../stats/lh.yeo.stats -b -a ../label/lh.yeo.annot -c ../label/yeo.annot.ctab 1040 lh white Assuming that your yeo atlas is in $SUBJECTS_DIR/$subject/label/lh.yeo.annot On 7/15/2020 2:05 PM, Martin Juneja wrote:External Email - Use Caution Dear Doug, Thanks for your response ! Yes, I have Yeo atlas in the individual space, and recon-all.log has the following command: mris_anatomical_stats -th3 -mgz -cortex ../label/lh.cortex.label -f ../stats/lh.aparc.stats -b -a ../label/lh.aparc.annot -c ../label/aparc.annot.ctab 1040 lh white \n computing statistics for each annotation in ../label/lh.aparc.annot. Could you please help me in customizing this because it seems it gives me stats for each annotation e.g. stats for 34 areas (for Desikan atlas) and 7 networks (for Yeo 7 network, I think this is averaged over each network, correct?), but I am looking for stats of the regions which constitute those networks (e.g. stats for the areas which are part of the default mode network i.e., 4 individual stats of 4 individual red colored regions in the following figure). DMN.png On Wed, Jul 15, 2020 at 8:54 AM Douglas N. Greve <dgreve@mgh.harvard.edu <mailto:dgreve@mgh.harvard.edu>> wrote: If you have the Yeo atlas in the individual space, you can use mris_anatomical_stats to compute stats the same as in the Desikan atlas. Look in recon-all.log for the command line and customize it as needed On 7/14/2020 5:00 PM, Martin Juneja wrote:External Email - Use Caution Hi experts, I extracted network-wise cortical measures (i.e., 7 cortical thickness values for 7 networks for Yeo atlas). I was wondering if there is a way to get the cortical thickness of each ROI within each of these networks e.g., cortical thickness values of all the ROIs which constitute default-mode network of Yeo's 7 network parcellation, and then cortical thickness values of all the ROIs which constitute limbic network of Yeo's 7 network parcellation, and so on. I know Desikan atlas can be used to get morphometry measures of 34 ROIs per hemisphere. But the problem is that e.g., default-mode ROIs from Desikan atlas do not completely overlap with the DMN of 7-network parcellation from Yeo atlas. In other words, superior frontal cortex from default-mode network of Yeo 7 network parcellation is a big chunk compared to several small ROIs (some partial and some full) in Desikan atlas, so I do not see any way how to find ROIs which just match with that superior frontal cortex of default-mode of Yeo's 7 network. Any help would be much appreciated ! _______________________________________________ Freesurfer mailing list Freesurfer@nmr.mgh.harvard.edu <mailto:Freesurfer@nmr.mgh.harvard.edu> https://mail.nmr.mgh.harvard.edu/mailman/listinfo/freesurfer_______________________________________________ Freesurfer mailing list Freesurfer@nmr.mgh.harvard.edu <mailto:Freesurfer@nmr.mgh.harvard.edu> https://mail.nmr.mgh.harvard.edu/mailman/listinfo/freesurfer _______________________________________________ Freesurfer mailing list Freesurfer@nmr.mgh.harvard.edu <mailto:Freesurfer@nmr.mgh.harvard.edu> https://mail.nmr.mgh.harvard.edu/mailman/listinfo/freesurfer_______________________________________________ Freesurfer mailing list Freesurfer@nmr.mgh.harvard.edu <mailto:Freesurfer@nmr.mgh.harvard.edu> https://mail.nmr.mgh.harvard.edu/mailman/listinfo/freesurfer _______________________________________________ Freesurfer mailing list Freesurfer@nmr.mgh.harvard.edu <mailto:Freesurfer@nmr.mgh.harvard.edu> https://mail.nmr.mgh.harvard.edu/mailman/listinfo/freesurfer_______________________________________________ Freesurfer mailing list Freesurfer@nmr.mgh.harvard.edu <mailto:Freesurfer@nmr.mgh.harvard.edu> https://mail.nmr.mgh.harvard.edu/mailman/listinfo/freesurfer _______________________________________________ Freesurfer mailing list Freesurfer@nmr.mgh.harvard.edu <mailto:Freesurfer@nmr.mgh.harvard.edu> https://mail.nmr.mgh.harvard.edu/mailman/listinfo/freesurfer_______________________________________________ Freesurfer mailing list Freesurfer@nmr.mgh.harvard.edu <mailto:Freesurfer@nmr.mgh.harvard.edu> https://mail.nmr.mgh.harvard.edu/mailman/listinfo/freesurfer
Freesurfer mailing list Freesurfer@nmr.mgh.harvard.edu https://mail.nmr.mgh.harvard.edu/mailman/listinfo/freesurfer