
3rd line for the slope of CU, 4th line for the slope of CI
On 4/25/2022 4:03 PM, Laura Willers de Souza wrote:
External Email - Use Caution
Thanks so much!
I would also like to confirm that I am interpreting the beta values correctly for a second model.
Model 2: Two Groups, One Covariate
Contrasts (DOSS): difference between the group intercepts; covariate effect.
The fsgd file looks like this:
GroupDescriptorFile 1
Title CU_CI_CSF MeasurementName thickness Class CU Class CI Variables cortisolCSF Input 011_S_0003_S9128 CI 2.397895273 Input 022_S_0004_S9233 CI 2.772588722 Input 011_S_0005_S9137 CU 3.044522438 Input 011_S_0008_S9196 CU 2.397895273 Input 011_S_0010_S8800 CI 2.151762203
... (n=300)
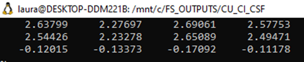
The file with the beta values contains 3 lines (image below).
- The first line would be the beta value for the intercept of the 1st group; the second line for the intercept of the 2nd group; and the third line for the slope of the covariate? o Thus the glm equation for the 1st cluster would be: o 1st group ---- cortical thickness = 2.64 - 0.12X + n o 2nd group --- cortical thickness = 2.54 – 0.12X + n
Am I interpreting correctly?
Thank you very much for all the help! *Laura Willers de Souza *
Master Student in Biochemistry
Zimmer Lab - Federal University of Rio Grande do Sul
- Porto Alegre/RS - Brazil