
Zheng Hui,
I've attached two snapshots replicating what you are seeing, and I will try to explain the differences. It is also analysis using age and gender as factors, with thickness as the dependent variable.
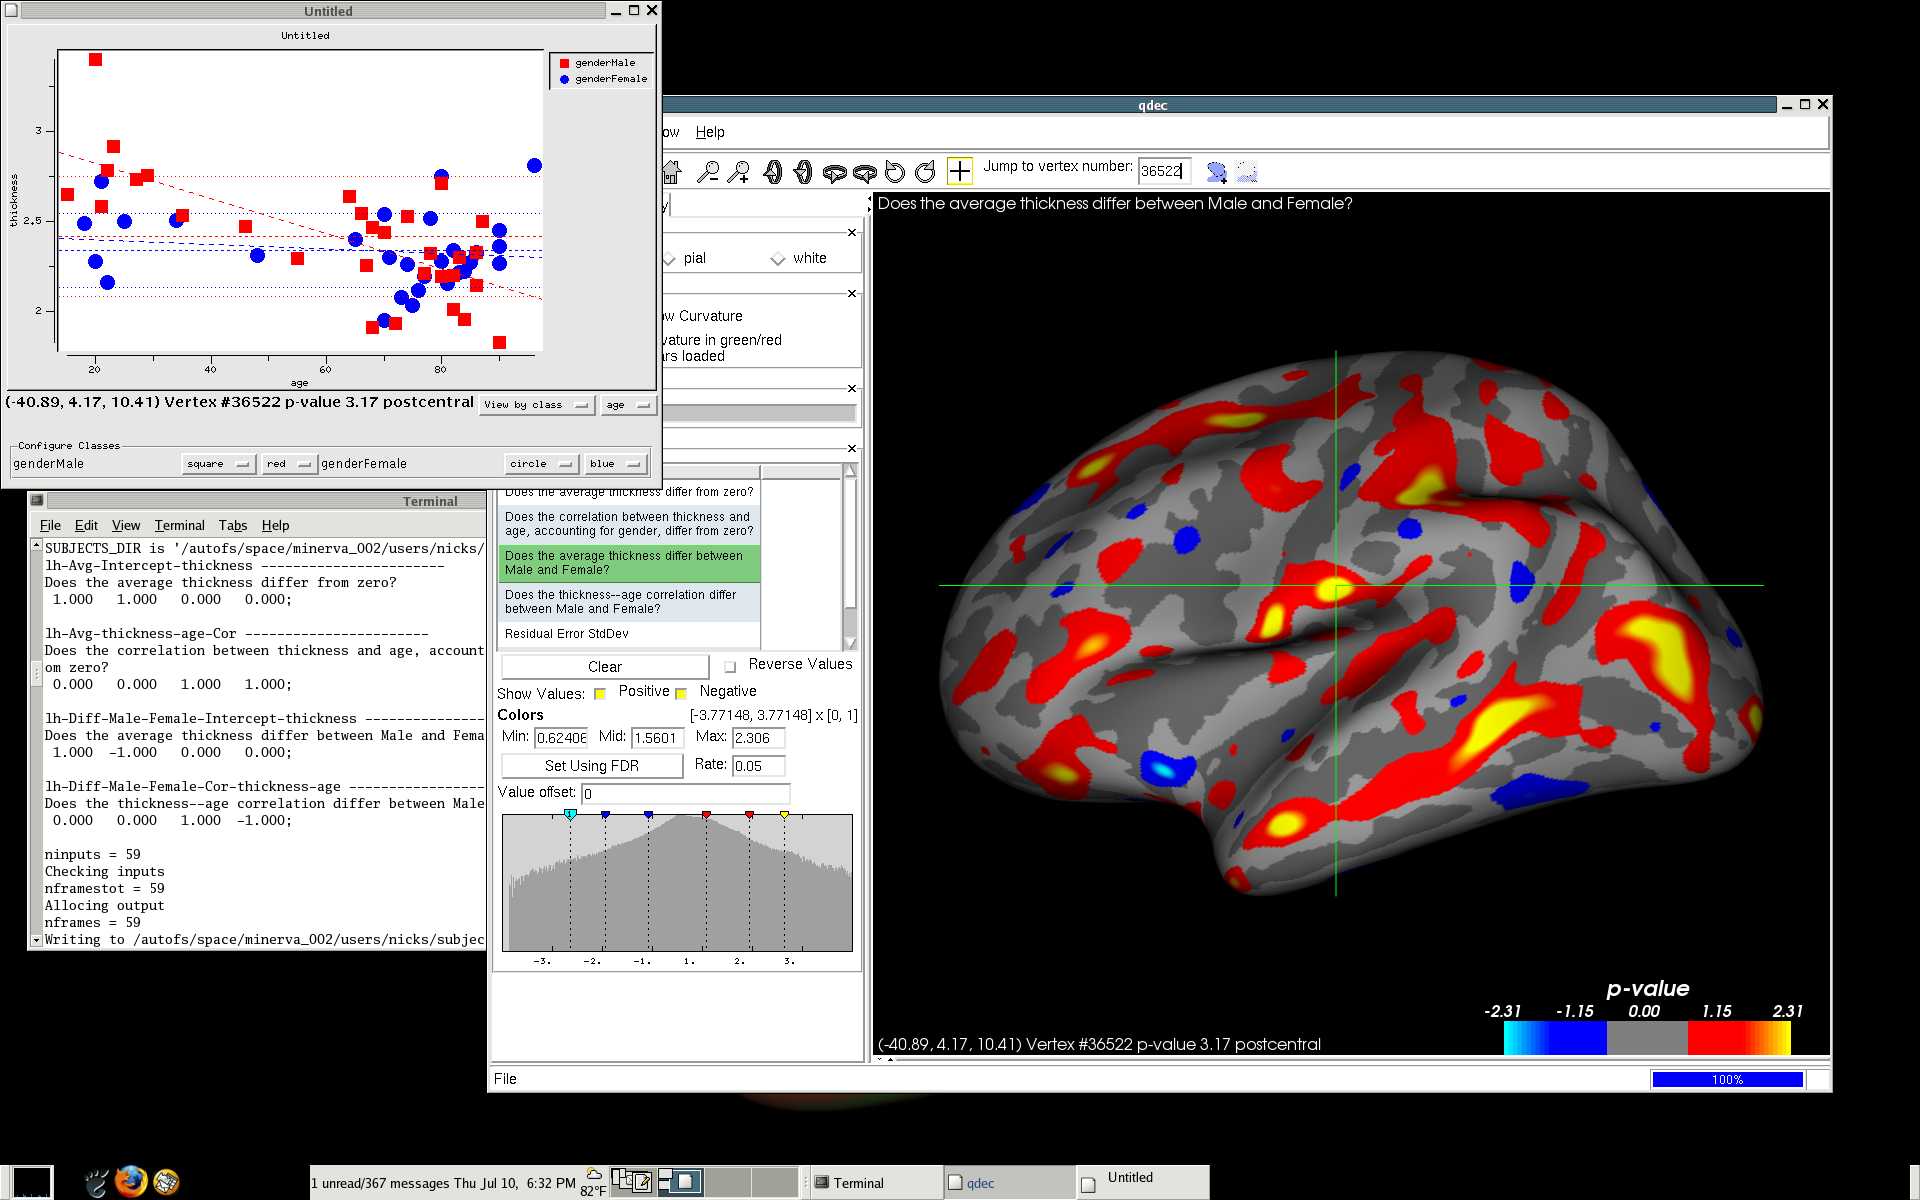
The first picture, qdec1, shows 'Does the average thickness differ between Male and Female?'. It also shows a plot for a positively significant vertex. The contrast is [1 -1 0 0], which means it is comparing the intercept between Male and Female. Notice in the plot that the y-intercept for genderMale is much higher (2.9mm) than genderFemale (2.4mm). That is why that vertex is yellow (high significance showing Males having thicker cortex than female). Now whether you feel that is a valid interpretation is another matter. This is a linear model, and so this model also implies that at age 0 (birth), Males have thicker cortex than Female, which doesnt make sense, but thats what the linear model implies, but is something clearly not true. Doug Greve suggests that an exponential fit might be more appropriate, it is something we are looking at.
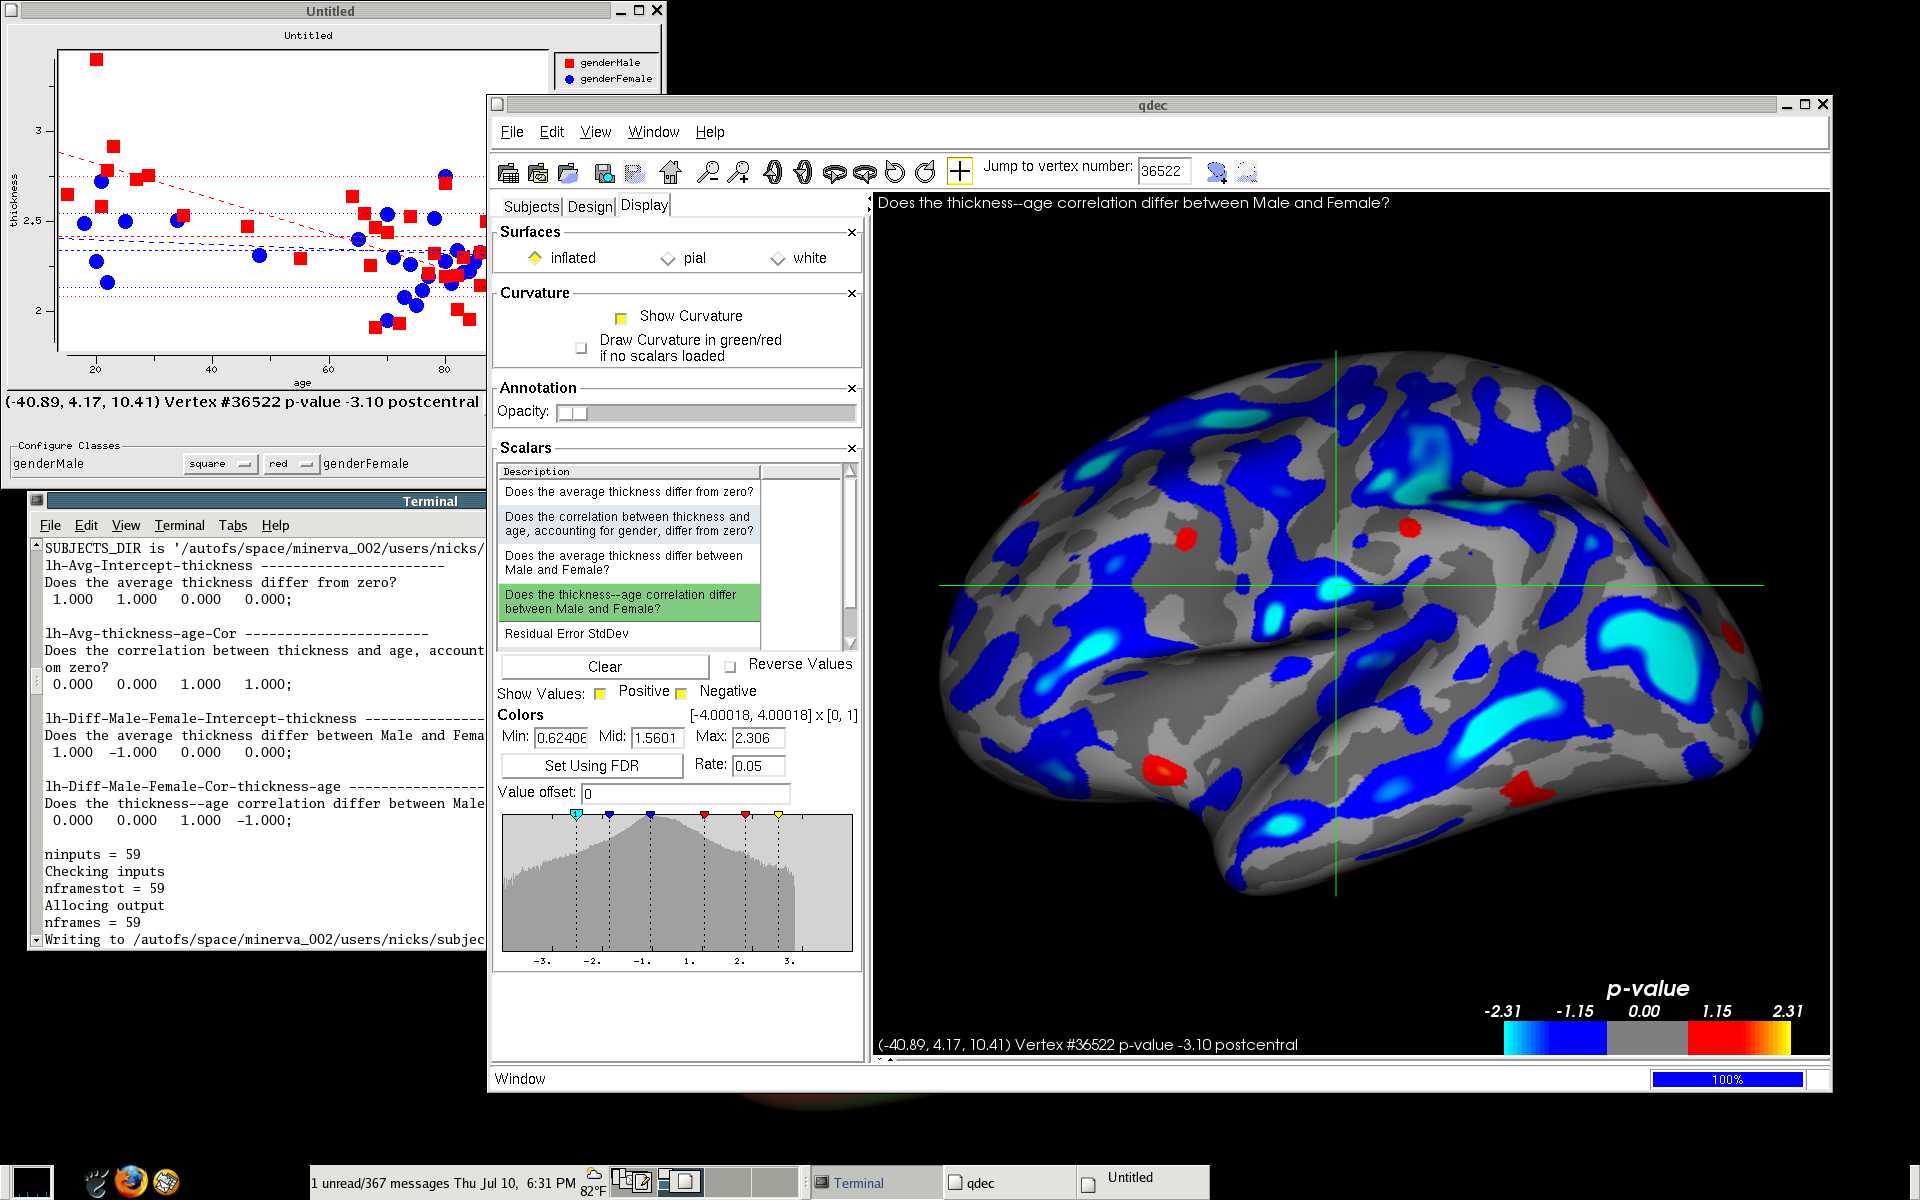
Now in the second picture, qdec2, which shows 'Does the thickness--age correlation differ between Male and Female?'. The plot shown is for the same vertex as the other (qdec1) contrast. But this uses contrast [0 0 1 -1], which compares the slope of genderMale to genderFemale. Looking at the plot, clearly the genderMale slope is 'thinning' (sloping downward) far more than the genderFemale slope, which is why the vertex appears as blue.
Roughly the same areas are shown in each contrast because the underlying data is the same: that shown in the plot: thickness and age, so it make sense that Contrasts will look similar in these two cases. They do not have identical p-values at each vertex though. You can see this by adjusting the thresholds (and looking at the histograms).
Hope this helps,
Nick
On Thu, 2008-07-10 at 10:31 +0800, zheng.hui@singhealth.com.sg wrote:
Hi all and hi Nick,
I would like to seek for some advice in interpreting the result from Qdec (btw, it is a very helpful tool for thickness analysis). Let me describe the problem here. Let's say we are interested in the relationship of thickness with two variables, age and gender, one is continuous variable and one is categorical. Qdec will produce maps for 4 contrasts. We have no question about the first two contrasts. What we don't understand are the contrast of [1 -1 0 0] and [0 0 1 -1]. They always will give very similar pattern, but one is the opposite sign of the other (refer to attachments, this can be seen clearly in the histogram). This happened to other variables. With one more continuous variable involved in the model, say IQ. The maps given by contrast [1 -1 0 0 0 0] and [0 0 1 -1 0 0] will be similar.
Can some one expert in stats or Qdec share some lights in interpreting this? Thanks.
Regards, Zheng Hui
Freesurfer mailing list Freesurfer@nmr.mgh.harvard.edu https://mail.nmr.mgh.harvard.edu/mailman/listinfo/freesurfer