
Hi everybody,
I am new user of Freesurfer,I simply take five procedures to process my data ,after I read the wiki on the website. The five procedures including:
1. mri_convert one-dicom-file-from-series blobby.nii.gz
2.recon-all -i blobby.nii.gz -subjid blobby –all
3.recon-all -s <subjid> -qcache
4.make_average_subject.
5.qdec
Now, my questions are:
1.In our e-mail ,you often talk about recon-all, why did I never across question about it ?
2. I tried to run the qdec-tool, but experienced some problems . I got different thickness in one area. In detail: 1. When I open theqdec.table.dat ,the thickness is different from the thickness got from the display in Find Clusters and Goto Max, I really do not know why? 2. Did I get the same results from two differentqdec.table.dat , one qdec.table.dat has 34 Continuous Variables but the other had only one Continuous Variable ?
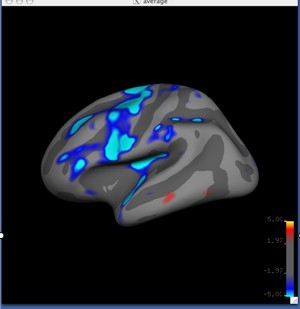
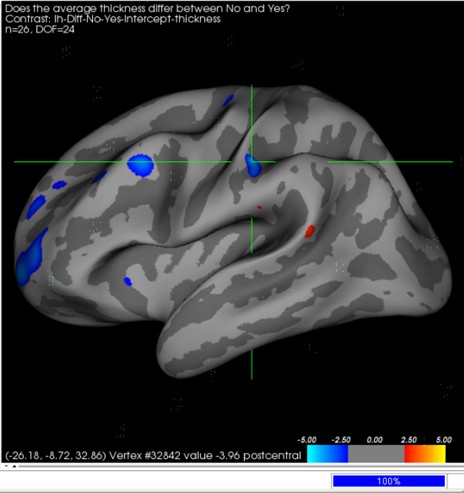
3.Why did the display from qdec smaller than the examples in the wiki on the website?
Such as the pictures follow.
I guess part of my problem is that I'm having trouble understanding exactly how to use the freesurfer. Can you try to give me a sort of layman's explanation?
Thanks for your answer!
wang

the procedure you followed is correct, although in general you dont need to run make_average_subject, as the default target subject 'fsaverage' is fine for most studies. add -target <youraveragesubj> after -qcache if you did create your own target.
per your questions, 2.2, assuming you imported the group subject stats into your qdec.table.dat, those thickness are the raw average thicknesses of a region, prior to an analysis. the thicknesses you see in the Display pertain to the analysis conducted during qdec per your factor selection. 2.3 the qdec.table.dat stores the data pertaining to a group of subjects and only enters into an analysis when particular factors (continuous or discrete vars) are selected, so the number of vars stored in qdec.table.dat does not affect the analysis, only their availability for selection as a factor to conduct an analysis. 3. the wiki examples pertain to an analysis of the 40 subjects found in the tutorial data. your data appears to be different.
see also: http://surfer.nmr.mgh.harvard.edu/fswiki/FsTutorial
n.
On Wed, 2011-02-23 at 10:12 +0800, 汪贵宏 wrote:
Hi everybody,
I am new user of Freesurfer,I simply take five procedures toprocess my data ,after I read the wiki on the website. The five procedures including:
- mri_convert one-dicom-file-from-series blobby.nii.gz
2.recon-all -i blobby.nii.gz -subjid blobby –all
3.recon-all -s <subjid> -qcache
4.make_average_subject.
5.qdec
Now, my questions are:
1.In our e-mail ,you often talk about recon-all, why did I never across question about it ?
- I tried to run the qdec-tool, but experienced some problems . I got
different thickness in one area. In detail: 1. When I open the qdec.table.dat ,the thickness is different from the thickness got from the display in Find Clusters and Goto Max, I really do not know why? 2. Did I get the same results from two different qdec.table.dat , one qdec.table.dat has 34 Continuous Variables but the other had only one Continuous Variable ?
3.Why did the display from qdec smaller than the examples in thewiki on the website?
Such as the pictures follow.
I guess part of my problem is that I'm having trouble understanding exactly how to use the freesurfer. Can you try to give me a sort of layman's explanation?
Thanks for your answer!
wang
Freesurfer mailing list Freesurfer@nmr.mgh.harvard.edu https://mail.nmr.mgh.harvard.edu/mailman/listinfo/freesurfer
freesurfer@nmr.mgh.harvard.edu
-
 Nick Schmansky
 -
 汪贵宏
汪贵宏