
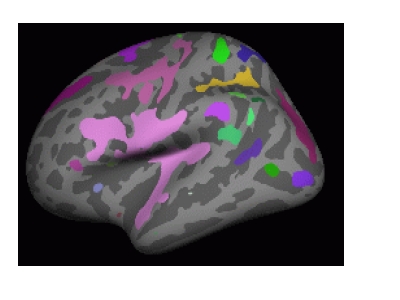
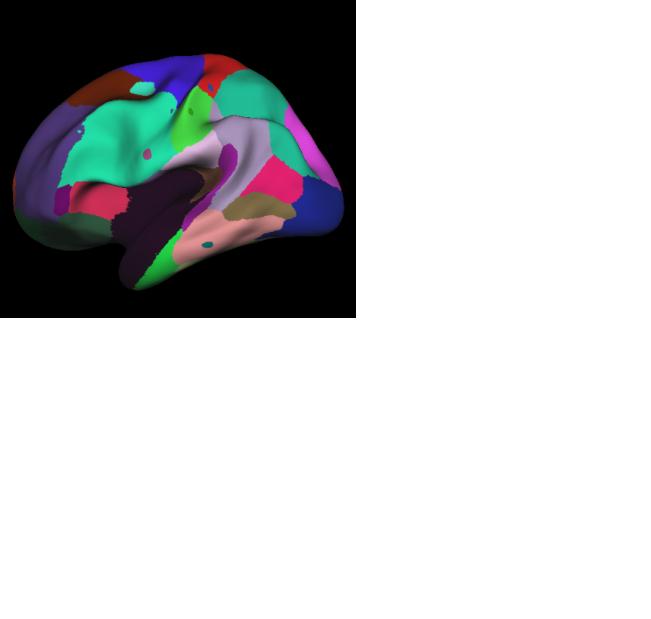
Hi Freesurfers, More questions about this analysis. 1) Referring to the documentation, we used the following command: tksurfer fsaverage lh inflated -annot mc-z.abs.2.sig.ocn.annot -fthresh 2 -curv -gray
    The documentation says we should see an image as shown in
    Figure 1 (attached).  But what we see is Figure 2 (also
    attached).  Can somebody explain this?

    2) When running the simulation does it matter what threshold
    we use?  For example, can we use a threshold of 2 or 3
    (instead of 4 as shown in documentation) when running
    mri_glmfit-sim?  And do we have to use the same threshold
    while displaying the clusters after?

    Thanks for any help.

    Devdutta
Forgot the attachments earlier. Here they are now
On Tue, Mar 3, 2009 at 5:11 PM, Devdutta W devdutta.w@gmail.com wrote:
Hi Freesurfers, More questions about this analysis.
- Referring to the documentation, we used the following command:
tksurfer fsaverage lh inflated -annot mc-z.abs.2.sig.ocn.annot -fthresh 2 -curv -gray
The documentation says we should see an image as shown in Figure 1 (attached). But what we see is Figure 2 (also attached). Can somebody explain this?
- When running the simulation does it matter what threshold we use? For
example, can we use a threshold of 2 or 3 (instead of 4 as shown in documentation) when running mri_glmfit-sim? And do we have to use the same threshold while displaying the clusters after?
Thanks for any help.
Devdutta

What is displayed if you turn off the annotation display?
The threshold in the simulation is used to determine whether clusters are found or not. A threshold of 2 indicates a p-value of 0.01 (1/(10^2), 3 is 0.001, etc. The threshold referred to in the tksurfer display is just for color thresholding.
Nick
On Tue, 2009-03-03 at 17:17 -0600, Devdutta W wrote:
Forgot the attachments earlier. Here they are now
On Tue, Mar 3, 2009 at 5:11 PM, Devdutta W devdutta.w@gmail.com wrote: Hi Freesurfers, More questions about this analysis. 1) Referring to the documentation, we used the following command: tksurfer fsaverage lh inflated -annot mc- z.abs.2.sig.ocn.annot -fthresh 2 -curv -gray
    The documentation says we should see an image as shown in
    Figure 1 (attached).  But what we see is Figure 2 (also
    attached).  Can somebody explain this?

    2) When running the simulation does it matter what threshold
    we use?  For example, can we use a threshold of 2 or 3
    (instead of 4 as shown in documentation) when running
    mri_glmfit-sim?  And do we have to use the same threshold
    while displaying the clusters after?

    Thanks for any help.

    Devdutta
Freesurfer mailing list Freesurfer@nmr.mgh.harvard.edu https://mail.nmr.mgh.harvard.edu/mailman/listinfo/freesurfer
Nick, I confess, I am not exactly sure what you mean by "turn off annotation display". I tried a few things.
- If I don't include the -annot option in tksurfer it only displays the fsaverage, naturally.
- If I toggle off the button that says "show labels", it looks like it is just the fsaverage as well.
- If I toggle on the "Draw outlined labels" button it shows the same regions as before except they are merely outlined, not filled.
These were the only ones that I could think of. Is that what you meant or was it something else that I missed?
Thanks, Devdutta
On Tue, Mar 3, 2009 at 7:12 PM, Nick Schmansky nicks@nmr.mgh.harvard.eduwrote:
What is displayed if you turn off the annotation display?
The threshold in the simulation is used to determine whether clusters are found or not. A threshold of 2 indicates a p-value of 0.01 (1/(10^2), 3 is 0.001, etc. The threshold referred to in the tksurfer display is just for color thresholding.
Nick
On Tue, 2009-03-03 at 17:17 -0600, Devdutta W wrote:
Forgot the attachments earlier. Here they are now
On Tue, Mar 3, 2009 at 5:11 PM, Devdutta W devdutta.w@gmail.com wrote: Hi Freesurfers, More questions about this analysis. 1) Referring to the documentation, we used the following command: tksurfer fsaverage lh inflated -annot mc- z.abs.2.sig.ocn.annot -fthresh 2 -curv -gray
    The documentation says we should see an image as shown in
    Figure 1 (attached).  But what we see is Figure 2 (also
    attached).  Can somebody explain this?

    2) When running the simulation does it matter what threshold
    we use?  For example, can we use a threshold of 2 or 3
    (instead of 4 as shown in documentation) when running
    mri_glmfit-sim?  And do we have to use the same threshold
    while displaying the clusters after?

    Thanks for any help.

    Devdutta
Freesurfer mailing list Freesurfer@nmr.mgh.harvard.edu https://mail.nmr.mgh.harvard.edu/mailman/listinfo/freesurfer
Hi Nick, Can you shed some light on why this might be happening? I will attach the two picture again in case you weren't able to view them last time. I tried what I thought you meant by "turn off annotation display" and I have stated what happened in my previous email (please see below)
- *If I don't include the -annot option in tksurfer it only displays the fsaverage, naturally. *
- *If I toggle off the button that says "show labels", it looks like it is just the fsaverage as well. *
- *If I toggle on the "Draw outlined labels" button it shows the same regions as before except they are merely outlined, not filled. *
Any help you can give me will be appreciated.
Thanks, Devdutta
On Wed, Mar 4, 2009 at 10:36 AM, Devdutta W devdutta.w@gmail.com wrote:
Nick, I confess, I am not exactly sure what you mean by "turn off annotation display". I tried a few things.
- If I don't include the -annot option in tksurfer it only displays the
fsaverage, naturally.
- If I toggle off the button that says "show labels", it looks like it
is just the fsaverage as well.
- If I toggle on the "Draw outlined labels" button it shows the same
regions as before except they are merely outlined, not filled.
These were the only ones that I could think of. Is that what you meant or was it something else that I missed?
Thanks, Devdutta
On Tue, Mar 3, 2009 at 7:12 PM, Nick Schmansky nicks@nmr.mgh.harvard.eduwrote:
What is displayed if you turn off the annotation display?
The threshold in the simulation is used to determine whether clusters are found or not. A threshold of 2 indicates a p-value of 0.01 (1/(10^2), 3 is 0.001, etc. The threshold referred to in the tksurfer display is just for color thresholding.
Nick
On Tue, 2009-03-03 at 17:17 -0600, Devdutta W wrote:
Forgot the attachments earlier. Here they are now
On Tue, Mar 3, 2009 at 5:11 PM, Devdutta W devdutta.w@gmail.com wrote: Hi Freesurfers, More questions about this analysis. 1) Referring to the documentation, we used the following command: tksurfer fsaverage lh inflated -annot mc- z.abs.2.sig.ocn.annot -fthresh 2 -curv -gray
    The documentation says we should see an image as shown in
    Figure 1 (attached).  But what we see is Figure 2 (also
    attached).  Can somebody explain this?

    2) When running the simulation does it matter what threshold
    we use?  For example, can we use a threshold of 2 or 3
    (instead of 4 as shown in documentation) when running
    mri_glmfit-sim?  And do we have to use the same threshold
    while displaying the clusters after?

    Thanks for any help.

    Devdutta
Freesurfer mailing list Freesurfer@nmr.mgh.harvard.edu https://mail.nmr.mgh.harvard.edu/mailman/listinfo/freesurfer
Forgot to attach the images, again.
On Mon, Mar 9, 2009 at 11:20 AM, Devdutta W devdutta.w@gmail.com wrote:
Hi Nick, Can you shed some light on why this might be happening? I will attach the two picture again in case you weren't able to view them last time. I tried what I thought you meant by "turn off annotation display" and I have stated what happened in my previous email (please see below)
- *If I don't include the -annot option in tksurfer it only displays
the fsaverage, naturally. *
- *If I toggle off the button that says "show labels", it looks like it
is just the fsaverage as well. *
- *If I toggle on the "Draw outlined labels" button it shows the same
regions as before except they are merely outlined, not filled. *
Any help you can give me will be appreciated.
Thanks, Devdutta
On Wed, Mar 4, 2009 at 10:36 AM, Devdutta W devdutta.w@gmail.com wrote:
Nick, I confess, I am not exactly sure what you mean by "turn off annotation display". I tried a few things.
- If I don't include the -annot option in tksurfer it only displays
the fsaverage, naturally.
- If I toggle off the button that says "show labels", it looks like it
is just the fsaverage as well.
- If I toggle on the "Draw outlined labels" button it shows the same
regions as before except they are merely outlined, not filled.
These were the only ones that I could think of. Is that what you meant or was it something else that I missed?
Thanks, Devdutta
On Tue, Mar 3, 2009 at 7:12 PM, Nick Schmansky <nicks@nmr.mgh.harvard.edu
wrote:
What is displayed if you turn off the annotation display?
The threshold in the simulation is used to determine whether clusters are found or not. A threshold of 2 indicates a p-value of 0.01 (1/(10^2), 3 is 0.001, etc. The threshold referred to in the tksurfer display is just for color thresholding.
Nick
On Tue, 2009-03-03 at 17:17 -0600, Devdutta W wrote:
Forgot the attachments earlier. Here they are now
On Tue, Mar 3, 2009 at 5:11 PM, Devdutta W devdutta.w@gmail.com wrote: Hi Freesurfers, More questions about this analysis. 1) Referring to the documentation, we used the following command: tksurfer fsaverage lh inflated -annot mc- z.abs.2.sig.ocn.annot -fthresh 2 -curv -gray
The documentation says we should see an image as shown in Figure 1 (attached). But what we see is Figure 2 (also attached). Can somebody explain this? 2) When running the simulation does it matter what threshold we use? For example, can we use a threshold of 2 or 3 (instead of 4 as shown in documentation) when running mri_glmfit-sim? And do we have to use the same threshold while displaying the clusters after? Thanks for any help. Devdutta
Freesurfer mailing list Freesurfer@nmr.mgh.harvard.edu https://mail.nmr.mgh.harvard.edu/mailman/listinfo/freesurfer
Devdutta,
What version of freesurfer is being used? The fsaverage subject you show doesnt look right. Also, I see what appear to be clusters mixed in with the annotations. The summary files output by the multiple correction step will tell you how many and the size of the clusters. You should be able to toggle on-off both the annotation and the overlay independently.
I am cc'ing Sita, as she may be able to help you on this (I will have limited email contact this week).
Nick
On Mon, 2009-03-09 at 11:21 -0500, Devdutta W wrote:
Forgot to attach the images, again.
On Mon, Mar 9, 2009 at 11:20 AM, Devdutta W devdutta.w@gmail.com wrote: Hi Nick, Can you shed some light on why this might be happening? I will attach the two picture again in case you weren't able to view them last time. I tried what I thought you meant by "turn off annotation display" and I have stated what happened in my previous email (please see below)
          * If I don't include the -annot option in tksurfer it
            only displays the fsaverage, naturally.
          * If I toggle off the button that says "show labels", it
            looks like it is just the fsaverage as well.
          * If I toggle on the "Draw outlined labels" button it
            shows the same regions as before except they are
            merely outlined, not filled.
    Any help you can give me will be appreciated.

    Thanks,
    Devdutta


    On Wed, Mar 4, 2009 at 10:36 AM, Devdutta W
    <devdutta.w@gmail.com> wrote:
            Nick,
            I confess, I am not exactly sure what you mean by
            "turn off annotation display".  I tried a few
            things.

                  * If I don't include the -annot option in
                    tksurfer it only displays the fsaverage,
                    naturally.
                  * If I toggle off the button that says "show
                    labels", it looks like it is just the
                    fsaverage as well.
                  * If I toggle on the "Draw outlined labels"
                    button it shows the same regions as before
                    except they are merely outlined, not filled.
            These were the only ones that I could think of.  Is
            that what you meant or was it something else that I
            missed?

            Thanks,
            Devdutta


            On Tue, Mar 3, 2009 at 7:12 PM, Nick Schmansky
            <nicks@nmr.mgh.harvard.edu> wrote:
                    What is displayed if you turn off the
                    annotation display?

                    The threshold in the simulation is used to
                    determine whether clusters
                    are found or not.  A threshold of 2 indicates
                    a p-value of 0.01
                    (1/(10^2), 3 is 0.001, etc.  The threshold
                    referred to in the tksurfer
                    display is just for color thresholding.

                    Nick


                    On Tue, 2009-03-03 at 17:17 -0600, Devdutta W
                    wrote:
                    > Forgot the attachments earlier.  Here they
                    are now
                    >
                    > On Tue, Mar 3, 2009 at 5:11 PM, Devdutta W
                    <devdutta.w@gmail.com>
                    > wrote:
                    >         Hi Freesurfers,
                    >         More questions about this analysis.
                    >         1) Referring to the documentation,
                    we used the following
                    >         command:
                    >          tksurfer fsaverage lh inflated -
                    annot mc-
                    >         z.abs.2.sig.ocn.annot -fthresh 2 -
                    curv -gray
                    >
                    >         The documentation says we should see
                    an image as shown in
                    >         Figure 1 (attached).  But what we
                    see is Figure 2 (also
                    >         attached).  Can somebody explain
                    this?
                    >
                    >         2) When running the simulation does
                    it matter what threshold
                    >         we use?  For example, can we use a
                    threshold of 2 or 3
                    >         (instead of 4 as shown in
                    documentation) when running
                    >         mri_glmfit-sim?  And do we have to
                    use the same threshold
                    >         while displaying the clusters after?
                    >
                    >         Thanks for any help.
                    >
                    >         Devdutta
                    >

                    >
                    _______________________________________________
                    > Freesurfer mailing list
                    > Freesurfer@nmr.mgh.harvard.edu
                    >
                    https://mail.nmr.mgh.harvard.edu/mailman/listinfo/freesurfer
Nick, Sita, The average subject is created from our data, perhaps that's why it looks different. We were having problems getting freesurfer to recognize our average subject. So we linked fsaverage to our average subject. I didn't see a button (or a tool) to toggle on-off the annotation. The overlay button is there but toggling it doesn't do anything.
There indeed are clusters mixed in with the annotations. But from the documenation, it seems that the command we are using is *supposed* to show clusters (but only the clusters, not the the annotations). And that is the question I am trying to get answered.
Here is the command we are using:
*tksurfer fsaverage lh inflated -annot mc-z.abs.2.sig.ocn.annot -fthresh 2 -curv -gray*
I am running this command from the appropriate folder and fsaverage is linked to our average subject. We are using the following documentation: https://surfer.nmr.mgh.harvard.edu/fswiki/FsTutorial/GroupAnalysis?highlight... _glmfit-sim)
Thanks, Devdutta
On Mon, Mar 9, 2009 at 12:09 PM, Nick Schmansky nicks@nmr.mgh.harvard.eduwrote:
Devdutta,
What version of freesurfer is being used? The fsaverage subject you show doesnt look right. Also, I see what appear to be clusters mixed in with the annotations. The summary files output by the multiple correction step will tell you how many and the size of the clusters. You should be able to toggle on-off both the annotation and the overlay independently.
I am cc'ing Sita, as she may be able to help you on this (I will have limited email contact this week).
Nick
On Mon, 2009-03-09 at 11:21 -0500, Devdutta W wrote:
Forgot to attach the images, again.
On Mon, Mar 9, 2009 at 11:20 AM, Devdutta W devdutta.w@gmail.com wrote: Hi Nick, Can you shed some light on why this might be happening? I will attach the two picture again in case you weren't able to view them last time. I tried what I thought you meant by "turn off annotation display" and I have stated what happened in my previous email (please see below)
          * If I don't include the -annot option in tksurfer it
            only displays the fsaverage, naturally.
          * If I toggle off the button that says "show labels", it
            looks like it is just the fsaverage as well.
          * If I toggle on the "Draw outlined labels" button it
            shows the same regions as before except they are
            merely outlined, not filled.
    Any help you can give me will be appreciated.

    Thanks,
    Devdutta


    On Wed, Mar 4, 2009 at 10:36 AM, Devdutta W
    <devdutta.w@gmail.com> wrote:
            Nick,
            I confess, I am not exactly sure what you mean by
            "turn off annotation display".  I tried a few
            things.

                  * If I don't include the -annot option in
                    tksurfer it only displays the fsaverage,
                    naturally.
                  * If I toggle off the button that says "show
                    labels", it looks like it is just the
                    fsaverage as well.
                  * If I toggle on the "Draw outlined labels"
                    button it shows the same regions as before
                    except they are merely outlined, not filled.
            These were the only ones that I could think of.  Is
            that what you meant or was it something else that I
            missed?

            Thanks,
            Devdutta


            On Tue, Mar 3, 2009 at 7:12 PM, Nick Schmansky
            <nicks@nmr.mgh.harvard.edu> wrote:
                    What is displayed if you turn off the
                    annotation display?

                    The threshold in the simulation is used to
                    determine whether clusters
                    are found or not.  A threshold of 2 indicates
                    a p-value of 0.01
                    (1/(10^2), 3 is 0.001, etc.  The threshold
                    referred to in the tksurfer
                    display is just for color thresholding.

                    Nick


                    On Tue, 2009-03-03 at 17:17 -0600, Devdutta W
                    wrote:
                    > Forgot the attachments earlier.  Here they
                    are now
                    >
                    > On Tue, Mar 3, 2009 at 5:11 PM, Devdutta W
                    <devdutta.w@gmail.com>
                    > wrote:
                    >         Hi Freesurfers,
                    >         More questions about this analysis.
                    >         1) Referring to the documentation,
                    we used the following
                    >         command:
                    >          tksurfer fsaverage lh inflated -
                    annot mc-
                    >         z.abs.2.sig.ocn.annot -fthresh 2 -
                    curv -gray
                    >
                    >         The documentation says we should see
                    an image as shown in
                    >         Figure 1 (attached).  But what we
                    see is Figure 2 (also
                    >         attached).  Can somebody explain
                    this?
                    >
                    >         2) When running the simulation does
                    it matter what threshold
                    >         we use?  For example, can we use a
                    threshold of 2 or 3
                    >         (instead of 4 as shown in
                    documentation) when running
                    >         mri_glmfit-sim?  And do we have to
                    use the same threshold
                    >         while displaying the clusters after?
                    >
                    >         Thanks for any help.
                    >
                    >         Devdutta
                    >

                    >
                    _______________________________________________
                    > Freesurfer mailing list
                    > Freesurfer@nmr.mgh.harvard.edu
                    >
https://mail.nmr.mgh.harvard.edu/mailman/listinfo/freesurfer

/what does it look like when you load mc-z.abs.2.sig.cluster.mgh as an overlay?/
Devdutta W wrote:
Nick, Sita, The average subject is created from our data, perhaps that's why it looks different. We were having problems getting freesurfer to recognize our average subject. So we linked fsaverage to our average subject. I didn't see a button (or a tool) to toggle on-off the annotation. The overlay button is there but toggling it doesn't do anything.
There indeed are clusters mixed in with the annotations. But from the documenation, it seems that the command we are using is /supposed/ to show clusters (but only the clusters, not the the annotations). And that is the question I am trying to get answered.
Here is the command we are using: /tksurfer fsaverage lh inflated -annot mc-z.abs.2.sig.ocn.annot -fthresh 2 -curv -gray/ I am running this command from the appropriate folder and fsaverage is linked to our average subject. We are using the following documentation: https://surfer.nmr.mgh.harvard.edu/fswiki/FsTutorial/GroupAnalysis?highlight... https://surfer.nmr.mgh.harvard.edu/fswiki/FsTutorial/GroupAnalysis?highlight=%28mri_glmfit-sim)
Thanks, Devdutta
On Mon, Mar 9, 2009 at 12:09 PM, Nick Schmansky <nicks@nmr.mgh.harvard.edu mailto:nicks@nmr.mgh.harvard.edu> wrote:
Devdutta,

What version of freesurfer is being used?  The fsaverage subject you
show doesnt look right.  Also, I see what appear to be clusters
mixed in
with the annotations.  The summary files output by the multiple
correction step will tell you how many and the size of the clusters.
You should be able to toggle on-off both the annotation and the
overlay
independently.

I am cc'ing Sita, as she may be able to help you on this (I will have
limited email contact this week).

Nick


On Mon, 2009-03-09 at 11:21 -0500, Devdutta W wrote:
> Forgot to attach the images, again.
>
>
> On Mon, Mar 9, 2009 at 11:20 AM, Devdutta W
<devdutta.w@gmail.com <mailto:devdutta.w@gmail.com>>
> wrote:
>         Hi Nick,
>         Can you shed some light on why this might be happening?  I
>         will attach the two picture again in case you weren't
able to
>         view them last time.  I tried what I thought you meant by
>         "turn off annotation display" and I have stated what
happened
>         in my previous email (please see below)
>
>               * If I don't include the -annot option in tksurfer it
>                 only displays the fsaverage, naturally.
>               * If I toggle off the button that says "show
labels", it
>                 looks like it is just the fsaverage as well.
>               * If I toggle on the "Draw outlined labels" button it
>                 shows the same regions as before except they are
>                 merely outlined, not filled.
>         Any help you can give me will be appreciated.
>
>         Thanks,
>         Devdutta
>
>
>         On Wed, Mar 4, 2009 at 10:36 AM, Devdutta W
>         <devdutta.w@gmail.com <mailto:devdutta.w@gmail.com>> wrote:
>                 Nick,
>                 I confess, I am not exactly sure what you mean by
>                 "turn off annotation display".  I tried a few
>                 things.
>
>                       * If I don't include the -annot option in
>                         tksurfer it only displays the fsaverage,
>                         naturally.
>                       * If I toggle off the button that says "show
>                         labels", it looks like it is just the
>                         fsaverage as well.
>                       * If I toggle on the "Draw outlined labels"
>                         button it shows the same regions as before
>                         except they are merely outlined, not filled.
>                 These were the only ones that I could think of.  Is
>                 that what you meant or was it something else that I
>                 missed?
>
>                 Thanks,
>                 Devdutta
>
>
>                 On Tue, Mar 3, 2009 at 7:12 PM, Nick Schmansky
>                 <nicks@nmr.mgh.harvard.edu
<mailto:nicks@nmr.mgh.harvard.edu>> wrote:
>                         What is displayed if you turn off the
>                         annotation display?
>
>                         The threshold in the simulation is used to
>                         determine whether clusters
>                         are found or not.  A threshold of 2
indicates
>                         a p-value of 0.01
>                         (1/(10^2), 3 is 0.001, etc.  The threshold
>                         referred to in the tksurfer
>                         display is just for color thresholding.
>
>                         Nick
>
>
>                         On Tue, 2009-03-03 at 17:17 -0600,
Devdutta W
>                         wrote:
>                         > Forgot the attachments earlier.  Here they
>                         are now
>                         >
>                         > On Tue, Mar 3, 2009 at 5:11 PM, Devdutta W
>                         <devdutta.w@gmail.com
<mailto:devdutta.w@gmail.com>>
>                         > wrote:
>                         >         Hi Freesurfers,
>                         >         More questions about this
analysis.
>                         >         1) Referring to the documentation,
>                         we used the following
>                         >         command:
>                         >          tksurfer fsaverage lh inflated -
>                         annot mc-
>                         >         z.abs.2.sig.ocn.annot -fthresh 2 -
>                         curv -gray
>                         >
>                         >         The documentation says we
should see
>                         an image as shown in
>                         >         Figure 1 (attached).  But what we
>                         see is Figure 2 (also
>                         >         attached).  Can somebody explain
>                         this?
>                         >
>                         >         2) When running the simulation
does
>                         it matter what threshold
>                         >         we use?  For example, can we use a
>                         threshold of 2 or 3
>                         >         (instead of 4 as shown in
>                         documentation) when running
>                         >         mri_glmfit-sim?  And do we have to
>                         use the same threshold
>                         >         while displaying the clusters
after?
>                         >
>                         >         Thanks for any help.
>                         >
>                         >         Devdutta
>                         >
>
>                         >
>
_______________________________________________
>                         > Freesurfer mailing list
>                         > Freesurfer@nmr.mgh.harvard.edu
<mailto:Freesurfer@nmr.mgh.harvard.edu>
>                         >
>
https://mail.nmr.mgh.harvard.edu/mailman/listinfo/freesurfer
>
>
>
>
>
>
Freesurfer mailing list Freesurfer@nmr.mgh.harvard.edu https://mail.nmr.mgh.harvard.edu/mailman/listinfo/freesurfer
When I load mc-z.abs.2.sig.cluster.mgh, if the "Draw filled labels" button is toggled on, it looks no different from before. Toggling the "show overlay" button doesn't do anything. If the "Draw Outlined labels" button is toggled on, the outlines of the colored regions can be seen (including the outlines of the clusters). This time, toggling the overlay button on-off shows the clusters.
On Mon, Mar 9, 2009 at 2:12 PM, Douglas N Greve greve@nmr.mgh.harvard.eduwrote:
/what does it look like when you load mc-z.abs.2.sig.cluster.mgh as an overlay?/
Devdutta W wrote:
Nick, Sita, The average subject is created from our data, perhaps that's why it looks different. We were having problems getting freesurfer to recognize our average subject. So we linked fsaverage to our average subject. I didn't see a button (or a tool) to toggle on-off the annotation. The overlay button is there but toggling it doesn't do anything. There indeed are clusters mixed in with the annotations. But from the documenation, it seems that the command we are using is /supposed/ to show clusters (but only the clusters, not the the annotations). And that is the question I am trying to get answered.
Here is the command we are using: /tksurfer fsaverage lh inflated -annot mc-z.abs.2.sig.ocn.annot -fthresh 2 -curv -gray/ I am running this command from the appropriate folder and fsaverage is linked to our average subject. We are using the following documentation: https://surfer.nmr.mgh.harvard.edu/fswiki/FsTutorial/GroupAnalysis?highlight...https://surfer.nmr.mgh.harvard.edu/fswiki/FsTutorial/GroupAnalysis?highlight=%28mri< https://surfer.nmr.mgh.harvard.edu/fswiki/FsTutorial/GroupAnalysis?highlight...
_glmfit-sim)
Thanks, Devdutta
On Mon, Mar 9, 2009 at 12:09 PM, Nick Schmansky < nicks@nmr.mgh.harvard.edu mailto:nicks@nmr.mgh.harvard.edu> wrote:
Devdutta,
What version of freesurfer is being used? The fsaverage subject you show doesnt look right. Also, I see what appear to be clusters mixed in with the annotations. The summary files output by the multiple correction step will tell you how many and the size of the clusters. You should be able to toggle on-off both the annotation and the overlay independently.
I am cc'ing Sita, as she may be able to help you on this (I will have limited email contact this week).
Nick
On Mon, 2009-03-09 at 11:21 -0500, Devdutta W wrote:
Forgot to attach the images, again.
On Mon, Mar 9, 2009 at 11:20 AM, Devdutta W
<devdutta.w@gmail.com mailto:devdutta.w@gmail.com>
wrote: Hi Nick, Can you shed some light on why this might be happening? I will attach the two picture again in case you weren't
able to
    view them last time.  I tried what I thought you meant by
    "turn off annotation display" and I have stated what
happened
    in my previous email (please see below)

          * If I don't include the -annot option in tksurfer it
            only displays the fsaverage, naturally.
          * If I toggle off the button that says "show
labels", it
looks like it is just the fsaverage as well. * If I toggle on the "Draw outlined labels" button it shows the same regions as before except they are merely outlined, not filled. Any help you can give me will be appreciated. Thanks, Devdutta On Wed, Mar 4, 2009 at 10:36 AM, Devdutta W <devdutta.w@gmail.com <mailto:devdutta.w@gmail.com>> wrote: Nick, I confess, I am not exactly sure what you mean by "turn off annotation display". I tried a few things. * If I don't include the -annot option in tksurfer it only displays the fsaverage, naturally. * If I toggle off the button that says "show labels", it looks like it is just the fsaverage as well. * If I toggle on the "Draw outlined labels" button it shows the same regions as before except they are merely outlined, not filled. These were the only ones that I could think of. Is that what you meant or was it something else that I missed? Thanks, Devdutta On Tue, Mar 3, 2009 at 7:12 PM, Nick Schmansky <nicks@nmr.mgh.harvard.edumailto:nicks@nmr.mgh.harvard.edu> wrote:
                    What is displayed if you turn off the
                    annotation display?

                    The threshold in the simulation is used to
                    determine whether clusters
                    are found or not.  A threshold of 2
indicates
                    a p-value of 0.01
                    (1/(10^2), 3 is 0.001, etc.  The threshold
                    referred to in the tksurfer
                    display is just for color thresholding.

                    Nick


                    On Tue, 2009-03-03 at 17:17 -0600,
Devdutta W
wrote: > Forgot the attachments earlier. Here they are now > > On Tue, Mar 3, 2009 at 5:11 PM, Devdutta W <devdutta.w@gmail.com> wrote: > Hi Freesurfers, > More questions about thisanalysis.
                    >         1) Referring to the documentation,
                    we used the following
                    >         command:
                    >          tksurfer fsaverage lh inflated -
                    annot mc-
                    >         z.abs.2.sig.ocn.annot -fthresh 2 -
                    curv -gray
                    >
                    >         The documentation says we
should see
                    an image as shown in
                    >         Figure 1 (attached).  But what we
                    see is Figure 2 (also
                    >         attached).  Can somebody explain
                    this?
                    >
                    >         2) When running the simulation
does
                    it matter what threshold
                    >         we use?  For example, can we use a
                    threshold of 2 or 3
                    >         (instead of 4 as shown in
                    documentation) when running
                    >         mri_glmfit-sim?  And do we have to
                    use the same threshold
                    >         while displaying the clusters
after?
                    >
                    >         Thanks for any help.
                    >
                    >         Devdutta
                    >

                    >
                    > Freesurfer mailing list
                    > Freesurfer@nmr.mgh.harvard.edu
mailto:Freesurfer@nmr.mgh.harvard.edu
>https://mail.nmr.mgh.harvard.edu/mailman/listinfo/freesurfer
Freesurfer mailing list Freesurfer@nmr.mgh.harvard.edu https://mail.nmr.mgh.harvard.edu/mailman/listinfo/freesurfer
I think I've found the problem in that the original annotation at a vertex is not being cleared if a cluster is not there.
The short term fix is to delete " --annot aparc" from mri_glmfit-sim at line 353. I'll email when I have a longer term fix. What platform are you using?
doug
Devdutta W wrote:
When I load mc-z.abs.2.sig.cluster.mgh, if the "Draw filled labels" button is toggled on, it looks no different from before. Toggling the "show overlay" button doesn't do anything. If the "Draw Outlined labels" button is toggled on, the outlines of the colored regions can be seen (including the outlines of the clusters). This time, toggling the overlay button on-off shows the clusters.
On Mon, Mar 9, 2009 at 2:12 PM, Douglas N Greve <greve@nmr.mgh.harvard.edu mailto:greve@nmr.mgh.harvard.edu> wrote:
/what does it look like when you load mc-z.abs.2.sig.cluster.mgh
as an overlay?/


Devdutta W wrote:

    Nick, Sita,
    The average subject is created from our data, perhaps that's
    why it looks different.  We were having problems getting
    freesurfer to recognize our average subject.  So we linked
    fsaverage to our average subject.  I didn't see a button (or a
    tool) to toggle on-off the annotation.  The overlay button is
    there but toggling it doesn't do anything.
    There indeed are clusters mixed in with the annotations.  But
    from the documenation, it seems that the command we are using
    is /supposed/ to show clusters (but only the clusters, not the
    the annotations).  And that is the question I am trying to get
    answered.

    Here is the command we are using:
    /tksurfer fsaverage lh inflated -annot
    mc-z.abs.2.sig.ocn.annot -fthresh 2 -curv -gray/
    I am running this command from the appropriate folder and
    fsaverage is linked to our average subject.  We are using the
    following documentation:
    https://surfer.nmr.mgh.harvard.edu/fswiki/FsTutorial/GroupAnalysis?highlight=(mri
    <https://surfer.nmr.mgh.harvard.edu/fswiki/FsTutorial/GroupAnalysis?highlight=%28mri>
    <https://surfer.nmr.mgh.harvard.edu/fswiki/FsTutorial/GroupAnalysis?highlight=%28mri>\_glmfit\-sim)

    Thanks,
    Devdutta


    On Mon, Mar 9, 2009 at 12:09 PM, Nick Schmansky
    <nicks@nmr.mgh.harvard.edu <mailto:nicks@nmr.mgh.harvard.edu>
    <mailto:nicks@nmr.mgh.harvard.edu
    <mailto:nicks@nmr.mgh.harvard.edu>>> wrote:

       Devdutta,

       What version of freesurfer is being used?  The fsaverage
    subject you
       show doesnt look right.  Also, I see what appear to be clusters
       mixed in
       with the annotations.  The summary files output by the multiple
       correction step will tell you how many and the size of the
    clusters.
       You should be able to toggle on-off both the annotation and the
       overlay
       independently.

       I am cc'ing Sita, as she may be able to help you on this (I
    will have
       limited email contact this week).

       Nick


       On Mon, 2009-03-09 at 11:21 -0500, Devdutta W wrote:
       > Forgot to attach the images, again.
       >
       >
       > On Mon, Mar 9, 2009 at 11:20 AM, Devdutta W
       <devdutta.w@gmail.com <mailto:devdutta.w@gmail.com>
    <mailto:devdutta.w@gmail.com <mailto:devdutta.w@gmail.com>>>

       > wrote:
       >         Hi Nick,
       >         Can you shed some light on why this might be
    happening?  I
       >         will attach the two picture again in case you weren't
       able to
       >         view them last time.  I tried what I thought you
    meant by
       >         "turn off annotation display" and I have stated what
       happened
       >         in my previous email (please see below)
       >
       >               * If I don't include the -annot option in
    tksurfer it
       >                 only displays the fsaverage, naturally.
       >               * If I toggle off the button that says "show
       labels", it
       >                 looks like it is just the fsaverage as well.
       >               * If I toggle on the "Draw outlined labels"
    button it
       >                 shows the same regions as before except
    they are
       >                 merely outlined, not filled.
       >         Any help you can give me will be appreciated.
       >
       >         Thanks,
       >         Devdutta
       >
       >
       >         On Wed, Mar 4, 2009 at 10:36 AM, Devdutta W
       >         <devdutta.w@gmail.com
    <mailto:devdutta.w@gmail.com> <mailto:devdutta.w@gmail.com
    <mailto:devdutta.w@gmail.com>>> wrote:
       >                 Nick,
       >                 I confess, I am not exactly sure what you
    mean by
       >                 "turn off annotation display".  I tried a few
       >                 things.
       >
       >                       * If I don't include the -annot
    option in
       >                         tksurfer it only displays the
    fsaverage,
       >                         naturally.
       >                       * If I toggle off the button that
    says "show
       >                         labels", it looks like it is just the
       >                         fsaverage as well.
       >                       * If I toggle on the "Draw outlined
    labels"
       >                         button it shows the same regions
    as before
       >                         except they are merely outlined,
    not filled.
       >                 These were the only ones that I could
    think of.  Is
       >                 that what you meant or was it something
    else that I
       >                 missed?
       >
       >                 Thanks,
       >                 Devdutta
       >
       >
       >                 On Tue, Mar 3, 2009 at 7:12 PM, Nick
    Schmansky
       >                 <nicks@nmr.mgh.harvard.edu
    <mailto:nicks@nmr.mgh.harvard.edu>
       <mailto:nicks@nmr.mgh.harvard.edu
    <mailto:nicks@nmr.mgh.harvard.edu>>> wrote:
       >                         What is displayed if you turn off the
       >                         annotation display?
       >
       >                         The threshold in the simulation
    is used to
       >                         determine whether clusters
       >                         are found or not.  A threshold of 2
       indicates
       >                         a p-value of 0.01
       >                         (1/(10^2), 3 is 0.001, etc.  The
    threshold
       >                         referred to in the tksurfer
       >                         display is just for color
    thresholding.
       >
       >                         Nick
       >
       >
       >                         On Tue, 2009-03-03 at 17:17 -0600,
       Devdutta W
       >                         wrote:
       >                         > Forgot the attachments earlier.
     Here they
       >                         are now
       >                         >
       >                         > On Tue, Mar 3, 2009 at 5:11 PM,
    Devdutta W
       >                         <devdutta.w@gmail.com
    <mailto:devdutta.w@gmail.com>
       <mailto:devdutta.w@gmail.com <mailto:devdutta.w@gmail.com>>>

       >                         > wrote:
       >                         >         Hi Freesurfers,
       >                         >         More questions about this
       analysis.
       >                         >         1) Referring to the
    documentation,
       >                         we used the following
       >                         >         command:
       >                         >          tksurfer fsaverage lh
    inflated -
       >                         annot mc-
       >                         >         z.abs.2.sig.ocn.annot
    -fthresh 2 -
       >                         curv -gray
       >                         >
       >                         >         The documentation says we
       should see
       >                         an image as shown in
       >                         >         Figure 1 (attached).
     But what we
       >                         see is Figure 2 (also
       >                         >         attached).  Can
    somebody explain
       >                         this?
       >                         >
       >                         >         2) When running the
    simulation
       does
       >                         it matter what threshold
       >                         >         we use?  For example,
    can we use a
       >                         threshold of 2 or 3
       >                         >         (instead of 4 as shown in
       >                         documentation) when running
       >                         >         mri_glmfit-sim?  And do
    we have to
       >                         use the same threshold
       >                         >         while displaying the
    clusters
       after?
       >                         >
       >                         >         Thanks for any help.
       >                         >
       >                         >         Devdutta
       >                         >
       >
       >                         >
       >
     _______________________________________________
       >                         > Freesurfer mailing list
       >                         > Freesurfer@nmr.mgh.harvard.edu
    <mailto:Freesurfer@nmr.mgh.harvard.edu>
       <mailto:Freesurfer@nmr.mgh.harvard.edu
    <mailto:Freesurfer@nmr.mgh.harvard.edu>>

       >                         >
       >
     https://mail.nmr.mgh.harvard.edu/mailman/listinfo/freesurfer
       >
       >
       >
       >
       >
       >


    ------------------------------------------------------------------------


    _______________________________________________
    Freesurfer mailing list
    Freesurfer@nmr.mgh.harvard.edu
    <mailto:Freesurfer@nmr.mgh.harvard.edu>
    https://mail.nmr.mgh.harvard.edu/mailman/listinfo/freesurfer
We are using Red Hat Enterprise Linux 5. Thanks for your help. I'll try that out.
On Mon, Mar 9, 2009 at 3:02 PM, Douglas N Greve greve@nmr.mgh.harvard.eduwrote:
I think I've found the problem in that the original annotation at a vertex is not being cleared if a cluster is not there.
The short term fix is to delete " --annot aparc" from mri_glmfit-sim at line 353. I'll email when I have a longer term fix. What platform are you using?
doug
Devdutta W wrote:
When I load mc-z.abs.2.sig.cluster.mgh, if the "Draw filled labels" button is toggled on, it looks no different from before. Toggling the "show overlay" button doesn't do anything. If the "Draw Outlined labels" button is toggled on, the outlines of the colored regions can be seen (including the outlines of the clusters). This time, toggling the overlay button on-off shows the clusters.
On Mon, Mar 9, 2009 at 2:12 PM, Douglas N Greve < greve@nmr.mgh.harvard.edu mailto:greve@nmr.mgh.harvard.edu> wrote:
/what does it look like when you load mc-z.abs.2.sig.cluster.mgh as an overlay?/
Devdutta W wrote:
Nick, Sita, The average subject is created from our data, perhaps that's why it looks different. We were having problems getting freesurfer to recognize our average subject. So we linked fsaverage to our average subject. I didn't see a button (or a tool) to toggle on-off the annotation. The overlay button is there but toggling it doesn't do anything. There indeed are clusters mixed in with the annotations. But from the documenation, it seems that the command we are using is /supposed/ to show clusters (but only the clusters, not the the annotations). And that is the question I am trying to get answered. Here is the command we are using: /tksurfer fsaverage lh inflated -annot mc-z.abs.2.sig.ocn.annot -fthresh 2 -curv -gray/ I am running this command from the appropriate folder and fsaverage is linked to our average subject. We are using the following documentation:https://surfer.nmr.mgh.harvard.edu/fswiki/FsTutorial/GroupAnalysis?highlight...https://surfer.nmr.mgh.harvard.edu/fswiki/FsTutorial/GroupAnalysis?highlight=%28mri < https://surfer.nmr.mgh.harvard.edu/fswiki/FsTutorial/GroupAnalysis?highlight...
<https://surfer.nmr.mgh.harvard.edu/fswiki/FsTutorial/GroupAnalysis?highlight...
_glmfit-sim)
   Thanks,
   Devdutta


   On Mon, Mar 9, 2009 at 12:09 PM, Nick Schmansky
   <nicks@nmr.mgh.harvard.edu <mailto:nicks@nmr.mgh.harvard.edu>
   <mailto:nicks@nmr.mgh.harvard.edu
   <mailto:nicks@nmr.mgh.harvard.edu>>> wrote:

      Devdutta,

      What version of freesurfer is being used?  The fsaverage
   subject you
      show doesnt look right.  Also, I see what appear to be clusters
      mixed in
      with the annotations.  The summary files output by the multiple
      correction step will tell you how many and the size of the
   clusters.
      You should be able to toggle on-off both the annotation and the
      overlay
      independently.

      I am cc'ing Sita, as she may be able to help you on this (I
   will have
      limited email contact this week).

      Nick


      On Mon, 2009-03-09 at 11:21 -0500, Devdutta W wrote:
      > Forgot to attach the images, again.
      >
      >
      > On Mon, Mar 9, 2009 at 11:20 AM, Devdutta W
      <devdutta.w@gmail.com <mailto:devdutta.w@gmail.com>
   <mailto:devdutta.w@gmail.com <mailto:devdutta.w@gmail.com>>>


      > wrote:
      >         Hi Nick,
      >         Can you shed some light on why this might be
   happening?  I
      >         will attach the two picture again in case you weren't
      able to
      >         view them last time.  I tried what I thought you
   meant by
      >         "turn off annotation display" and I have stated what
      happened
      >         in my previous email (please see below)
      >
      >               * If I don't include the -annot option in
   tksurfer it
      >                 only displays the fsaverage, naturally.
      >               * If I toggle off the button that says "show
      labels", it
      >                 looks like it is just the fsaverage as well.
      >               * If I toggle on the "Draw outlined labels"
   button it
      >                 shows the same regions as before except
   they are
      >                 merely outlined, not filled.
      >         Any help you can give me will be appreciated.
      >
      >         Thanks,
      >         Devdutta
      >
      >
      >         On Wed, Mar 4, 2009 at 10:36 AM, Devdutta W
      >         <devdutta.w@gmail.com
   <mailto:devdutta.w@gmail.com> <mailto:devdutta.w@gmail.com

   <mailto:devdutta.w@gmail.com>>> wrote:
      >                 Nick,
      >                 I confess, I am not exactly sure what you
   mean by
      >                 "turn off annotation display".  I tried a few
      >                 things.
      >
      >                       * If I don't include the -annot
   option in
      >                         tksurfer it only displays the
   fsaverage,
      >                         naturally.
      >                       * If I toggle off the button that
   says "show
      >                         labels", it looks like it is just the
      >                         fsaverage as well.
      >                       * If I toggle on the "Draw outlined
   labels"
      >                         button it shows the same regions
   as before
      >                         except they are merely outlined,
   not filled.
      >                 These were the only ones that I could
   think of.  Is
      >                 that what you meant or was it something
   else that I
      >                 missed?
      >
      >                 Thanks,
      >                 Devdutta
      >
      >
      >                 On Tue, Mar 3, 2009 at 7:12 PM, Nick
   Schmansky
      >                 <nicks@nmr.mgh.harvard.edu
   <mailto:nicks@nmr.mgh.harvard.edu>
      <mailto:nicks@nmr.mgh.harvard.edu
   <mailto:nicks@nmr.mgh.harvard.edu>>> wrote:
      >                         What is displayed if you turn off the
      >                         annotation display?
      >
      >                         The threshold in the simulation
   is used to
      >                         determine whether clusters
      >                         are found or not.  A threshold of 2
      indicates
      >                         a p-value of 0.01
      >                         (1/(10^2), 3 is 0.001, etc.  The
   threshold
      >                         referred to in the tksurfer
      >                         display is just for color
   thresholding.
      >
      >                         Nick
      >
      >
      >                         On Tue, 2009-03-03 at 17:17 -0600,
      Devdutta W
      >                         wrote:
      >                         > Forgot the attachments earlier.
    Here they
      >                         are now
      >                         >
      >                         > On Tue, Mar 3, 2009 at 5:11 PM,
   Devdutta W
      >                         <devdutta.w@gmail.com
   <mailto:devdutta.w@gmail.com>
      <mailto:devdutta.w@gmail.com <mailto:devdutta.w@gmail.com>>>


      >                         > wrote:
      >                         >         Hi Freesurfers,
      >                         >         More questions about this
      analysis.
      >                         >         1) Referring to the
   documentation,
      >                         we used the following
      >                         >         command:
      >                         >          tksurfer fsaverage lh
   inflated -
      >                         annot mc-
      >                         >         z.abs.2.sig.ocn.annot
   -fthresh 2 -
      >                         curv -gray
      >                         >
      >                         >         The documentation says we
      should see
      >                         an image as shown in
      >                         >         Figure 1 (attached).
    But what we
      >                         see is Figure 2 (also
      >                         >         attached).  Can
   somebody explain
      >                         this?
      >                         >
      >                         >         2) When running the
   simulation
      does
      >                         it matter what threshold
      >                         >         we use?  For example,
   can we use a
      >                         threshold of 2 or 3
      >                         >         (instead of 4 as shown in
      >                         documentation) when running
      >                         >         mri_glmfit-sim?  And do
   we have to
      >                         use the same threshold
      >                         >         while displaying the
   clusters
      after?
      >                         >
      >                         >         Thanks for any help.
      >                         >
      >                         >         Devdutta
      >                         >
      >
      >                         >
      >
      >                         > Freesurfer mailing list
      >                         > Freesurfer@nmr.mgh.harvard.edu
   <mailto:Freesurfer@nmr.mgh.harvard.edu>
      <mailto:Freesurfer@nmr.mgh.harvard.edu
   <mailto:Freesurfer@nmr.mgh.harvard.edu>>

      >                         >
      >
https://mail.nmr.mgh.harvard.edu/mailman/listinfo/freesurfer > > > > > >
   _______________________________________________
   Freesurfer mailing list
   Freesurfer@nmr.mgh.harvard.edu
   <mailto:Freesurfer@nmr.mgh.harvard.edu>
   https://mail.nmr.mgh.harvard.edu/mailman/listinfo/freesurfer
Try copying this: ftp://surfer.nmr.mgh.harvard.edu/transfer/outgoing/flat/greve/mri_surfcluster
into your $FREESURFER_HOME/bin directory (make a backup first), and then re-run.
doug
Devdutta W wrote:
We are using Red Hat Enterprise Linux 5. Thanks for your help. I'll try that out.
On Mon, Mar 9, 2009 at 3:02 PM, Douglas N Greve <greve@nmr.mgh.harvard.edu mailto:greve@nmr.mgh.harvard.edu> wrote:
I think I've found the problem in that the original annotation at a vertex is not being cleared if a cluster is not there. The short term fix is to delete " --annot aparc" from mri_glmfit-sim at line 353. I'll email when I have a longer term fix. What platform are you using? doug Devdutta W wrote: When I load mc-z.abs.2.sig.cluster.mgh, if the "Draw filled labels" button is toggled on, it looks no different from before. Toggling the "show overlay" button doesn't do anything. If the "Draw Outlined labels" button is toggled on, the outlines of the colored regions can be seen (including the outlines of the clusters). This time, toggling the overlay button on-off shows the clusters. On Mon, Mar 9, 2009 at 2:12 PM, Douglas N Greve <greve@nmr.mgh.harvard.edu <mailto:greve@nmr.mgh.harvard.edu> <mailto:greve@nmr.mgh.harvard.edu <mailto:greve@nmr.mgh.harvard.edu>>> wrote: /what does it look like when you load mc-z.abs.2.sig.cluster.mgh as an overlay?/ Devdutta W wrote: Nick, Sita, The average subject is created from our data, perhaps that's why it looks different. We were having problems getting freesurfer to recognize our average subject. So we linked fsaverage to our average subject. I didn't see a button (or a tool) to toggle on-off the annotation. The overlay button is there but toggling it doesn't do anything. There indeed are clusters mixed in with the annotations. But from the documenation, it seems that the command we are using is /supposed/ to show clusters (but only the clusters, not the the annotations). And that is the question I am trying to get answered. Here is the command we are using: /tksurfer fsaverage lh inflated -annot mc-z.abs.2.sig.ocn.annot -fthresh 2 -curv -gray/ I am running this command from the appropriate folder and fsaverage is linked to our average subject. We are using the following documentation: https://surfer.nmr.mgh.harvard.edu/fswiki/FsTutorial/GroupAnalysis?highlight=(mri <https://surfer.nmr.mgh.harvard.edu/fswiki/FsTutorial/GroupAnalysis?highlight=%28mri> <https://surfer.nmr.mgh.harvard.edu/fswiki/FsTutorial/GroupAnalysis?highlight=%28mri> <https://surfer.nmr.mgh.harvard.edu/fswiki/FsTutorial/GroupAnalysis?highlight=%28mri>\_glmfit\-sim) Thanks, Devdutta On Mon, Mar 9, 2009 at 12:09 PM, Nick Schmansky <nicks@nmr.mgh.harvard.edu <mailto:nicks@nmr.mgh.harvard.edu> <mailto:nicks@nmr.mgh.harvard.edu <mailto:nicks@nmr.mgh.harvard.edu>> <mailto:nicks@nmr.mgh.harvard.edu <mailto:nicks@nmr.mgh.harvard.edu> <mailto:nicks@nmr.mgh.harvard.edu <mailto:nicks@nmr.mgh.harvard.edu>>>> wrote: Devdutta, What version of freesurfer is being used? The fsaverage subject you show doesnt look right. Also, I see what appear to be clusters mixed in with the annotations. The summary files output by the multiple correction step will tell you how many and the size of the clusters. You should be able to toggle on-off both the annotation and the overlay independently. I am cc'ing Sita, as she may be able to help you on this (I will have limited email contact this week). Nick On Mon, 2009-03-09 at 11:21 -0500, Devdutta W wrote: > Forgot to attach the images, again. > > > On Mon, Mar 9, 2009 at 11:20 AM, Devdutta W <devdutta.w@gmail.com <mailto:devdutta.w@gmail.com> <mailto:devdutta.w@gmail.com <mailto:devdutta.w@gmail.com>> <mailto:devdutta.w@gmail.com <mailto:devdutta.w@gmail.com> <mailto:devdutta.w@gmail.com <mailto:devdutta.w@gmail.com>>>> > wrote: > Hi Nick, > Can you shed some light on why this might be happening? I > will attach the two picture again in case you weren't able to > view them last time. I tried what I thought you meant by > "turn off annotation display" and I have stated what happened > in my previous email (please see below) > > * If I don't include the -annot option in tksurfer it > only displays the fsaverage, naturally. > * If I toggle off the button that says "show labels", it > looks like it is just the fsaverage as well. > * If I toggle on the "Draw outlined labels" button it > shows the same regions as before except they are > merely outlined, not filled. > Any help you can give me will be appreciated. > > Thanks, > Devdutta > > > On Wed, Mar 4, 2009 at 10:36 AM, Devdutta W > <devdutta.w@gmail.com <mailto:devdutta.w@gmail.com> <mailto:devdutta.w@gmail.com <mailto:devdutta.w@gmail.com>> <mailto:devdutta.w@gmail.com <mailto:devdutta.w@gmail.com> <mailto:devdutta.w@gmail.com <mailto:devdutta.w@gmail.com>>>> wrote: > Nick, > I confess, I am not exactly sure what you mean by > "turn off annotation display". I tried a few > things. > > * If I don't include the -annot option in > tksurfer it only displays the fsaverage, > naturally. > * If I toggle off the button that says "show > labels", it looks like it is just the > fsaverage as well. > * If I toggle on the "Draw outlined labels" > button it shows the same regions as before > except they are merely outlined, not filled. > These were the only ones that I could think of. Is > that what you meant or was it something else that I > missed? > > Thanks, > Devdutta > > > On Tue, Mar 3, 2009 at 7:12 PM, Nick Schmansky > <nicks@nmr.mgh.harvard.edu <mailto:nicks@nmr.mgh.harvard.edu> <mailto:nicks@nmr.mgh.harvard.edu <mailto:nicks@nmr.mgh.harvard.edu>> <mailto:nicks@nmr.mgh.harvard.edu <mailto:nicks@nmr.mgh.harvard.edu> <mailto:nicks@nmr.mgh.harvard.edu <mailto:nicks@nmr.mgh.harvard.edu>>>> wrote: > What is displayed if you turn off the > annotation display? > > The threshold in the simulation is used to > determine whether clusters > are found or not. A threshold of 2 indicates > a p-value of 0.01 > (1/(10^2), 3 is 0.001, etc. The threshold > referred to in the tksurfer > display is just for color thresholding. > > Nick > > > On Tue, 2009-03-03 at 17:17 -0600, Devdutta W > wrote: > > Forgot the attachments earlier. Here they > are now > > > > On Tue, Mar 3, 2009 at 5:11 PM, Devdutta W > <devdutta.w@gmail.com <mailto:devdutta.w@gmail.com> <mailto:devdutta.w@gmail.com <mailto:devdutta.w@gmail.com>> <mailto:devdutta.w@gmail.com <mailto:devdutta.w@gmail.com> <mailto:devdutta.w@gmail.com <mailto:devdutta.w@gmail.com>>>> > > wrote: > > Hi Freesurfers, > > More questions about this analysis. > > 1) Referring to the documentation, > we used the following > > command: > > tksurfer fsaverage lh inflated - > annot mc- > > z.abs.2.sig.ocn.annot -fthresh 2 - > curv -gray > > > > The documentation says we should see > an image as shown in > > Figure 1 (attached). But what we > see is Figure 2 (also > > attached). Can somebody explain > this? > > > > 2) When running the simulation does > it matter what threshold > > we use? For example, can we use a > threshold of 2 or 3 > > (instead of 4 as shown in > documentation) when running > > mri_glmfit-sim? And do we have to > use the same threshold > > while displaying the clusters after? > > > > Thanks for any help. > > > > Devdutta > > > > > > _______________________________________________ > > Freesurfer mailing list > > Freesurfer@nmr.mgh.harvard.edu <mailto:Freesurfer@nmr.mgh.harvard.edu> <mailto:Freesurfer@nmr.mgh.harvard.edu <mailto:Freesurfer@nmr.mgh.harvard.edu>> <mailto:Freesurfer@nmr.mgh.harvard.edu <mailto:Freesurfer@nmr.mgh.harvard.edu> <mailto:Freesurfer@nmr.mgh.harvard.edu <mailto:Freesurfer@nmr.mgh.harvard.edu>>> > > > https://mail.nmr.mgh.harvard.edu/mailman/listinfo/freesurfer > > > > > > ------------------------------------------------------------------------ _______________________________________________ Freesurfer mailing list Freesurfer@nmr.mgh.harvard.edu <mailto:Freesurfer@nmr.mgh.harvard.edu> <mailto:Freesurfer@nmr.mgh.harvard.edu <mailto:Freesurfer@nmr.mgh.harvard.edu>> https://mail.nmr.mgh.harvard.edu/mailman/listinfo/freesurfer
Hi Doug, Thanks for your help. A followup question to your last email: the short term fix that you mentioned earlier, do I need to make that fix in addition to copying the new mri_surfcluster file in the binary dir? Or has that been fixed already?
Thanks, Devdutta
On Mon, Mar 9, 2009 at 4:41 PM, Douglas N Greve greve@nmr.mgh.harvard.eduwrote:
Try copying this:
ftp://surfer.nmr.mgh.harvard.edu/transfer/outgoing/flat/greve/mri_surfcluster
into your $FREESURFER_HOME/bin directory (make a backup first), and then re-run.
doug
Devdutta W wrote:
We are using Red Hat Enterprise Linux 5. Thanks for your help. I'll try that out.
On Mon, Mar 9, 2009 at 3:02 PM, Douglas N Greve < greve@nmr.mgh.harvard.edu mailto:greve@nmr.mgh.harvard.edu> wrote:
I think I've found the problem in that the original annotation at a vertex is not being cleared if a cluster is not there.
The short term fix is to delete " --annot aparc" from mri_glmfit-sim at line 353. I'll email when I have a longer term fix. What platform are you using?
doug
Devdutta W wrote:
When I load mc-z.abs.2.sig.cluster.mgh, if the "Draw filled labels" button is toggled on, it looks no different from before. Toggling the "show overlay" button doesn't do anything. If the "Draw Outlined labels" button is toggled on, the outlines of the colored regions can be seen (including the outlines of the clusters). This time, toggling the overlay button on-off shows the clusters. On Mon, Mar 9, 2009 at 2:12 PM, Douglas N Greve <greve@nmr.mgh.harvard.edu <mailto:greve@nmr.mgh.harvard.edu> <mailto:greve@nmr.mgh.harvard.edu <mailto:greve@nmr.mgh.harvard.edu>>> wrote: /what does it look like when you load mc-z.abs.2.sig.cluster.mgh as an overlay?/ Devdutta W wrote: Nick, Sita, The average subject is created from our data, perhaps that's why it looks different. We were having problems getting freesurfer to recognize our average subject. So we linked fsaverage to our average subject. I didn't see a button (or a tool) to toggle on-off the annotation. The overlay button is there but toggling it doesn't do anything. There indeed are clusters mixed in with the annotations. But from the documenation, it seems that the command we are using is /supposed/ to show clusters (but only the clusters, not the the annotations). And that is the question I am trying to get answered. Here is the command we are using: /tksurfer fsaverage lh inflated -annot mc-z.abs.2.sig.ocn.annot -fthresh 2 -curv -gray/ I am running this command from the appropriate folder and fsaverage is linked to our average subject. We are using the following documentation:https://surfer.nmr.mgh.harvard.edu/fswiki/FsTutorial/GroupAnalysis?highlight...https://surfer.nmr.mgh.harvard.edu/fswiki/FsTutorial/GroupAnalysis?highlight=%28mri < https://surfer.nmr.mgh.harvard.edu/fswiki/FsTutorial/GroupAnalysis?highlight...
<https://surfer.nmr.mgh.harvard.edu/fswiki/FsTutorial/GroupAnalysis?highlight...
<https://surfer.nmr.mgh.harvard.edu/fswiki/FsTutorial/GroupAnalysis?highlight...
_glmfit-sim)
          Thanks,
          Devdutta


          On Mon, Mar 9, 2009 at 12:09 PM, Nick Schmansky
          <nicks@nmr.mgh.harvard.edu
   <mailto:nicks@nmr.mgh.harvard.edu>
   <mailto:nicks@nmr.mgh.harvard.edu
   <mailto:nicks@nmr.mgh.harvard.edu>>
          <mailto:nicks@nmr.mgh.harvard.edu
   <mailto:nicks@nmr.mgh.harvard.edu>
          <mailto:nicks@nmr.mgh.harvard.edu
   <mailto:nicks@nmr.mgh.harvard.edu>>>> wrote:

             Devdutta,

             What version of freesurfer is being used?  The fsaverage
          subject you
             show doesnt look right.  Also, I see what appear to
   be clusters
             mixed in
             with the annotations.  The summary files output by
   the multiple
             correction step will tell you how many and the size
   of the
          clusters.
             You should be able to toggle on-off both the
   annotation and the
             overlay
             independently.

             I am cc'ing Sita, as she may be able to help you on
   this (I
          will have
             limited email contact this week).

             Nick


             On Mon, 2009-03-09 at 11:21 -0500, Devdutta W wrote:
             > Forgot to attach the images, again.
             >
             >
             > On Mon, Mar 9, 2009 at 11:20 AM, Devdutta W
             <devdutta.w@gmail.com <mailto:devdutta.w@gmail.com>
   <mailto:devdutta.w@gmail.com <mailto:devdutta.w@gmail.com>>
          <mailto:devdutta.w@gmail.com
   <mailto:devdutta.w@gmail.com> <mailto:devdutta.w@gmail.com
   <mailto:devdutta.w@gmail.com>>>>


             > wrote:
             >         Hi Nick,
             >         Can you shed some light on why this might be
          happening?  I
             >         will attach the two picture again in case
   you weren't
             able to
             >         view them last time.  I tried what I
   thought you
          meant by
             >         "turn off annotation display" and I have
   stated what
             happened
             >         in my previous email (please see below)
             >
             >               * If I don't include the -annot
   option in
          tksurfer it
             >                 only displays the fsaverage,
   naturally.
             >               * If I toggle off the button that
   says "show
             labels", it
             >                 looks like it is just the
   fsaverage as well.
             >               * If I toggle on the "Draw outlined
   labels"
          button it
             >                 shows the same regions as before
   except
          they are
             >                 merely outlined, not filled.
             >         Any help you can give me will be appreciated.
             >
             >         Thanks,
             >         Devdutta
             >
             >
             >         On Wed, Mar 4, 2009 at 10:36 AM, Devdutta W
             >         <devdutta.w@gmail.com
   <mailto:devdutta.w@gmail.com>
          <mailto:devdutta.w@gmail.com
   <mailto:devdutta.w@gmail.com>> <mailto:devdutta.w@gmail.com
   <mailto:devdutta.w@gmail.com>

          <mailto:devdutta.w@gmail.com
   <mailto:devdutta.w@gmail.com>>>> wrote:
             >                 Nick,
             >                 I confess, I am not exactly sure
   what you
          mean by
             >                 "turn off annotation display".  I
   tried a few
             >                 things.
             >
             >                       * If I don't include the -annot
          option in
             >                         tksurfer it only displays the
          fsaverage,
             >                         naturally.
             >                       * If I toggle off the button
   that
          says "show
             >                         labels", it looks like it
   is just the
             >                         fsaverage as well.
             >                       * If I toggle on the "Draw
   outlined
          labels"
             >                         button it shows the same
   regions
          as before
             >                         except they are merely
   outlined,
          not filled.
             >                 These were the only ones that I could
          think of.  Is
             >                 that what you meant or was it
   something
          else that I
             >                 missed?
             >
             >                 Thanks,
             >                 Devdutta
             >
             >
             >                 On Tue, Mar 3, 2009 at 7:12 PM, Nick
          Schmansky
             >                 <nicks@nmr.mgh.harvard.edu
   <mailto:nicks@nmr.mgh.harvard.edu>
          <mailto:nicks@nmr.mgh.harvard.edu
   <mailto:nicks@nmr.mgh.harvard.edu>>
             <mailto:nicks@nmr.mgh.harvard.edu
   <mailto:nicks@nmr.mgh.harvard.edu>
          <mailto:nicks@nmr.mgh.harvard.edu
   <mailto:nicks@nmr.mgh.harvard.edu>>>> wrote:
             >                         What is displayed if you
   turn off the
             >                         annotation display?
             >
             >                         The threshold in the
   simulation
          is used to
             >                         determine whether clusters
             >                         are found or not.  A
   threshold of 2
             indicates
             >                         a p-value of 0.01
             >                         (1/(10^2), 3 is 0.001,
   etc.  The
          threshold
             >                         referred to in the tksurfer
             >                         display is just for color
          thresholding.
             >
             >                         Nick
             >
             >
             >                         On Tue, 2009-03-03 at
   17:17 -0600,
             Devdutta W
             >                         wrote:
             >                         > Forgot the attachments
   earlier.
           Here they
             >                         are now
             >                         >
             >                         > On Tue, Mar 3, 2009 at
   5:11 PM,
          Devdutta W
             >                         <devdutta.w@gmail.com
   <mailto:devdutta.w@gmail.com>
          <mailto:devdutta.w@gmail.com <mailto:devdutta.w@gmail.com>>
             <mailto:devdutta.w@gmail.com
   <mailto:devdutta.w@gmail.com> <mailto:devdutta.w@gmail.com
   <mailto:devdutta.w@gmail.com>>>>


             >                         > wrote:
             >                         >         Hi Freesurfers,
             >                         >         More questions
   about this
             analysis.
             >                         >         1) Referring to the
          documentation,
             >                         we used the following
             >                         >         command:
             >                         >          tksurfer
   fsaverage lh
          inflated -
             >                         annot mc-
             >                         >
z.abs.2.sig.ocn.annot -fthresh 2 - > curv -gray > > > > The documentation says we should see > an image as shown in > > Figure 1 (attached). But what we > see is Figure 2 (also > > attached). Can somebody explain > this? > > > > 2) When running the simulation does > it matter what threshold > > we use? For example, can we use a > threshold of 2 or 3 > > (instead of 4 as shown in > documentation) when running > > mri_glmfit-sim? And do we have to > use the same threshold > > while displaying the clusters after? > > > > Thanks for any help. > > > > Devdutta > > > > > > _______________________________________________ > > Freesurfer mailing list > > Freesurfer@nmr.mgh.harvard.edu mailto:Freesurfer@nmr.mgh.harvard.edu <mailto:Freesurfer@nmr.mgh.harvard.edu mailto:Freesurfer@nmr.mgh.harvard.edu> <mailto:Freesurfer@nmr.mgh.harvard.edu mailto:Freesurfer@nmr.mgh.harvard.edu <mailto:Freesurfer@nmr.mgh.harvard.edu mailto:Freesurfer@nmr.mgh.harvard.edu>>
             >                         >
             >
https://mail.nmr.mgh.harvard.edu/mailman/listinfo/freesurfer > > > > > >
          _______________________________________________
          Freesurfer mailing list
          Freesurfer@nmr.mgh.harvard.edu
   <mailto:Freesurfer@nmr.mgh.harvard.edu>
          <mailto:Freesurfer@nmr.mgh.harvard.edu
   <mailto:Freesurfer@nmr.mgh.harvard.edu>>
https://mail.nmr.mgh.harvard.edu/mailman/listinfo/freesurfer

Hi,
my follow up question would be, how much has changed regarding fsaverage between freesurfer version 4.1.0 and 4.3.1? Is the added insula label the only change that has been made? Besides, when I load both annotations, the old and the new one, it seems to me almost every border of the parcellation has been shifted slightly. Is it how it's meant to be? I ask because I forgot to update the fsaverage in my separately stored Subjects_dir since version 4.1.0 and made a lot of analysis in the last months. To my mind it's good enough to rerun mri_surfcluster with the new fsaverage to get the updated annotations into my summary tables. Should that do the trick?
Thanks again, Georg
---------------------------------------------------------------------------- -------
Iris, the registration targets were derived differently. With version 4, we automatically fill in all the ventricles. In verion 3, they were partially filled in manually. Version 3 creates a surface around the ventrical making it look like a sulcus, and this affects both the target and the registration to the target. So, on most of the surface, the registration will be very close, but it will deviate signifiacntly around the ventricles/medial wall. I think the fsfast in version 4 should work fine with the anatomicals (including fsaverage) of version 3.
doug
Steinmann, Iris wrote:
Hi,
we have several reconstructed brains, which were processed by freesurfer 3.0.5. We also kept using the fsaverage data from 3.0.5 in order to be consistent. We wish to do fMRI analysis with freesurfer/fs-fast 4.0.5 and found that talairach coordinates differ slightly when using the fsaverage from version 3.0.5 and the current fsaverage from 4.0.5. Yet, the both volumes appear pretty similar, the newer one maybe a little bit smoother. We would like to know what constitutes the exact difference between these two fsaverage datasets and whether it is possible to use the new version for analysis with the "old" fsaverage data without getting inconsistent results.
Thanks a lot, Iris _______________________________________________ Freesurfer mailing list Freesurfer@nmr.mgh.harvard.edu https://mail.nmr.mgh.harvard.edu/mailman/listinfo/freesurfer
-- Douglas N. Greve, Ph.D. MGH-NMR Center [EMAIL PROTECTED] Phone Number: 617-724-2358 Fax: 617-726-7422
In order to help us help you, please follow the steps in: surfer.nmr.mgh.harvard.edu/fswiki/BugReporting
_______________________________________________ Freesurfer mailing list Freesurfer@nmr.mgh.harvard.edu https://mail.nmr.mgh.harvard.edu/mailman/listinfo/freesurfer
freesurfer@nmr.mgh.harvard.edu
-
 Devdutta W
 -
 Douglas N Greve
 -
 Georg Homola
 -
 Nick Schmansky