
3 Mar
2009
3 Mar
'09
6:17 p.m.
Forgot the attachments earlier. Here they are now
On Tue, Mar 3, 2009 at 5:11 PM, Devdutta W devdutta.w@gmail.com wrote:
Hi Freesurfers, More questions about this analysis.
- Referring to the documentation, we used the following command:
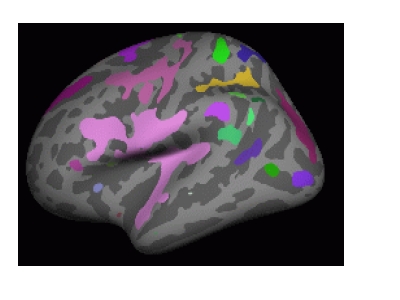
tksurfer fsaverage lh inflated -annot mc-z.abs.2.sig.ocn.annot -fthresh 2 -curv -gray
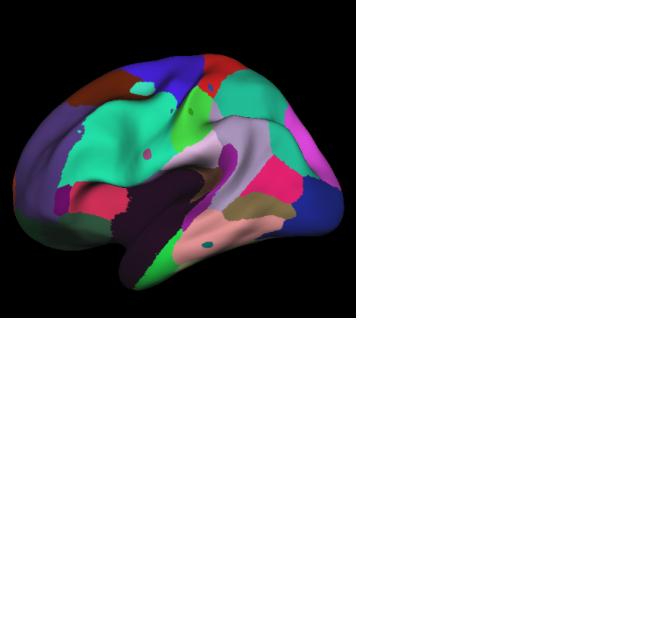
The documentation says we should see an image as shown in Figure 1 (attached). But what we see is Figure 2 (also attached). Can somebody explain this?
- When running the simulation does it matter what threshold we use? For
example, can we use a threshold of 2 or 3 (instead of 4 as shown in documentation) when running mri_glmfit-sim? And do we have to use the same threshold while displaying the clusters after?
Thanks for any help.
Devdutta