
I need to extract the beta weights from a cluster identified with FS-Fast in order to compute percentage signal change.
1) I see a file called beta.nii.gz that appears to have the beta weight information. It has a four dimensional structure and the fourth dimension appears to be the beta weights. Is there an index somewhere as to which beta weight is which? Or if not, how are they organized?
2) In order to extract the cluster, it looks like I would use mri_label2vol to convert cache.th20.neg.sig.ocn.annot into a volume where the voxels are tagged with the number of the corresponding cluster.
I could then use that to generate masks to extract the information I need for each cluster from beta.nii.gz.
Is that correct?
3) The final information that I would need is the canonical hrf shape generated by FSFAST for a single event. I guess I could generate that by setting up a dummy analysis run with a single event of the desired duration and then look in the X variable in the resulting X.mat file?
Sorry for all the questions!
Joe
--------------------------------------------------------------------------------
Joseph Dien, Senior Research Scientist University of Maryland
E-mail: jdien07@mac.com Phone: 301-226-8848 Fax: 301-226-8811 http://joedien.com//

Hi Joe,
On 05/29/2013 01:00 AM, Joseph Dien wrote:
I need to extract the beta weights from a cluster identified with FS-Fast in order to compute percentage signal change.
- I see a file called beta.nii.gz that appears to have the beta
weight information. It has a four dimensional structure and the fourth dimension appears to be the beta weights. Is there an index somewhere as to which beta weight is which? Or if not, how are they organized?
For the first level analysis, the first N beta weights correspond to the N conditions in the paradigm file. The rest are nuisance variables.
- In order to extract the cluster, it looks like I would
use mri_label2vol to convert cache.th20.neg.sig.ocn.annot into a volume where the voxels are tagged with the number of the corresponding cluster.
Is that from a group analysis?
I could then use that to generate masks to extract the information I need for each cluster from beta.nii.gz.
If this is from a group analysis, then there should already be a file there (something.y.ocn.dat) that has a value for each subject in the rows and a value for each cluster in the columns.
Is that correct?
- The final information that I would need is the canonical hrf shape
generated by FSFAST for a single event. I guess I could generate that by setting up a dummy analysis run with a single event of the desired duration and then look in the X variable in the resulting X.mat file?
try this plot(X.runflac(1).flac.ev(2).tirf, X.runflac(1).flac.ev(2).Xirf)
Sorry for all the questions!
Joe
Joseph Dien, Senior Research Scientist University of Maryland
E-mail: jdien07@mac.com mailto:jdien07@mac.com Phone: 301-226-8848 Fax: 301-226-8811 http://joedien.com//
Freesurfer mailing list Freesurfer@nmr.mgh.harvard.edu https://mail.nmr.mgh.harvard.edu/mailman/listinfo/freesurfer
On May 29, 2013, at 11:40 AM, Douglas N Greve greve@NMR.MGH.HARVARD.EDU wrote:
Hi Joe,
On 05/29/2013 01:00 AM, Joseph Dien wrote:
I need to extract the beta weights from a cluster identified with FS-Fast in order to compute percentage signal change.
- I see a file called beta.nii.gz that appears to have the beta
weight information. It has a four dimensional structure and the fourth dimension appears to be the beta weights. Is there an index somewhere as to which beta weight is which? Or if not, how are they organized?
For the first level analysis, the first N beta weights correspond to the N conditions in the paradigm file. The rest are nuisance variables.
Ah, very good! In order to compute the percent signal change statistic (I'm following the MarsBaR approach: http://marsbar.sourceforge.net/faq.html#how-is-the-percent-signal-change-cal...) I'm also going to need the beta weights for the session mean regressors. How are the nuisance regressors organized?
- In order to extract the cluster, it looks like I would
use mri_label2vol to convert cache.th20.neg.sig.ocn.annot into a volume where the voxels are tagged with the number of the corresponding cluster.
Is that from a group analysis?
Yes, that's right.
I could then use that to generate masks to extract the information I need for each cluster from beta.nii.gz.
If this is from a group analysis, then there should already be a file there (something.y.ocn.dat) that has a value for each subject in the rows and a value for each cluster in the columns.
I see it. Are these values already scaled as percent signal change? If so, that would be wonderful! :)
Is that correct?
- The final information that I would need is the canonical hrf shape
generated by FSFAST for a single event. I guess I could generate that by setting up a dummy analysis run with a single event of the desired duration and then look in the X variable in the resulting X.mat file?
try this plot(X.runflac(1).flac.ev(2).tirf, X.runflac(1).flac.ev(2).Xirf)
Perfect! :)
Sorry for all the questions!
Joe
Joseph Dien, Senior Research Scientist University of Maryland
E-mail: jdien07@mac.com mailto:jdien07@mac.com Phone: 301-226-8848 Fax: 301-226-8811 http://joedien.com//
Freesurfer mailing list Freesurfer@nmr.mgh.harvard.edu https://mail.nmr.mgh.harvard.edu/mailman/listinfo/freesurfer
-- Douglas N. Greve, Ph.D. MGH-NMR Center greve@nmr.mgh.harvard.edu Phone Number: 617-724-2358 Fax: 617-726-7422
Bugs: surfer.nmr.mgh.harvard.edu/fswiki/BugReporting FileDrop: https://gate.nmr.mgh.harvard.edu/filedrop2 www.nmr.mgh.harvard.edu/facility/filedrop/index.html Outgoing: ftp://surfer.nmr.mgh.harvard.edu/transfer/outgoing/flat/greve/
Freesurfer mailing list Freesurfer@nmr.mgh.harvard.edu https://mail.nmr.mgh.harvard.edu/mailman/listinfo/freesurfer
The information in this e-mail is intended only for the person to whom it is addressed. If you believe this e-mail was sent to you in error and the e-mail contains patient information, please contact the Partners Compliance HelpLine at http://www.partners.org/complianceline . If the e-mail was sent to you in error but does not contain patient information, please contact the sender and properly dispose of the e-mail.
--------------------------------------------------------------------------------
Joseph Dien, Senior Research Scientist University of Maryland
E-mail: jdien07@mac.com Phone: 301-226-8848 Fax: 301-226-8811 http://joedien.com//
On 5/29/13 10:42 PM, Joseph Dien wrote:
On May 29, 2013, at 11:40 AM, Douglas N Greve <greve@NMR.MGH.HARVARD.EDU mailto:greve@NMR.MGH.HARVARD.EDU> wrote:
Hi Joe,
On 05/29/2013 01:00 AM, Joseph Dien wrote:
I need to extract the beta weights from a cluster identified with FS-Fast in order to compute percentage signal change.
- I see a file called beta.nii.gz that appears to have the beta
weight information. It has a four dimensional structure and the fourth dimension appears to be the beta weights. Is there an index somewhere as to which beta weight is which? Or if not, how are they organized?
For the first level analysis, the first N beta weights correspond to the N conditions in the paradigm file. The rest are nuisance variables.
Ah, very good! In order to compute the percent signal change statistic (I'm following the MarsBaR approach: http://marsbar.sourceforge.net/faq.html#how-is-the-percent-signal-change-cal...) I'm also going to need the beta weights for the session mean regressors. How are the nuisance regressors organized?
You can just use the meanfunc.nii.gz. Also, each contrasts is computed as the simple contrast (ces) and as a percent of the baseline at the voxel (cespct, cesvarpct).
- In order to extract the cluster, it looks like I would
use mri_label2vol to convert cache.th20.neg.sig.ocn.annot into a volume where the voxels are tagged with the number of the corresponding cluster.
Is that from a group analysis?
Yes, that's right.
I could then use that to generate masks to extract the information I need for each cluster from beta.nii.gz.
If this is from a group analysis, then there should already be a file there (something.y.ocn.dat) that has a value for each subject in the rows and a value for each cluster in the columns.
I see it. Are these values already scaled as percent signal change? If so, that would be wonderful! :)
Only if you specified it when you ran isxconcat-sess. Note that the "non-scaled" values are actually scaled to percent of grand mean intensity.
Is that correct?
- The final information that I would need is the canonical hrf shape
generated by FSFAST for a single event. I guess I could generate that by setting up a dummy analysis run with a single event of the desired duration and then look in the X variable in the resulting X.mat file?
try this plot(X.runflac(1).flac.ev(2).tirf, X.runflac(1).flac.ev(2).Xirf)
Perfect! :)
Sorry for all the questions!
Joe
Joseph Dien, Senior Research Scientist University of Maryland
E-mail: jdien07@mac.com mailto:jdien07@mac.com mailto:jdien07@mac.com Phone: 301-226-8848 Fax: 301-226-8811 http://joedien.com//
Freesurfer mailing list Freesurfer@nmr.mgh.harvard.edu https://mail.nmr.mgh.harvard.edu/mailman/listinfo/freesurfer
-- Douglas N. Greve, Ph.D. MGH-NMR Center greve@nmr.mgh.harvard.edu mailto:greve@nmr.mgh.harvard.edu Phone Number: 617-724-2358 Fax: 617-726-7422
Bugs: surfer.nmr.mgh.harvard.edu/fswiki/BugReporting FileDrop: https://gate.nmr.mgh.harvard.edu/filedrop2 www.nmr.mgh.harvard.edu/facility/filedrop/index.html Outgoing: ftp://surfer.nmr.mgh.harvard.edu/transfer/outgoing/flat/greve/
Freesurfer mailing list Freesurfer@nmr.mgh.harvard.edu https://mail.nmr.mgh.harvard.edu/mailman/listinfo/freesurfer
The information in this e-mail is intended only for the person to whom it is addressed. If you believe this e-mail was sent to you in error and the e-mail contains patient information, please contact the Partners Compliance HelpLine at http://www.partners.org/complianceline . If the e-mail was sent to you in error but does not contain patient information, please contact the sender and properly dispose of the e-mail.
Joseph Dien, Senior Research Scientist University of Maryland
E-mail: jdien07@mac.com mailto:jdien07@mac.com Phone: 301-226-8848 Fax: 301-226-8811 http://joedien.com//
Just to make sure I'm doing this right, I'm going to summarize what I've taken away from your answers and to ask some new questions. In order to present the results, I need two things:
1) A set of histograms (with error bars) for each cluster figure to show the % signal change for each of the four contrasts of interest. The cache.th20.pos.y.ocn.dat file only gives it for the condition where the cluster was significant so I can't use that. So I could use mri_label2vol to convert cache.th20.neg.sig.ocn.annot from the group level analysis to generate a mask for each cluster of interest. Then I could extract the value of the voxels from each subject's cespct file for each contrast, average them across the cluster ROI, then average them across each subject, to generate the histogram? This would suffice to give me the %age signal change? I would be doing these computations in Matlab using MRIread.
2) A results table with the headings:
Cluster p (FWE corrected) Cluster size Peak Voxel p (FWE corrected) Peak Voxel T Peak Voxel Coords BA Anatomical Landmark
I can get the first two from the cache.th20.pos/neg.sig.cluster.summary files from the group level analysis. I can get the peak voxel coordinates from the summary files as well. I can use this to get the peak voxel p from the group level sig.nii.gz file. Is this FWE corrected? If not, how can I get this information? I can use these coordinates to get the peak voxel T by getting the value from the group level F.nii.gz file and taking its square root. How can I get the sign of the T statistic? I can use the Lancaster transform to convert the MNI305 peak voxel coordinates into the Atlas coordinates to look up the putative BA and landmarks (unless there is a better way with Freesurfer? I'm seeing some references to some BA labels in the forum but it doesn't look like this is a complete set yet?).
Sorry for all these questions! I got some nice results from FSFAST and would like to get them written up.
Cheers!
Joe
On May 29, 2013, at 10:53 PM, Douglas Greve greve@nmr.mgh.harvard.edu wrote:
On 5/29/13 10:42 PM, Joseph Dien wrote:
On May 29, 2013, at 11:40 AM, Douglas N Greve greve@NMR.MGH.HARVARD.EDU wrote:
Hi Joe,
On 05/29/2013 01:00 AM, Joseph Dien wrote:
I need to extract the beta weights from a cluster identified with FS-Fast in order to compute percentage signal change.
- I see a file called beta.nii.gz that appears to have the beta
weight information. It has a four dimensional structure and the fourth dimension appears to be the beta weights. Is there an index somewhere as to which beta weight is which? Or if not, how are they organized?
For the first level analysis, the first N beta weights correspond to the N conditions in the paradigm file. The rest are nuisance variables.
Ah, very good! In order to compute the percent signal change statistic (I'm following the MarsBaR approach: http://marsbar.sourceforge.net/faq.html#how-is-the-percent-signal-change-cal...) I'm also going to need the beta weights for the session mean regressors. How are the nuisance regressors organized?
You can just use the meanfunc.nii.gz. Also, each contrasts is computed as the simple contrast (ces) and as a percent of the baseline at the voxel (cespct, cesvarpct).
- In order to extract the cluster, it looks like I would
use mri_label2vol to convert cache.th20.neg.sig.ocn.annot into a volume where the voxels are tagged with the number of the corresponding cluster.
Is that from a group analysis?
Yes, that's right.
I could then use that to generate masks to extract the information I need for each cluster from beta.nii.gz.
If this is from a group analysis, then there should already be a file there (something.y.ocn.dat) that has a value for each subject in the rows and a value for each cluster in the columns.
I see it. Are these values already scaled as percent signal change? If so, that would be wonderful! :)
Only if you specified it when you ran isxconcat-sess. Note that the "non-scaled" values are actually scaled to percent of grand mean intensity.
Is that correct?
- The final information that I would need is the canonical hrf shape
generated by FSFAST for a single event. I guess I could generate that by setting up a dummy analysis run with a single event of the desired duration and then look in the X variable in the resulting X.mat file?
try this plot(X.runflac(1).flac.ev(2).tirf, X.runflac(1).flac.ev(2).Xirf)
Perfect! :)
Sorry for all the questions!
Joe
Joseph Dien, Senior Research Scientist University of Maryland
E-mail: jdien07@mac.com mailto:jdien07@mac.com Phone: 301-226-8848 Fax: 301-226-8811 http://joedien.com//
Freesurfer mailing list Freesurfer@nmr.mgh.harvard.edu https://mail.nmr.mgh.harvard.edu/mailman/listinfo/freesurfer
-- Douglas N. Greve, Ph.D. MGH-NMR Center greve@nmr.mgh.harvard.edu Phone Number: 617-724-2358 Fax: 617-726-7422
Bugs: surfer.nmr.mgh.harvard.edu/fswiki/BugReporting FileDrop: https://gate.nmr.mgh.harvard.edu/filedrop2 www.nmr.mgh.harvard.edu/facility/filedrop/index.html Outgoing: ftp://surfer.nmr.mgh.harvard.edu/transfer/outgoing/flat/greve/
Freesurfer mailing list Freesurfer@nmr.mgh.harvard.edu https://mail.nmr.mgh.harvard.edu/mailman/listinfo/freesurfer
The information in this e-mail is intended only for the person to whom it is addressed. If you believe this e-mail was sent to you in error and the e-mail contains patient information, please contact the Partners Compliance HelpLine at http://www.partners.org/complianceline . If the e-mail was sent to you in error but does not contain patient information, please contact the sender and properly dispose of the e-mail.
Joseph Dien, Senior Research Scientist University of Maryland
E-mail: jdien07@mac.com Phone: 301-226-8848 Fax: 301-226-8811 http://joedien.com//
Freesurfer mailing list Freesurfer@nmr.mgh.harvard.edu https://mail.nmr.mgh.harvard.edu/mailman/listinfo/freesurfer
The information in this e-mail is intended only for the person to whom it is addressed. If you believe this e-mail was sent to you in error and the e-mail contains patient information, please contact the Partners Compliance HelpLine at http://www.partners.org/complianceline . If the e-mail was sent to you in error but does not contain patient information, please contact the sender and properly dispose of the e-mail.
--------------------------------------------------------------------------------
Joseph Dien, Senior Research Scientist University of Maryland
E-mail: jdien07@mac.com Phone: 301-226-8848 Fax: 301-226-8811 http://joedien.com//
I tried using MRIread to look at the contents of the analysis files (using Fressurfer 5.2.0 under OS X 10.8.3 and Matlab 2013a):
mri = MRIread('ces.nii.gz',0);
but I'm getting one-dimensional vectors:
mri
mri =
srcbext: '' analyzehdr: [] bhdr: [] vol: [1x163842 double] niftihdr: [1x1 struct] fspec: 'ces.nii.gz' pwd: '/Volumes/Data/CP1/fsfast/CPA003/bold/CPA.sm05.lh/CS-v-OTHERS' flip_angle: 0 tr: 2000 te: 0 ti: 0 vox2ras0: [4x4 double] volsize: [1 163842 1] height: 1 width: 163842 depth: 1 nframes: 1 vox2ras: [4x4 double] nvoxels: 163842 xsize: 1.0000 ysize: 1.0000 zsize: 1.0000 x_r: -0.9999 x_a: 0.0067 x_s: -0.0150 y_r: 4.1714e-08 y_a: 0.9131 y_s: 0.4078 z_r: -0.0164 z_a: -0.4077 z_s: 0.9130 c_r: -6.8259e+04 c_a: 465.0319 c_s: -995.9002 vox2ras1: [4x4 double] Mdc: [3x3 double] volres: [1.0000 1.0000 1.0000] tkrvox2ras: [4x4 double]
It's fine when I read one of the functional files (f.nii.gz). Am I doing something wrong? Or if it is supposed to be like this, how do I convert to XYZ coordinates? The vox2ras fields are expecting a four-dimensional matrix.
Thanks!
Joe
--------------------------------------------------------------------------------
Joseph Dien, Senior Research Scientist University of Maryland
E-mail: jdien07@mac.com Phone: 301-226-8848 Fax: 301-226-8811 http://joedien.com//
That is a surface file. Each of the 163842 values corresponds to a vertex in the surface. If you want xyz, you need to load in the surface. You can also analyze the data in the native space if that would make it easier (but you can't surface smooth). doug
On 05/30/2013 05:08 PM, Joseph Dien wrote:
I tried using MRIread to look at the contents of the analysis files (using Fressurfer 5.2.0 under OS X 10.8.3 and Matlab 2013a):
mri = MRIread('ces.nii.gz',0);
but I'm getting one-dimensional vectors:
mri
mri =
srcbext: '' analyzehdr: [] bhdr: [] vol: [1x163842 double] niftihdr: [1x1 struct] fspec: 'ces.nii.gz' pwd: '/Volumes/Data/CP1/fsfast/CPA003/bold/CPA.sm05.lh/CS-v-OTHERS' flip_angle: 0 tr: 2000 te: 0 ti: 0 vox2ras0: [4x4 double] volsize: [1 163842 1] height: 1 width: 163842 depth: 1 nframes: 1 vox2ras: [4x4 double] nvoxels: 163842 xsize: 1.0000 ysize: 1.0000 zsize: 1.0000 x_r: -0.9999 x_a: 0.0067 x_s: -0.0150 y_r: 4.1714e-08 y_a: 0.9131 y_s: 0.4078 z_r: -0.0164 z_a: -0.4077 z_s: 0.9130 c_r: -6.8259e+04 c_a: 465.0319 c_s: -995.9002 vox2ras1: [4x4 double] Mdc: [3x3 double] volres: [1.0000 1.0000 1.0000] tkrvox2ras: [4x4 double]
It's fine when I read one of the functional files (f.nii.gz). Am I doing something wrong? Or if it is supposed to be like this, how do I convert to XYZ coordinates? The vox2ras fields are expecting a four-dimensional matrix.
Thanks!
Joe
Joseph Dien, Senior Research Scientist University of Maryland
E-mail: jdien07@mac.com mailto:jdien07@mac.com Phone: 301-226-8848 Fax: 301-226-8811 http://joedien.com//
Oh duh. Okay, thanks!
Joe
On May 30, 2013, at 5:38 PM, Douglas N Greve greve@nmr.mgh.harvard.edu wrote:
That is a surface file. Each of the 163842 values corresponds to a vertex in the surface. If you want xyz, you need to load in the surface. You can also analyze the data in the native space if that would make it easier (but you can't surface smooth). doug
On 05/30/2013 05:08 PM, Joseph Dien wrote:
I tried using MRIread to look at the contents of the analysis files (using Fressurfer 5.2.0 under OS X 10.8.3 and Matlab 2013a):
mri = MRIread('ces.nii.gz',0);
but I'm getting one-dimensional vectors:
mri
mri =
srcbext: '' analyzehdr: [] bhdr: [] vol: [1x163842 double] niftihdr: [1x1 struct] fspec: 'ces.nii.gz' pwd: '/Volumes/Data/CP1/fsfast/CPA003/bold/CPA.sm05.lh/CS-v-OTHERS' flip_angle: 0 tr: 2000 te: 0 ti: 0 vox2ras0: [4x4 double] volsize: [1 163842 1] height: 1 width: 163842 depth: 1 nframes: 1 vox2ras: [4x4 double] nvoxels: 163842 xsize: 1.0000 ysize: 1.0000 zsize: 1.0000 x_r: -0.9999 x_a: 0.0067 x_s: -0.0150 y_r: 4.1714e-08 y_a: 0.9131 y_s: 0.4078 z_r: -0.0164 z_a: -0.4077 z_s: 0.9130 c_r: -6.8259e+04 c_a: 465.0319 c_s: -995.9002 vox2ras1: [4x4 double] Mdc: [3x3 double] volres: [1.0000 1.0000 1.0000] tkrvox2ras: [4x4 double]
It's fine when I read one of the functional files (f.nii.gz). Am I doing something wrong? Or if it is supposed to be like this, how do I convert to XYZ coordinates? The vox2ras fields are expecting a four-dimensional matrix.
Thanks!
Joe
Joseph Dien, Senior Research Scientist University of Maryland
E-mail: jdien07@mac.com mailto:jdien07@mac.com Phone: 301-226-8848 Fax: 301-226-8811 http://joedien.com//
-- Douglas N. Greve, Ph.D. MGH-NMR Center greve@nmr.mgh.harvard.edu Phone Number: 617-724-2358 Fax: 617-726-7422
Bugs: surfer.nmr.mgh.harvard.edu/fswiki/BugReporting FileDrop: https://gate.nmr.mgh.harvard.edu/filedrop2 www.nmr.mgh.harvard.edu/facility/filedrop/index.html Outgoing: ftp://surfer.nmr.mgh.harvard.edu/transfer/outgoing/flat/greve/
The information in this e-mail is intended only for the person to whom it is addressed. If you believe this e-mail was sent to you in error and the e-mail contains patient information, please contact the Partners Compliance HelpLine at http://www.partners.org/complianceline . If the e-mail was sent to you in error but does not contain patient information, please contact the sender and properly dispose of the e-mail.
--------------------------------------------------------------------------------
Joseph Dien, Senior Research Scientist University of Maryland
E-mail: jdien07@mac.com Phone: 301-226-8848 Fax: 301-226-8811 http://joedien.com//
I was able to make more progress so I'm mostly good at this point but I have a remaining question:
I assume the contents of sig.nii.gz (which I assume are the vertex p-values) are not FWE corrected. Is it possible to get FWE-corrected vertex p-values? Or are only clusterwise corrections available?
Thanks again for your patience!
Joe
On May 30, 2013, at 4:37 PM, Joseph Dien jdien07@mac.com wrote:
Just to make sure I'm doing this right, I'm going to summarize what I've taken away from your answers and to ask some new questions. In order to present the results, I need two things:
- A set of histograms (with error bars) for each cluster figure to show the % signal change for each of the four contrasts of interest.
The cache.th20.pos.y.ocn.dat file only gives it for the condition where the cluster was significant so I can't use that. So I could use mri_label2vol to convert cache.th20.neg.sig.ocn.annot from the group level analysis to generate a mask for each cluster of interest. Then I could extract the value of the voxels from each subject's cespct file for each contrast, average them across the cluster ROI, then average them across each subject, to generate the histogram? This would suffice to give me the %age signal change? I would be doing these computations in Matlab using MRIread.
- A results table with the headings:
Cluster p (FWE corrected) Cluster size Peak Voxel p (FWE corrected) Peak Voxel T Peak Voxel Coords BA Anatomical Landmark
I can get the first two from the cache.th20.pos/neg.sig.cluster.summary files from the group level analysis. I can get the peak voxel coordinates from the summary files as well. I can use this to get the peak voxel p from the group level sig.nii.gz file. Is this FWE corrected? If not, how can I get this information? I can use these coordinates to get the peak voxel T by getting the value from the group level F.nii.gz file and taking its square root. How can I get the sign of the T statistic? I can use the Lancaster transform to convert the MNI305 peak voxel coordinates into the Atlas coordinates to look up the putative BA and landmarks (unless there is a better way with Freesurfer? I'm seeing some references to some BA labels in the forum but it doesn't look like this is a complete set yet?).
Sorry for all these questions! I got some nice results from FSFAST and would like to get them written up.
Cheers!
Joe
On May 29, 2013, at 10:53 PM, Douglas Greve greve@nmr.mgh.harvard.edu wrote:
On 5/29/13 10:42 PM, Joseph Dien wrote:
On May 29, 2013, at 11:40 AM, Douglas N Greve greve@NMR.MGH.HARVARD.EDU wrote:
Hi Joe,
On 05/29/2013 01:00 AM, Joseph Dien wrote:
I need to extract the beta weights from a cluster identified with FS-Fast in order to compute percentage signal change.
- I see a file called beta.nii.gz that appears to have the beta
weight information. It has a four dimensional structure and the fourth dimension appears to be the beta weights. Is there an index somewhere as to which beta weight is which? Or if not, how are they organized?
For the first level analysis, the first N beta weights correspond to the N conditions in the paradigm file. The rest are nuisance variables.
Ah, very good! In order to compute the percent signal change statistic (I'm following the MarsBaR approach: http://marsbar.sourceforge.net/faq.html#how-is-the-percent-signal-change-cal...) I'm also going to need the beta weights for the session mean regressors. How are the nuisance regressors organized?
You can just use the meanfunc.nii.gz. Also, each contrasts is computed as the simple contrast (ces) and as a percent of the baseline at the voxel (cespct, cesvarpct).
- In order to extract the cluster, it looks like I would
use mri_label2vol to convert cache.th20.neg.sig.ocn.annot into a volume where the voxels are tagged with the number of the corresponding cluster.
Is that from a group analysis?
Yes, that's right.
I could then use that to generate masks to extract the information I need for each cluster from beta.nii.gz.
If this is from a group analysis, then there should already be a file there (something.y.ocn.dat) that has a value for each subject in the rows and a value for each cluster in the columns.
I see it. Are these values already scaled as percent signal change? If so, that would be wonderful! :)
Only if you specified it when you ran isxconcat-sess. Note that the "non-scaled" values are actually scaled to percent of grand mean intensity.
Is that correct?
- The final information that I would need is the canonical hrf shape
generated by FSFAST for a single event. I guess I could generate that by setting up a dummy analysis run with a single event of the desired duration and then look in the X variable in the resulting X.mat file?
try this plot(X.runflac(1).flac.ev(2).tirf, X.runflac(1).flac.ev(2).Xirf)
Perfect! :)
Sorry for all the questions!
Joe
Joseph Dien, Senior Research Scientist University of Maryland
E-mail: jdien07@mac.com mailto:jdien07@mac.com Phone: 301-226-8848 Fax: 301-226-8811 http://joedien.com//
Freesurfer mailing list Freesurfer@nmr.mgh.harvard.edu https://mail.nmr.mgh.harvard.edu/mailman/listinfo/freesurfer
-- Douglas N. Greve, Ph.D. MGH-NMR Center greve@nmr.mgh.harvard.edu Phone Number: 617-724-2358 Fax: 617-726-7422
Bugs: surfer.nmr.mgh.harvard.edu/fswiki/BugReporting FileDrop: https://gate.nmr.mgh.harvard.edu/filedrop2 www.nmr.mgh.harvard.edu/facility/filedrop/index.html Outgoing: ftp://surfer.nmr.mgh.harvard.edu/transfer/outgoing/flat/greve/
Freesurfer mailing list Freesurfer@nmr.mgh.harvard.edu https://mail.nmr.mgh.harvard.edu/mailman/listinfo/freesurfer
The information in this e-mail is intended only for the person to whom it is addressed. If you believe this e-mail was sent to you in error and the e-mail contains patient information, please contact the Partners Compliance HelpLine at http://www.partners.org/complianceline . If the e-mail was sent to you in error but does not contain patient information, please contact the sender and properly dispose of the e-mail.
Joseph Dien, Senior Research Scientist University of Maryland
E-mail: jdien07@mac.com Phone: 301-226-8848 Fax: 301-226-8811 http://joedien.com//
Freesurfer mailing list Freesurfer@nmr.mgh.harvard.edu https://mail.nmr.mgh.harvard.edu/mailman/listinfo/freesurfer
The information in this e-mail is intended only for the person to whom it is addressed. If you believe this e-mail was sent to you in error and the e-mail contains patient information, please contact the Partners Compliance HelpLine at http://www.partners.org/complianceline . If the e-mail was sent to you in error but does not contain patient information, please contact the sender and properly dispose of the e-mail.
--------------------------------------------------------------------------------
Joseph Dien, Senior Research Scientist University of Maryland
E-mail: jdien07@mac.com Phone: 301-226-8848 Fax: 301-226-8811 http://joedien.com//
On 05/31/2013 01:49 AM, Joseph Dien wrote:
I was able to make more progress so I'm mostly good at this point but I have a remaining question:
I assume the contents of sig.nii.gz (which I assume are the vertex p-values) are not FWE corrected. Is it possible to get FWE-corrected vertex p-values? Or are only clusterwise corrections available?
There should be something like cache.th13.abs.sig.voxel.mgh which is corrected on a voxelwise basis (the th13 is just part of the name but it should be the same regardless of the threshold you choose) doug
Thanks again for your patience!
Joe
On May 30, 2013, at 4:37 PM, Joseph Dien <jdien07@mac.com mailto:jdien07@mac.com> wrote:
Just to make sure I'm doing this right, I'm going to summarize what I've taken away from your answers and to ask some new questions. In order to present the results, I need two things:
- A set of histograms (with error bars) for each cluster figure to
show the % signal change for each of the four contrasts of interest. The cache.th20.pos.y.ocn.dat file only gives it for the condition where the cluster was significant so I can't use that. So I could use mri_label2vol to convert cache.th20.neg.sig.ocn.annot from the group level analysis to generate a mask for each cluster of interest. Then I could extract the value of the voxels from each subject's cespct file for each contrast, average them across the cluster ROI, then average them across each subject, to generate the histogram? This would suffice to give me the %age signal change? I would be doing these computations in Matlab using MRIread.
- A results table with the headings:
Cluster p (FWE corrected) Cluster size Peak Voxel p (FWE corrected) Peak Voxel T Peak Voxel Coords BA Anatomical Landmark
I can get the first two from the cache.th20.pos/neg.sig.cluster.summary files from the group level analysis. I can get the peak voxel coordinates from the summary files as well. I can use this to get the peak voxel p from the group level sig.nii.gz file. Is this FWE corrected? If not, how can I get this information? I can use these coordinates to get the peak voxel T by getting the value from the group level F.nii.gz file and taking its square root. How can I get the sign of the T statistic? I can use the Lancaster transform to convert the MNI305 peak voxel coordinates into the Atlas coordinates to look up the putative BA and landmarks (unless there is a better way with Freesurfer? I'm seeing some references to some BA labels in the forum but it doesn't look like this is a complete set yet?).
Sorry for all these questions! I got some nice results from FSFAST and would like to get them written up.
Cheers!
Joe
On May 29, 2013, at 10:53 PM, Douglas Greve <greve@nmr.mgh.harvard.edu mailto:greve@nmr.mgh.harvard.edu> wrote:
On 5/29/13 10:42 PM, Joseph Dien wrote:
On May 29, 2013, at 11:40 AM, Douglas N Greve <greve@NMR.MGH.HARVARD.EDU mailto:greve@NMR.MGH.HARVARD.EDU> wrote:
Hi Joe,
On 05/29/2013 01:00 AM, Joseph Dien wrote:
I need to extract the beta weights from a cluster identified with FS-Fast in order to compute percentage signal change.
- I see a file called beta.nii.gz that appears to have the beta
weight information. It has a four dimensional structure and the fourth dimension appears to be the beta weights. Is there an index somewhere as to which beta weight is which? Or if not, how are they organized?
For the first level analysis, the first N beta weights correspond to the N conditions in the paradigm file. The rest are nuisance variables.
Ah, very good! In order to compute the percent signal change statistic (I'm following the MarsBaR approach: http://marsbar.sourceforge.net/faq.html#how-is-the-percent-signal-change-cal...) I'm also going to need the beta weights for the session mean regressors. How are the nuisance regressors organized?
You can just use the meanfunc.nii.gz. Also, each contrasts is computed as the simple contrast (ces) and as a percent of the baseline at the voxel (cespct, cesvarpct).
- In order to extract the cluster, it looks like I would
use mri_label2vol to convert cache.th20.neg.sig.ocn.annot into a volume where the voxels are tagged with the number of the corresponding cluster.
Is that from a group analysis?
Yes, that's right.
I could then use that to generate masks to extract the information I need for each cluster from beta.nii.gz.
If this is from a group analysis, then there should already be a file there (something.y.ocn.dat) that has a value for each subject in the rows and a value for each cluster in the columns.
I see it. Are these values already scaled as percent signal change? If so, that would be wonderful! :)
Only if you specified it when you ran isxconcat-sess. Note that the "non-scaled" values are actually scaled to percent of grand mean intensity.
Is that correct?
- The final information that I would need is the canonical hrf
shape generated by FSFAST for a single event. I guess I could generate that by setting up a dummy analysis run with a single event of the desired duration and then look in the X variable in the resulting X.mat file?
try this plot(X.runflac(1).flac.ev(2).tirf, X.runflac(1).flac.ev(2).Xirf)
Perfect! :)
Sorry for all the questions!
Joe
Joseph Dien, Senior Research Scientist University of Maryland
E-mail: jdien07@mac.com mailto:jdien07@mac.com mailto:jdien07@mac.com Phone: 301-226-8848 Fax: 301-226-8811 http://joedien.com//
Freesurfer mailing list Freesurfer@nmr.mgh.harvard.edu https://mail.nmr.mgh.harvard.edu/mailman/listinfo/freesurfer
-- Douglas N. Greve, Ph.D. MGH-NMR Center greve@nmr.mgh.harvard.edu mailto:greve@nmr.mgh.harvard.edu Phone Number: 617-724-2358 Fax: 617-726-7422
Bugs: surfer.nmr.mgh.harvard.edu/fswiki/BugReporting FileDrop: https://gate.nmr.mgh.harvard.edu/filedrop2 www.nmr.mgh.harvard.edu/facility/filedrop/index.html Outgoing: ftp://surfer.nmr.mgh.harvard.edu/transfer/outgoing/flat/greve/
Freesurfer mailing list Freesurfer@nmr.mgh.harvard.edu https://mail.nmr.mgh.harvard.edu/mailman/listinfo/freesurfer
The information in this e-mail is intended only for the person to whom it is addressed. If you believe this e-mail was sent to you in error and the e-mail contains patient information, please contact the Partners Compliance HelpLine at http://www.partners.org/complianceline . If the e-mail was sent to you in error but does not contain patient information, please contact the sender and properly dispose of the e-mail.
Joseph Dien, Senior Research Scientist University of Maryland
E-mail: jdien07@mac.com mailto:jdien07@mac.com Phone: 301-226-8848 Fax: 301-226-8811 http://joedien.com//
Freesurfer mailing list Freesurfer@nmr.mgh.harvard.edu mailto:Freesurfer@nmr.mgh.harvard.edu https://mail.nmr.mgh.harvard.edu/mailman/listinfo/freesurfer
The information in this e-mail is intended only for the person to whom it is addressed. If you believe this e-mail was sent to you in error and the e-mail contains patient information, please contact the Partners Compliance HelpLine at http://www.partners.org/complianceline . If the e-mail was sent to you in error but does not contain patient information, please contact the sender and properly dispose of the e-mail.
Joseph Dien, Senior Research Scientist University of Maryland
E-mail: jdien07@mac.com mailto:jdien07@mac.com Phone: 301-226-8848 Fax: 301-226-8811 http://joedien.com//
On May 31, 2013, at 12:11 PM, Douglas N Greve greve@nmr.mgh.harvard.edu wrote:
On 05/31/2013 01:49 AM, Joseph Dien wrote:
I was able to make more progress so I'm mostly good at this point but I have a remaining question:
I assume the contents of sig.nii.gz (which I assume are the vertex p-values) are not FWE corrected. Is it possible to get FWE-corrected vertex p-values? Or are only clusterwise corrections available?
There should be something like cache.th13.abs.sig.voxel.mgh which is corrected on a voxelwise basis (the th13 is just part of the name but it should be the same regardless of the threshold you choose) doug
Excellent! Thanks! :)
Thanks again for your patience!
Joe
On May 30, 2013, at 4:37 PM, Joseph Dien <jdien07@mac.com mailto:jdien07@mac.com> wrote:
Just to make sure I'm doing this right, I'm going to summarize what I've taken away from your answers and to ask some new questions. In order to present the results, I need two things:
- A set of histograms (with error bars) for each cluster figure to
show the % signal change for each of the four contrasts of interest. The cache.th20.pos.y.ocn.dat file only gives it for the condition where the cluster was significant so I can't use that. So I could use mri_label2vol to convert cache.th20.neg.sig.ocn.annot from the group level analysis to generate a mask for each cluster of interest. Then I could extract the value of the voxels from each subject's cespct file for each contrast, average them across the cluster ROI, then average them across each subject, to generate the histogram? This would suffice to give me the %age signal change? I would be doing these computations in Matlab using MRIread.
- A results table with the headings:
Cluster p (FWE corrected) Cluster size Peak Voxel p (FWE corrected) Peak Voxel T Peak Voxel Coords BA Anatomical Landmark
I can get the first two from the cache.th20.pos/neg.sig.cluster.summary files from the group level analysis. I can get the peak voxel coordinates from the summary files as well. I can use this to get the peak voxel p from the group level sig.nii.gz file. Is this FWE corrected? If not, how can I get this information? I can use these coordinates to get the peak voxel T by getting the value from the group level F.nii.gz file and taking its square root. How can I get the sign of the T statistic? I can use the Lancaster transform to convert the MNI305 peak voxel coordinates into the Atlas coordinates to look up the putative BA and landmarks (unless there is a better way with Freesurfer? I'm seeing some references to some BA labels in the forum but it doesn't look like this is a complete set yet?).
Sorry for all these questions! I got some nice results from FSFAST and would like to get them written up.
Cheers!
Joe
On May 29, 2013, at 10:53 PM, Douglas Greve <greve@nmr.mgh.harvard.edu mailto:greve@nmr.mgh.harvard.edu> wrote:
On 5/29/13 10:42 PM, Joseph Dien wrote:
On May 29, 2013, at 11:40 AM, Douglas N Greve <greve@NMR.MGH.HARVARD.EDU mailto:greve@NMR.MGH.HARVARD.EDU> wrote:
Hi Joe,
On 05/29/2013 01:00 AM, Joseph Dien wrote: > I need to extract the beta weights from a cluster identified with > FS-Fast in order to compute percentage signal change. > > 1) I see a file called beta.nii.gz that appears to have the beta > weight information. It has a four dimensional structure and the > fourth dimension appears to be the beta weights. Is there an index > somewhere as to which beta weight is which? Or if not, how are they > organized? For the first level analysis, the first N beta weights correspond to the N conditions in the paradigm file. The rest are nuisance variables. >
Ah, very good! In order to compute the percent signal change statistic (I'm following the MarsBaR approach: http://marsbar.sourceforge.net/faq.html#how-is-the-percent-signal-change-cal...) I'm also going to need the beta weights for the session mean regressors. How are the nuisance regressors organized?
You can just use the meanfunc.nii.gz. Also, each contrasts is computed as the simple contrast (ces) and as a percent of the baseline at the voxel (cespct, cesvarpct).
> 2) In order to extract the cluster, it looks like I would > use mri_label2vol to convert cache.th20.neg.sig.ocn.annot into a > volume where the voxels are tagged with the number of the > corresponding cluster. Is that from a group analysis? >
Yes, that's right.
> I could then use that to generate masks to extract the information I > need for each cluster from beta.nii.gz. If this is from a group analysis, then there should already be a file there (something.y.ocn.dat) that has a value for each subject in the rows and a value for each cluster in the columns. >
I see it. Are these values already scaled as percent signal change? If so, that would be wonderful! :)
Only if you specified it when you ran isxconcat-sess. Note that the "non-scaled" values are actually scaled to percent of grand mean intensity.
> Is that correct? > > 3) The final information that I would need is the canonical hrf > shape > generated by FSFAST for a single event. I guess I could generate > that > by setting up a dummy analysis run with a single event of the > desired > duration and then look in the X variable in the resulting X.mat file? try this plot(X.runflac(1).flac.ev(2).tirf, X.runflac(1).flac.ev(2).Xirf) >
Perfect! :)
> Sorry for all the questions! > > Joe > > > > > -------------------------------------------------------------------------------- > > Joseph Dien, > Senior Research Scientist > University of Maryland > > E-mail: jdien07@mac.com mailto:jdien07@mac.com > mailto:jdien07@mac.com > Phone: 301-226-8848 > Fax: 301-226-8811 > http://joedien.com// > > > > > > > > > > > > > > _______________________________________________ > Freesurfer mailing list > Freesurfer@nmr.mgh.harvard.edu > https://mail.nmr.mgh.harvard.edu/mailman/listinfo/freesurfer
-- Douglas N. Greve, Ph.D. MGH-NMR Center greve@nmr.mgh.harvard.edu mailto:greve@nmr.mgh.harvard.edu Phone Number: 617-724-2358 Fax: 617-726-7422
Bugs: surfer.nmr.mgh.harvard.edu/fswiki/BugReporting FileDrop: https://gate.nmr.mgh.harvard.edu/filedrop2 www.nmr.mgh.harvard.edu/facility/filedrop/index.html Outgoing: ftp://surfer.nmr.mgh.harvard.edu/transfer/outgoing/flat/greve/
Freesurfer mailing list Freesurfer@nmr.mgh.harvard.edu https://mail.nmr.mgh.harvard.edu/mailman/listinfo/freesurfer
The information in this e-mail is intended only for the person to whom it is addressed. If you believe this e-mail was sent to you in error and the e-mail contains patient information, please contact the Partners Compliance HelpLine at http://www.partners.org/complianceline . If the e-mail was sent to you in error but does not contain patient information, please contact the sender and properly dispose of the e-mail.
Joseph Dien, Senior Research Scientist University of Maryland
E-mail: jdien07@mac.com mailto:jdien07@mac.com Phone: 301-226-8848 Fax: 301-226-8811 http://joedien.com//
Freesurfer mailing list Freesurfer@nmr.mgh.harvard.edu mailto:Freesurfer@nmr.mgh.harvard.edu https://mail.nmr.mgh.harvard.edu/mailman/listinfo/freesurfer
The information in this e-mail is intended only for the person to whom it is addressed. If you believe this e-mail was sent to you in error and the e-mail contains patient information, please contact the Partners Compliance HelpLine at http://www.partners.org/complianceline . If the e-mail was sent to you in error but does not contain patient information, please contact the sender and properly dispose of the e-mail.
Joseph Dien, Senior Research Scientist University of Maryland
E-mail: jdien07@mac.com mailto:jdien07@mac.com Phone: 301-226-8848 Fax: 301-226-8811 http://joedien.com//
Freesurfer mailing list Freesurfer@nmr.mgh.harvard.edu mailto:Freesurfer@nmr.mgh.harvard.edu https://mail.nmr.mgh.harvard.edu/mailman/listinfo/freesurfer
The information in this e-mail is intended only for the person to whom it is addressed. If you believe this e-mail was sent to you in error and the e-mail contains patient information, please contact the Partners Compliance HelpLine at http://www.partners.org/complianceline . If the e-mail was sent to you in error but does not contain patient information, please contact the sender and properly dispose of the e-mail.
Joseph Dien, Senior Research Scientist University of Maryland
E-mail: jdien07@mac.com mailto:jdien07@mac.com Phone: 301-226-8848 Fax: 301-226-8811 http://joedien.com//
-- Douglas N. Greve, Ph.D. MGH-NMR Center greve@nmr.mgh.harvard.edu Phone Number: 617-724-2358 Fax: 617-726-7422
Bugs: surfer.nmr.mgh.harvard.edu/fswiki/BugReporting FileDrop: https://gate.nmr.mgh.harvard.edu/filedrop2 www.nmr.mgh.harvard.edu/facility/filedrop/index.html Outgoing: ftp://surfer.nmr.mgh.harvard.edu/transfer/outgoing/flat/greve/
Freesurfer mailing list Freesurfer@nmr.mgh.harvard.edu https://mail.nmr.mgh.harvard.edu/mailman/listinfo/freesurfer
--------------------------------------------------------------------------------
Joseph Dien, Senior Research Scientist University of Maryland
E-mail: jdien07@mac.com Phone: 301-226-8848 Fax: 301-226-8811 http://joedien.com//
It looks like the corrected vertex p-values (ex: cache.th13.abs.sig.voxel.nii.gz) are only available for the surface-based lh and rh spaces. For the subcortical volume-based analysis I don't see the corresponding corrected voxel p-values being available?
On May 31, 2013, at 2:46 PM, Joseph Dien jdien07@mac.com wrote:
On May 31, 2013, at 12:11 PM, Douglas N Greve greve@nmr.mgh.harvard.edu wrote:
On 05/31/2013 01:49 AM, Joseph Dien wrote:
I was able to make more progress so I'm mostly good at this point but I have a remaining question:
I assume the contents of sig.nii.gz (which I assume are the vertex p-values) are not FWE corrected. Is it possible to get FWE-corrected vertex p-values? Or are only clusterwise corrections available?
There should be something like cache.th13.abs.sig.voxel.mgh which is corrected on a voxelwise basis (the th13 is just part of the name but it should be the same regardless of the threshold you choose) doug
Excellent! Thanks! :)
Thanks again for your patience!
Joe
On May 30, 2013, at 4:37 PM, Joseph Dien <jdien07@mac.com mailto:jdien07@mac.com> wrote:
Just to make sure I'm doing this right, I'm going to summarize what I've taken away from your answers and to ask some new questions. In order to present the results, I need two things:
- A set of histograms (with error bars) for each cluster figure to
show the % signal change for each of the four contrasts of interest. The cache.th20.pos.y.ocn.dat file only gives it for the condition where the cluster was significant so I can't use that. So I could use mri_label2vol to convert cache.th20.neg.sig.ocn.annot from the group level analysis to generate a mask for each cluster of interest. Then I could extract the value of the voxels from each subject's cespct file for each contrast, average them across the cluster ROI, then average them across each subject, to generate the histogram? This would suffice to give me the %age signal change? I would be doing these computations in Matlab using MRIread.
- A results table with the headings:
Cluster p (FWE corrected) Cluster size Peak Voxel p (FWE corrected) Peak Voxel T Peak Voxel Coords BA Anatomical Landmark
I can get the first two from the cache.th20.pos/neg.sig.cluster.summary files from the group level analysis. I can get the peak voxel coordinates from the summary files as well. I can use this to get the peak voxel p from the group level sig.nii.gz file. Is this FWE corrected? If not, how can I get this information? I can use these coordinates to get the peak voxel T by getting the value from the group level F.nii.gz file and taking its square root. How can I get the sign of the T statistic? I can use the Lancaster transform to convert the MNI305 peak voxel coordinates into the Atlas coordinates to look up the putative BA and landmarks (unless there is a better way with Freesurfer? I'm seeing some references to some BA labels in the forum but it doesn't look like this is a complete set yet?).
Sorry for all these questions! I got some nice results from FSFAST and would like to get them written up.
Cheers!
Joe
On May 29, 2013, at 10:53 PM, Douglas Greve <greve@nmr.mgh.harvard.edu mailto:greve@nmr.mgh.harvard.edu> wrote:
On 5/29/13 10:42 PM, Joseph Dien wrote:
On May 29, 2013, at 11:40 AM, Douglas N Greve <greve@NMR.MGH.HARVARD.EDU mailto:greve@NMR.MGH.HARVARD.EDU> wrote:
> Hi Joe, > > On 05/29/2013 01:00 AM, Joseph Dien wrote: >> I need to extract the beta weights from a cluster identified with >> FS-Fast in order to compute percentage signal change. >> >> 1) I see a file called beta.nii.gz that appears to have the beta >> weight information. It has a four dimensional structure and the >> fourth dimension appears to be the beta weights. Is there an index >> somewhere as to which beta weight is which? Or if not, how are they >> organized? > For the first level analysis, the first N beta weights correspond > to the > N conditions in the paradigm file. The rest are nuisance variables. >>
Ah, very good! In order to compute the percent signal change statistic (I'm following the MarsBaR approach: http://marsbar.sourceforge.net/faq.html#how-is-the-percent-signal-change-cal...) I'm also going to need the beta weights for the session mean regressors. How are the nuisance regressors organized?
You can just use the meanfunc.nii.gz. Also, each contrasts is computed as the simple contrast (ces) and as a percent of the baseline at the voxel (cespct, cesvarpct).
>> 2) In order to extract the cluster, it looks like I would >> use mri_label2vol to convert cache.th20.neg.sig.ocn.annot into a >> volume where the voxels are tagged with the number of the >> corresponding cluster. > Is that from a group analysis? >>
Yes, that's right.
>> I could then use that to generate masks to extract the information I >> need for each cluster from beta.nii.gz. > If this is from a group analysis, then there should already be a file > there (something.y.ocn.dat) that has a value for each subject in the > rows and a value for each cluster in the columns. >>
I see it. Are these values already scaled as percent signal change? If so, that would be wonderful! :)
Only if you specified it when you ran isxconcat-sess. Note that the "non-scaled" values are actually scaled to percent of grand mean intensity.
>> Is that correct? >> >> 3) The final information that I would need is the canonical hrf >> shape >> generated by FSFAST for a single event. I guess I could generate >> that >> by setting up a dummy analysis run with a single event of the >> desired >> duration and then look in the X variable in the resulting X.mat file? > try this > plot(X.runflac(1).flac.ev(2).tirf, X.runflac(1).flac.ev(2).Xirf) >>
Perfect! :)
>> Sorry for all the questions! >> >> Joe >> >> >> >>
Oh, right, it is probably not there for subcortical. I don't know what I would have to do to write it out. It won't be something that happens before I get back from HBM. Can you remind me after HBM? doug
On 05/31/2013 04:44 PM, Joseph Dien wrote:
It looks like the corrected vertex p-values (ex: cache.th13.abs.sig.voxel.nii.gz) are only available for the surface-based lh and rh spaces. For the subcortical volume-based analysis I don't see the corresponding corrected voxel p-values being available?
On May 31, 2013, at 2:46 PM, Joseph Dien <jdien07@mac.com mailto:jdien07@mac.com> wrote:
On May 31, 2013, at 12:11 PM, Douglas N Greve <greve@nmr.mgh.harvard.edu mailto:greve@nmr.mgh.harvard.edu> wrote:
On 05/31/2013 01:49 AM, Joseph Dien wrote:
I was able to make more progress so I'm mostly good at this point but I have a remaining question:
I assume the contents of sig.nii.gz (which I assume are the vertex p-values) are not FWE corrected. Is it possible to get FWE-corrected vertex p-values? Or are only clusterwise corrections available?
There should be something like cache.th13.abs.sig.voxel.mgh which is corrected on a voxelwise basis (the th13 is just part of the name but it should be the same regardless of the threshold you choose) doug
Excellent! Thanks! :)
Thanks again for your patience!
Joe
On May 30, 2013, at 4:37 PM, Joseph Dien <jdien07@mac.com mailto:jdien07@mac.com mailto:jdien07@mac.com> wrote:
Just to make sure I'm doing this right, I'm going to summarize what I've taken away from your answers and to ask some new questions. In order to present the results, I need two things:
- A set of histograms (with error bars) for each cluster figure to
show the % signal change for each of the four contrasts of interest. The cache.th20.pos.y.ocn.dat file only gives it for the condition where the cluster was significant so I can't use that. So I could use mri_label2vol to convert cache.th20.neg.sig.ocn.annot from the group level analysis to generate a mask for each cluster of interest. Then I could extract the value of the voxels from each subject's cespct file for each contrast, average them across the cluster ROI, then average them across each subject, to generate the histogram? This would suffice to give me the %age signal change? I would be doing these computations in Matlab using MRIread.
- A results table with the headings:
Cluster p (FWE corrected) Cluster size Peak Voxel p (FWE corrected) Peak Voxel T Peak Voxel Coords BA Anatomical Landmark
I can get the first two from the cache.th20.pos/neg.sig.cluster.summary files from the group level analysis. I can get the peak voxel coordinates from the summary files as well. I can use this to get the peak voxel p from the group level sig.nii.gz file. Is this FWE corrected? If not, how can I get this information? I can use these coordinates to get the peak voxel T by getting the value from the group level F.nii.gz file and taking its square root. How can I get the sign of the T statistic? I can use the Lancaster transform to convert the MNI305 peak voxel coordinates into the Atlas coordinates to look up the putative BA and landmarks (unless there is a better way with Freesurfer? I'm seeing some references to some BA labels in the forum but it doesn't look like this is a complete set yet?).
Sorry for all these questions! I got some nice results from FSFAST and would like to get them written up.
Cheers!
Joe
On May 29, 2013, at 10:53 PM, Douglas Greve <greve@nmr.mgh.harvard.edu mailto:greve@nmr.mgh.harvard.edu mailto:greve@nmr.mgh.harvard.edu> wrote:
On 5/29/13 10:42 PM, Joseph Dien wrote: > > On May 29, 2013, at 11:40 AM, Douglas N Greve > <greve@NMR.MGH.HARVARD.EDU mailto:greve@NMR.MGH.HARVARD.EDU > mailto:greve@NMR.MGH.HARVARD.EDU> wrote: > >> Hi Joe, >> >> On 05/29/2013 01:00 AM, Joseph Dien wrote: >>> I need to extract the beta weights from a cluster identified with >>> FS-Fast in order to compute percentage signal change. >>> >>> 1) I see a file called beta.nii.gz that appears to have the beta >>> weight information. It has a four dimensional structure and the >>> fourth dimension appears to be the beta weights. Is there an >>> index >>> somewhere as to which beta weight is which? Or if not, how >>> are they >>> organized? >> For the first level analysis, the first N beta weights correspond >> to the >> N conditions in the paradigm file. The rest are nuisance variables. >>> > > Ah, very good! In order to compute the percent signal change > statistic (I'm following the MarsBaR approach: > http://marsbar.sourceforge.net/faq.html#how-is-the-percent-signal-change-cal...) > > I'm also going to need the beta weights for the session mean > regressors. How are the nuisance regressors organized? You can just use the meanfunc.nii.gz. Also, each contrasts is computed as the simple contrast (ces) and as a percent of the baseline at the voxel (cespct, cesvarpct). > >>> 2) In order to extract the cluster, it looks like I would >>> use mri_label2vol to convert cache.th20.neg.sig.ocn.annot into a >>> volume where the voxels are tagged with the number of the >>> corresponding cluster. >> Is that from a group analysis? >>> > > Yes, that's right. > >>> I could then use that to generate masks to extract the >>> information I >>> need for each cluster from beta.nii.gz. >> If this is from a group analysis, then there should already be >> a file >> there (something.y.ocn.dat) that has a value for each subject >> in the >> rows and a value for each cluster in the columns. >>> > > I see it. Are these values already scaled as percent signal > change? If so, that would be wonderful! :) Only if you specified it when you ran isxconcat-sess. Note that the "non-scaled" values are actually scaled to percent of grand mean intensity. > >>> Is that correct? >>> >>> 3) The final information that I would need is the canonical hrf >>> shape >>> generated by FSFAST for a single event. I guess I could generate >>> that >>> by setting up a dummy analysis run with a single event of the >>> desired >>> duration and then look in the X variable in the resulting >>> X.mat file? >> try this >> plot(X.runflac(1).flac.ev(2).tirf, X.runflac(1).flac.ev(2).Xirf) >>> > > Perfect! :) > >>> Sorry for all the questions! >>> >>> Joe >>> >>> >>> >>>
I implemented the ROI percent signal change formula following the MarsBaR FAQ (http://marsbar.sourceforge.net/faq.html) but the values I'm getting seem too small (on the order of .0002%). Basically the formula is the (beta * peak absolute value of the canonical HRF regressor * 100)/(run mean). No derivatives in this case as it is a boxcar design.
I took the mean across all the runs since FSFAST uses the same regressor across the entire experiment (unlike SPM). I used the X.runflac(1).flac.ev(m).Xirf values for the canonical HRF as you suggested (where m equals the condition+1).
Is it possible that I'm missing something in the scaling here? Especially with a boxcar design, the signal change should be much larger than this for a significant cluster, I think. For example, the peak HRF value for one of the conditions is 0.0092. If the betas are already scaled according to the peak value, then it would come out as .02%, which is more reasonable, although still too small.
Thanks for your help with this!
Joe
On May 31, 2013, at 5:02 PM, Douglas N Greve greve@NMR.MGH.HARVARD.EDU wrote:
Oh, right, it is probably not there for subcortical. I don't know what I would have to do to write it out. It won't be something that happens before I get back from HBM. Can you remind me after HBM? doug
On 05/31/2013 04:44 PM, Joseph Dien wrote:
It looks like the corrected vertex p-values (ex: cache.th13.abs.sig.voxel.nii.gz) are only available for the surface-based lh and rh spaces. For the subcortical volume-based analysis I don't see the corresponding corrected voxel p-values being available?
On May 31, 2013, at 2:46 PM, Joseph Dien <jdien07@mac.com mailto:jdien07@mac.com> wrote:
On May 31, 2013, at 12:11 PM, Douglas N Greve <greve@nmr.mgh.harvard.edu mailto:greve@nmr.mgh.harvard.edu> wrote:
On 05/31/2013 01:49 AM, Joseph Dien wrote:
I was able to make more progress so I'm mostly good at this point but I have a remaining question:
I assume the contents of sig.nii.gz (which I assume are the vertex p-values) are not FWE corrected. Is it possible to get FWE-corrected vertex p-values? Or are only clusterwise corrections available?
There should be something like cache.th13.abs.sig.voxel.mgh which is corrected on a voxelwise basis (the th13 is just part of the name but it should be the same regardless of the threshold you choose) doug
Excellent! Thanks! :)
Thanks again for your patience!
Joe
On May 30, 2013, at 4:37 PM, Joseph Dien <jdien07@mac.com mailto:jdien07@mac.com mailto:jdien07@mac.com> wrote:
Just to make sure I'm doing this right, I'm going to summarize what I've taken away from your answers and to ask some new questions. In order to present the results, I need two things:
- A set of histograms (with error bars) for each cluster figure to
show the % signal change for each of the four contrasts of interest. The cache.th20.pos.y.ocn.dat file only gives it for the condition where the cluster was significant so I can't use that. So I could use mri_label2vol to convert cache.th20.neg.sig.ocn.annot from the group level analysis to generate a mask for each cluster of interest. Then I could extract the value of the voxels from each subject's cespct file for each contrast, average them across the cluster ROI, then average them across each subject, to generate the histogram? This would suffice to give me the %age signal change? I would be doing these computations in Matlab using MRIread.
- A results table with the headings:
Cluster p (FWE corrected) Cluster size Peak Voxel p (FWE corrected) Peak Voxel T Peak Voxel Coords BA Anatomical Landmark
I can get the first two from the cache.th20.pos/neg.sig.cluster.summary files from the group level analysis. I can get the peak voxel coordinates from the summary files as well. I can use this to get the peak voxel p from the group level sig.nii.gz file. Is this FWE corrected? If not, how can I get this information? I can use these coordinates to get the peak voxel T by getting the value from the group level F.nii.gz file and taking its square root. How can I get the sign of the T statistic? I can use the Lancaster transform to convert the MNI305 peak voxel coordinates into the Atlas coordinates to look up the putative BA and landmarks (unless there is a better way with Freesurfer? I'm seeing some references to some BA labels in the forum but it doesn't look like this is a complete set yet?).
Sorry for all these questions! I got some nice results from FSFAST and would like to get them written up.
Cheers!
Joe
On May 29, 2013, at 10:53 PM, Douglas Greve <greve@nmr.mgh.harvard.edu mailto:greve@nmr.mgh.harvard.edu mailto:greve@nmr.mgh.harvard.edu> wrote:
> > On 5/29/13 10:42 PM, Joseph Dien wrote: >> >> On May 29, 2013, at 11:40 AM, Douglas N Greve >> <greve@NMR.MGH.HARVARD.EDU mailto:greve@NMR.MGH.HARVARD.EDU >> mailto:greve@NMR.MGH.HARVARD.EDU> wrote: >> >>> Hi Joe, >>> >>> On 05/29/2013 01:00 AM, Joseph Dien wrote: >>>> I need to extract the beta weights from a cluster identified with >>>> FS-Fast in order to compute percentage signal change. >>>> >>>> 1) I see a file called beta.nii.gz that appears to have the beta >>>> weight information. It has a four dimensional structure and the >>>> fourth dimension appears to be the beta weights. Is there an >>>> index >>>> somewhere as to which beta weight is which? Or if not, how >>>> are they >>>> organized? >>> For the first level analysis, the first N beta weights correspond >>> to the >>> N conditions in the paradigm file. The rest are nuisance variables. >>>> >> >> Ah, very good! In order to compute the percent signal change >> statistic (I'm following the MarsBaR approach: >> http://marsbar.sourceforge.net/faq.html#how-is-the-percent-signal-change-cal...) >> >> I'm also going to need the beta weights for the session mean >> regressors. How are the nuisance regressors organized? > You can just use the meanfunc.nii.gz. Also, each contrasts is > computed as the simple contrast (ces) and as a percent of the > baseline at the voxel (cespct, cesvarpct). >> >>>> 2) In order to extract the cluster, it looks like I would >>>> use mri_label2vol to convert cache.th20.neg.sig.ocn.annot into a >>>> volume where the voxels are tagged with the number of the >>>> corresponding cluster. >>> Is that from a group analysis? >>>> >> >> Yes, that's right. >> >>>> I could then use that to generate masks to extract the >>>> information I >>>> need for each cluster from beta.nii.gz. >>> If this is from a group analysis, then there should already be >>> a file >>> there (something.y.ocn.dat) that has a value for each subject >>> in the >>> rows and a value for each cluster in the columns. >>>> >> >> I see it. Are these values already scaled as percent signal >> change? If so, that would be wonderful! :) > Only if you specified it when you ran isxconcat-sess. Note that the > "non-scaled" values are actually scaled to percent of grand mean > intensity. >> >>>> Is that correct? >>>> >>>> 3) The final information that I would need is the canonical hrf >>>> shape >>>> generated by FSFAST for a single event. I guess I could generate >>>> that >>>> by setting up a dummy analysis run with a single event of the >>>> desired >>>> duration and then look in the X variable in the resulting >>>> X.mat file? >>> try this >>> plot(X.runflac(1).flac.ev(2).tirf, X.runflac(1).flac.ev(2).Xirf) >>>> >> >> Perfect! :) >> >>>> Sorry for all the questions! >>>> >>>> Joe >>>> >>>> >>>> >>>>
-- Douglas N. Greve, Ph.D. MGH-NMR Center greve@nmr.mgh.harvard.edu Phone Number: 617-724-2358 Fax: 617-726-7422
Bugs: surfer.nmr.mgh.harvard.edu/fswiki/BugReporting FileDrop: https://gate.nmr.mgh.harvard.edu/filedrop2 www.nmr.mgh.harvard.edu/facility/filedrop/index.html Outgoing: ftp://surfer.nmr.mgh.harvard.edu/transfer/outgoing/flat/greve/
Freesurfer mailing list Freesurfer@nmr.mgh.harvard.edu https://mail.nmr.mgh.harvard.edu/mailman/listinfo/freesurfer
The information in this e-mail is intended only for the person to whom it is addressed. If you believe this e-mail was sent to you in error and the e-mail contains patient information, please contact the Partners Compliance HelpLine at http://www.partners.org/complianceline . If the e-mail was sent to you in error but does not contain patient information, please contact the sender and properly dispose of the e-mail.
--------------------------------------------------------------------------------
Joseph Dien, Senior Research Scientist University of Maryland
E-mail: jdien07@mac.com Phone: 202-297-8117 http://joedien.com//
The beta's have already been scaled. What do you get if you just beta/runmean ?
On 07/17/2013 01:45 PM, Joseph Dien wrote:
I implemented the ROI percent signal change formula following the MarsBaR FAQ (http://marsbar.sourceforge.net/faq.html) but the values I'm getting seem too small (on the order of .0002%). Basically the formula is the (beta * peak absolute value of the canonical HRF regressor * 100)/(run mean). No derivatives in this case as it is a boxcar design.
I took the mean across all the runs since FSFAST uses the same regressor across the entire experiment (unlike SPM). I used the X.runflac(1).flac.ev(m).Xirf values for the canonical HRF as you suggested (where m equals the condition+1).
Is it possible that I'm missing something in the scaling here? Especially with a boxcar design, the signal change should be much larger than this for a significant cluster, I think. For example, the peak HRF value for one of the conditions is 0.0092. If the betas are already scaled according to the peak value, then it would come out as .02%, which is more reasonable, although still too small.
Thanks for your help with this!
Joe
On May 31, 2013, at 5:02 PM, Douglas N Greve <greve@NMR.MGH.HARVARD.EDU mailto:greve@NMR.MGH.HARVARD.EDU> wrote:
Oh, right, it is probably not there for subcortical. I don't know what I would have to do to write it out. It won't be something that happens before I get back from HBM. Can you remind me after HBM? doug
On 05/31/2013 04:44 PM, Joseph Dien wrote:
It looks like the corrected vertex p-values (ex: cache.th13.abs.sig.voxel.nii.gz) are only available for the surface-based lh and rh spaces. For the subcortical volume-based analysis I don't see the corresponding corrected voxel p-values being available?
On May 31, 2013, at 2:46 PM, Joseph Dien <jdien07@mac.com mailto:jdien07@mac.com mailto:jdien07@mac.com> wrote:
On May 31, 2013, at 12:11 PM, Douglas N Greve <greve@nmr.mgh.harvard.edu mailto:greve@nmr.mgh.harvard.edu mailto:greve@nmr.mgh.harvard.edu> wrote:
On 05/31/2013 01:49 AM, Joseph Dien wrote:
I was able to make more progress so I'm mostly good at this point but I have a remaining question:
I assume the contents of sig.nii.gz (which I assume are the vertex p-values) are not FWE corrected. Is it possible to get FWE-corrected vertex p-values? Or are only clusterwise corrections available?
There should be something like cache.th13.abs.sig.voxel.mgh which is corrected on a voxelwise basis (the th13 is just part of the name but it should be the same regardless of the threshold you choose) doug
Excellent! Thanks! :)
Thanks again for your patience!
Joe
On May 30, 2013, at 4:37 PM, Joseph Dien <jdien07@mac.com mailto:jdien07@mac.com mailto:jdien07@mac.com mailto:jdien07@mac.com> wrote:
> Just to make sure I'm doing this right, I'm going to summarize what > I've taken away from your answers and to ask some new questions. In > order to present the results, I need two things: > > 1) A set of histograms (with error bars) for each cluster figure to > show the % signal change for each of the four contrasts of interest. > The cache.th20.pos.y.ocn.dat file only gives it for the condition > where the cluster was significant so I can't use that. > So I could use mri_label2vol to convert cache.th20.neg.sig.ocn.annot > from the group level analysis to generate a mask for each cluster of > interest. > Then I could extract the value of the voxels from each > subject's cespct file for each contrast, average them across the > cluster ROI, then average them across each subject, to generate the > histogram? > This would suffice to give me the %age signal change? > I would be doing these computations in Matlab using MRIread. > > 2) A results table with the headings: > > Cluster p (FWE corrected) > Cluster size > Peak Voxel p (FWE corrected) > Peak Voxel T > Peak Voxel Coords > BA > Anatomical Landmark > > I can get the first two from > the cache.th20.pos/neg.sig.cluster.summary files from the group > level > analysis. > I can get the peak voxel coordinates from the summary files as well. > I can use this to get the peak voxel p from the group > level sig.nii.gz file. Is this FWE corrected? If not, how can > I get > this information? > I can use these coordinates to get the peak voxel T by getting the > value from the group level F.nii.gz file and taking its square root. > How can I get the sign of the T statistic? > I can use the Lancaster transform to convert the MNI305 peak voxel > coordinates into the Atlas coordinates to look up the putative > BA and > landmarks (unless there is a better way with Freesurfer? I'm seeing > some references to some BA labels in the forum but it doesn't look > like this is a complete set yet?). > > Sorry for all these questions! I got some nice results from FSFAST > and would like to get them written up. > > Cheers! > > Joe > > > > > On May 29, 2013, at 10:53 PM, Douglas Greve > <greve@nmr.mgh.harvard.edu mailto:greve@nmr.mgh.harvard.edu > mailto:greve@nmr.mgh.harvard.edu > mailto:greve@nmr.mgh.harvard.edu> wrote: > >> >> On 5/29/13 10:42 PM, Joseph Dien wrote: >>> >>> On May 29, 2013, at 11:40 AM, Douglas N Greve >>> <greve@NMR.MGH.HARVARD.EDU mailto:greve@NMR.MGH.HARVARD.EDU >>> mailto:greve@NMR.MGH.HARVARD.EDU >>> mailto:greve@NMR.MGH.HARVARD.EDU> wrote: >>> >>>> Hi Joe, >>>> >>>> On 05/29/2013 01:00 AM, Joseph Dien wrote: >>>>> I need to extract the beta weights from a cluster identified >>>>> with >>>>> FS-Fast in order to compute percentage signal change. >>>>> >>>>> 1) I see a file called beta.nii.gz that appears to have the beta >>>>> weight information. It has a four dimensional structure and the >>>>> fourth dimension appears to be the beta weights. Is there an >>>>> index >>>>> somewhere as to which beta weight is which? Or if not, how >>>>> are they >>>>> organized? >>>> For the first level analysis, the first N beta weights correspond >>>> to the >>>> N conditions in the paradigm file. The rest are nuisance >>>> variables. >>>>> >>> >>> Ah, very good! In order to compute the percent signal change >>> statistic (I'm following the MarsBaR approach: >>> http://marsbar.sourceforge.net/faq.html#how-is-the-percent-signal-change-cal...) >>> >>> >>> I'm also going to need the beta weights for the session mean >>> regressors. How are the nuisance regressors organized? >> You can just use the meanfunc.nii.gz. Also, each contrasts is >> computed as the simple contrast (ces) and as a percent of the >> baseline at the voxel (cespct, cesvarpct). >>> >>>>> 2) In order to extract the cluster, it looks like I would >>>>> use mri_label2vol to convert cache.th20.neg.sig.ocn.annot into a >>>>> volume where the voxels are tagged with the number of the >>>>> corresponding cluster. >>>> Is that from a group analysis? >>>>> >>> >>> Yes, that's right. >>> >>>>> I could then use that to generate masks to extract the >>>>> information I >>>>> need for each cluster from beta.nii.gz. >>>> If this is from a group analysis, then there should already be >>>> a file >>>> there (something.y.ocn.dat) that has a value for each subject >>>> in the >>>> rows and a value for each cluster in the columns. >>>>> >>> >>> I see it. Are these values already scaled as percent signal >>> change? If so, that would be wonderful! :) >> Only if you specified it when you ran isxconcat-sess. Note that the >> "non-scaled" values are actually scaled to percent of grand mean >> intensity. >>> >>>>> Is that correct? >>>>> >>>>> 3) The final information that I would need is the canonical hrf >>>>> shape >>>>> generated by FSFAST for a single event. I guess I could >>>>> generate >>>>> that >>>>> by setting up a dummy analysis run with a single event of the >>>>> desired >>>>> duration and then look in the X variable in the resulting >>>>> X.mat file? >>>> try this >>>> plot(X.runflac(1).flac.ev(2).tirf, X.runflac(1).flac.ev(2).Xirf) >>>>> >>> >>> Perfect! :) >>> >>>>> Sorry for all the questions! >>>>> >>>>> Joe >>>>> >>>>> >>>>> >>>>>
-- Douglas N. Greve, Ph.D. MGH-NMR Center greve@nmr.mgh.harvard.edu mailto:greve@nmr.mgh.harvard.edu Phone Number: 617-724-2358 Fax: 617-726-7422
Bugs: surfer.nmr.mgh.harvard.edu/fswiki/BugReporting FileDrop: https://gate.nmr.mgh.harvard.edu/filedrop2 www.nmr.mgh.harvard.edu/facility/filedrop/index.html Outgoing: ftp://surfer.nmr.mgh.harvard.edu/transfer/outgoing/flat/greve/
Freesurfer mailing list Freesurfer@nmr.mgh.harvard.edu https://mail.nmr.mgh.harvard.edu/mailman/listinfo/freesurfer
The information in this e-mail is intended only for the person to whom it is addressed. If you believe this e-mail was sent to you in error and the e-mail contains patient information, please contact the Partners Compliance HelpLine at http://www.partners.org/complianceline . If the e-mail was sent to you in error but does not contain patient information, please contact the sender and properly dispose of the e-mail.
Joseph Dien, Senior Research Scientist University of Maryland
E-mail: jdien07@mac.com mailto:jdien07@mac.com Phone: 202-297-8117 http://joedien.com//
then I get on the order of .02% difference between the contrasted conditions. The run mean values are in my expected ballpark of about 100 or so. The condition betas are just very very small. Or perhaps this is typical of FSFAST analyses?
On Jul 17, 2013, at 2:00 PM, Douglas N Greve greve@nmr.mgh.harvard.edu wrote:
The beta's have already been scaled. What do you get if you just beta/runmean ?
On 07/17/2013 01:45 PM, Joseph Dien wrote:
I implemented the ROI percent signal change formula following the MarsBaR FAQ (http://marsbar.sourceforge.net/faq.html) but the values I'm getting seem too small (on the order of .0002%). Basically the formula is the (beta * peak absolute value of the canonical HRF regressor * 100)/(run mean). No derivatives in this case as it is a boxcar design.
I took the mean across all the runs since FSFAST uses the same regressor across the entire experiment (unlike SPM). I used the X.runflac(1).flac.ev(m).Xirf values for the canonical HRF as you suggested (where m equals the condition+1).
Is it possible that I'm missing something in the scaling here? Especially with a boxcar design, the signal change should be much larger than this for a significant cluster, I think. For example, the peak HRF value for one of the conditions is 0.0092. If the betas are already scaled according to the peak value, then it would come out as .02%, which is more reasonable, although still too small.
Thanks for your help with this!
Joe
On May 31, 2013, at 5:02 PM, Douglas N Greve <greve@NMR.MGH.HARVARD.EDU mailto:greve@NMR.MGH.HARVARD.EDU> wrote:
Oh, right, it is probably not there for subcortical. I don't know what I would have to do to write it out. It won't be something that happens before I get back from HBM. Can you remind me after HBM? doug
On 05/31/2013 04:44 PM, Joseph Dien wrote:
It looks like the corrected vertex p-values (ex: cache.th13.abs.sig.voxel.nii.gz) are only available for the surface-based lh and rh spaces. For the subcortical volume-based analysis I don't see the corresponding corrected voxel p-values being available?
On May 31, 2013, at 2:46 PM, Joseph Dien <jdien07@mac.com mailto:jdien07@mac.com mailto:jdien07@mac.com> wrote:
On May 31, 2013, at 12:11 PM, Douglas N Greve <greve@nmr.mgh.harvard.edu mailto:greve@nmr.mgh.harvard.edu mailto:greve@nmr.mgh.harvard.edu> wrote:
On 05/31/2013 01:49 AM, Joseph Dien wrote: > I was able to make more progress so I'm mostly good at this point but > I have a remaining question: > > I assume the contents of sig.nii.gz (which I assume are the vertex > p-values) are not FWE corrected. Is it possible to get FWE-corrected > vertex p-values? Or are only clusterwise corrections available? There should be something like cache.th13.abs.sig.voxel.mgh which is corrected on a voxelwise basis (the th13 is just part of the name but it should be the same regardless of the threshold you choose) doug
Excellent! Thanks! :)
> > Thanks again for your patience! > > Joe > > On May 30, 2013, at 4:37 PM, Joseph Dien <jdien07@mac.com > mailto:jdien07@mac.com > mailto:jdien07@mac.com > mailto:jdien07@mac.com> wrote: > >> Just to make sure I'm doing this right, I'm going to summarize what >> I've taken away from your answers and to ask some new questions. In >> order to present the results, I need two things: >> >> 1) A set of histograms (with error bars) for each cluster figure to >> show the % signal change for each of the four contrasts of interest. >> The cache.th20.pos.y.ocn.dat file only gives it for the condition >> where the cluster was significant so I can't use that. >> So I could use mri_label2vol to convert cache.th20.neg.sig.ocn.annot >> from the group level analysis to generate a mask for each cluster of >> interest. >> Then I could extract the value of the voxels from each >> subject's cespct file for each contrast, average them across the >> cluster ROI, then average them across each subject, to generate the >> histogram? >> This would suffice to give me the %age signal change? >> I would be doing these computations in Matlab using MRIread. >> >> 2) A results table with the headings: >> >> Cluster p (FWE corrected) >> Cluster size >> Peak Voxel p (FWE corrected) >> Peak Voxel T >> Peak Voxel Coords >> BA >> Anatomical Landmark >> >> I can get the first two from >> the cache.th20.pos/neg.sig.cluster.summary files from the group >> level >> analysis. >> I can get the peak voxel coordinates from the summary files as well. >> I can use this to get the peak voxel p from the group >> level sig.nii.gz file. Is this FWE corrected? If not, how can >> I get >> this information? >> I can use these coordinates to get the peak voxel T by getting the >> value from the group level F.nii.gz file and taking its square root. >> How can I get the sign of the T statistic? >> I can use the Lancaster transform to convert the MNI305 peak voxel >> coordinates into the Atlas coordinates to look up the putative >> BA and >> landmarks (unless there is a better way with Freesurfer? I'm seeing >> some references to some BA labels in the forum but it doesn't look >> like this is a complete set yet?). >> >> Sorry for all these questions! I got some nice results from FSFAST >> and would like to get them written up. >> >> Cheers! >> >> Joe >> >> >> >> >> On May 29, 2013, at 10:53 PM, Douglas Greve >> <greve@nmr.mgh.harvard.edu mailto:greve@nmr.mgh.harvard.edu >> mailto:greve@nmr.mgh.harvard.edu >> mailto:greve@nmr.mgh.harvard.edu> wrote: >> >>> >>> On 5/29/13 10:42 PM, Joseph Dien wrote: >>>> >>>> On May 29, 2013, at 11:40 AM, Douglas N Greve >>>> <greve@NMR.MGH.HARVARD.EDU mailto:greve@NMR.MGH.HARVARD.EDU >>>> mailto:greve@NMR.MGH.HARVARD.EDU >>>> mailto:greve@NMR.MGH.HARVARD.EDU> wrote: >>>> >>>>> Hi Joe, >>>>> >>>>> On 05/29/2013 01:00 AM, Joseph Dien wrote: >>>>>> I need to extract the beta weights from a cluster identified >>>>>> with >>>>>> FS-Fast in order to compute percentage signal change. >>>>>> >>>>>> 1) I see a file called beta.nii.gz that appears to have the beta >>>>>> weight information. It has a four dimensional structure and the >>>>>> fourth dimension appears to be the beta weights. Is there an >>>>>> index >>>>>> somewhere as to which beta weight is which? Or if not, how >>>>>> are they >>>>>> organized? >>>>> For the first level analysis, the first N beta weights correspond >>>>> to the >>>>> N conditions in the paradigm file. The rest are nuisance >>>>> variables. >>>>>> >>>> >>>> Ah, very good! In order to compute the percent signal change >>>> statistic (I'm following the MarsBaR approach: >>>> http://marsbar.sourceforge.net/faq.html#how-is-the-percent-signal-change-cal...) >>>> >>>> >>>> I'm also going to need the beta weights for the session mean >>>> regressors. How are the nuisance regressors organized? >>> You can just use the meanfunc.nii.gz. Also, each contrasts is >>> computed as the simple contrast (ces) and as a percent of the >>> baseline at the voxel (cespct, cesvarpct). >>>> >>>>>> 2) In order to extract the cluster, it looks like I would >>>>>> use mri_label2vol to convert cache.th20.neg.sig.ocn.annot into a >>>>>> volume where the voxels are tagged with the number of the >>>>>> corresponding cluster. >>>>> Is that from a group analysis? >>>>>> >>>> >>>> Yes, that's right. >>>> >>>>>> I could then use that to generate masks to extract the >>>>>> information I >>>>>> need for each cluster from beta.nii.gz. >>>>> If this is from a group analysis, then there should already be >>>>> a file >>>>> there (something.y.ocn.dat) that has a value for each subject >>>>> in the >>>>> rows and a value for each cluster in the columns. >>>>>> >>>> >>>> I see it. Are these values already scaled as percent signal >>>> change? If so, that would be wonderful! :) >>> Only if you specified it when you ran isxconcat-sess. Note that the >>> "non-scaled" values are actually scaled to percent of grand mean >>> intensity. >>>> >>>>>> Is that correct? >>>>>> >>>>>> 3) The final information that I would need is the canonical hrf >>>>>> shape >>>>>> generated by FSFAST for a single event. I guess I could >>>>>> generate >>>>>> that >>>>>> by setting up a dummy analysis run with a single event of the >>>>>> desired >>>>>> duration and then look in the X variable in the resulting >>>>>> X.mat file? >>>>> try this >>>>> plot(X.runflac(1).flac.ev(2).tirf, X.runflac(1).flac.ev(2).Xirf) >>>>>> >>>> >>>> Perfect! :) >>>> >>>>>> Sorry for all the questions! >>>>>> >>>>>> Joe >>>>>> >>>>>> >>>>>> >>>>>>
-- Douglas N. Greve, Ph.D. MGH-NMR Center greve@nmr.mgh.harvard.edu mailto:greve@nmr.mgh.harvard.edu Phone Number: 617-724-2358 Fax: 617-726-7422
Bugs: surfer.nmr.mgh.harvard.edu/fswiki/BugReporting FileDrop: https://gate.nmr.mgh.harvard.edu/filedrop2 www.nmr.mgh.harvard.edu/facility/filedrop/index.html Outgoing: ftp://surfer.nmr.mgh.harvard.edu/transfer/outgoing/flat/greve/
Freesurfer mailing list Freesurfer@nmr.mgh.harvard.edu https://mail.nmr.mgh.harvard.edu/mailman/listinfo/freesurfer
The information in this e-mail is intended only for the person to whom it is addressed. If you believe this e-mail was sent to you in error and the e-mail contains patient information, please contact the Partners Compliance HelpLine at http://www.partners.org/complianceline . If the e-mail was sent to you in error but does not contain patient information, please contact the sender and properly dispose of the e-mail.
Joseph Dien, Senior Research Scientist University of Maryland
E-mail: jdien07@mac.com mailto:jdien07@mac.com Phone: 202-297-8117 http://joedien.com//
-- Douglas N. Greve, Ph.D. MGH-NMR Center greve@nmr.mgh.harvard.edu Phone Number: 617-724-2358 Fax: 617-726-7422
Bugs: surfer.nmr.mgh.harvard.edu/fswiki/BugReporting FileDrop: https://gate.nmr.mgh.harvard.edu/filedrop2 www.nmr.mgh.harvard.edu/facility/filedrop/index.html Outgoing: ftp://surfer.nmr.mgh.harvard.edu/transfer/outgoing/flat/greve/
Freesurfer mailing list Freesurfer@nmr.mgh.harvard.edu https://mail.nmr.mgh.harvard.edu/mailman/listinfo/freesurfer
--------------------------------------------------------------------------------
Joseph Dien, Senior Research Scientist University of Maryland
E-mail: jdien07@mac.com Phone: 202-297-8117 http://joedien.com//
when you ran mkanalysis-sess, what did you set --refeventdur to? On 07/17/2013 02:50 PM, Joseph Dien wrote:
then I get on the order of .02% difference between the contrasted conditions. The run mean values are in my expected ballpark of about 100 or so. The condition betas are just very very small. Or perhaps this is typical of FSFAST analyses?
On Jul 17, 2013, at 2:00 PM, Douglas N Greve <greve@nmr.mgh.harvard.edu mailto:greve@nmr.mgh.harvard.edu> wrote:
The beta's have already been scaled. What do you get if you just beta/runmean ?
On 07/17/2013 01:45 PM, Joseph Dien wrote:
I implemented the ROI percent signal change formula following the MarsBaR FAQ (http://marsbar.sourceforge.net/faq.html) but the values I'm getting seem too small (on the order of .0002%). Basically the formula is the (beta * peak absolute value of the canonical HRF regressor * 100)/(run mean). No derivatives in this case as it is a boxcar design.
I took the mean across all the runs since FSFAST uses the same regressor across the entire experiment (unlike SPM). I used the X.runflac(1).flac.ev(m).Xirf values for the canonical HRF as you suggested (where m equals the condition+1).
Is it possible that I'm missing something in the scaling here? Especially with a boxcar design, the signal change should be much larger than this for a significant cluster, I think. For example, the peak HRF value for one of the conditions is 0.0092. If the betas are already scaled according to the peak value, then it would come out as .02%, which is more reasonable, although still too small.
Thanks for your help with this!
Joe
On May 31, 2013, at 5:02 PM, Douglas N Greve <greve@NMR.MGH.HARVARD.EDU mailto:greve@NMR.MGH.HARVARD.EDU mailto:greve@NMR.MGH.HARVARD.EDU> wrote:
Oh, right, it is probably not there for subcortical. I don't know what I would have to do to write it out. It won't be something that happens before I get back from HBM. Can you remind me after HBM? doug
On 05/31/2013 04:44 PM, Joseph Dien wrote:
It looks like the corrected vertex p-values (ex: cache.th13.abs.sig.voxel.nii.gz) are only available for the surface-based lh and rh spaces. For the subcortical volume-based analysis I don't see the corresponding corrected voxel p-values being available?
On May 31, 2013, at 2:46 PM, Joseph Dien <jdien07@mac.com mailto:jdien07@mac.com mailto:jdien07@mac.com mailto:jdien07@mac.com> wrote:
On May 31, 2013, at 12:11 PM, Douglas N Greve <greve@nmr.mgh.harvard.edu mailto:greve@nmr.mgh.harvard.edu mailto:greve@nmr.mgh.harvard.edu mailto:greve@nmr.mgh.harvard.edu> wrote:
> > On 05/31/2013 01:49 AM, Joseph Dien wrote: >> I was able to make more progress so I'm mostly good at this >> point but >> I have a remaining question: >> >> I assume the contents of sig.nii.gz (which I assume are the vertex >> p-values) are not FWE corrected. Is it possible to get >> FWE-corrected >> vertex p-values? Or are only clusterwise corrections available? > There should be something like cache.th13.abs.sig.voxel.mgh which is > corrected on a voxelwise basis (the th13 is just part of the name > but it > should be the same regardless of the threshold you choose) > doug
Excellent! Thanks! :)
>> >> Thanks again for your patience! >> >> Joe >> >> On May 30, 2013, at 4:37 PM, Joseph Dien <jdien07@mac.com >> mailto:jdien07@mac.com >> mailto:jdien07@mac.com >> mailto:jdien07@mac.com >> mailto:jdien07@mac.com> wrote: >> >>> Just to make sure I'm doing this right, I'm going to summarize >>> what >>> I've taken away from your answers and to ask some new >>> questions. In >>> order to present the results, I need two things: >>> >>> 1) A set of histograms (with error bars) for each cluster >>> figure to >>> show the % signal change for each of the four contrasts of >>> interest. >>> The cache.th20.pos.y.ocn.dat file only gives it for the condition >>> where the cluster was significant so I can't use that. >>> So I could use mri_label2vol to convert >>> cache.th20.neg.sig.ocn.annot >>> from the group level analysis to generate a mask for each >>> cluster of >>> interest. >>> Then I could extract the value of the voxels from each >>> subject's cespct file for each contrast, average them across the >>> cluster ROI, then average them across each subject, to >>> generate the >>> histogram? >>> This would suffice to give me the %age signal change? >>> I would be doing these computations in Matlab using MRIread. >>> >>> 2) A results table with the headings: >>> >>> Cluster p (FWE corrected) >>> Cluster size >>> Peak Voxel p (FWE corrected) >>> Peak Voxel T >>> Peak Voxel Coords >>> BA >>> Anatomical Landmark >>> >>> I can get the first two from >>> the cache.th20.pos/neg.sig.cluster.summary files from the group >>> level >>> analysis. >>> I can get the peak voxel coordinates from the summary files as >>> well. >>> I can use this to get the peak voxel p from the group >>> level sig.nii.gz file. Is this FWE corrected? If not, how can >>> I get >>> this information? >>> I can use these coordinates to get the peak voxel T by getting the >>> value from the group level F.nii.gz file and taking its square >>> root. >>> How can I get the sign of the T statistic? >>> I can use the Lancaster transform to convert the MNI305 peak voxel >>> coordinates into the Atlas coordinates to look up the putative >>> BA and >>> landmarks (unless there is a better way with Freesurfer? I'm >>> seeing >>> some references to some BA labels in the forum but it doesn't look >>> like this is a complete set yet?). >>> >>> Sorry for all these questions! I got some nice results from >>> FSFAST >>> and would like to get them written up. >>> >>> Cheers! >>> >>> Joe >>> >>> >>> >>> >>> On May 29, 2013, at 10:53 PM, Douglas Greve >>> <greve@nmr.mgh.harvard.edu mailto:greve@nmr.mgh.harvard.edu >>> mailto:greve@nmr.mgh.harvard.edu >>> mailto:greve@nmr.mgh.harvard.edu >>> mailto:greve@nmr.mgh.harvard.edu> wrote: >>> >>>> >>>> On 5/29/13 10:42 PM, Joseph Dien wrote: >>>>> >>>>> On May 29, 2013, at 11:40 AM, Douglas N Greve >>>>> <greve@NMR.MGH.HARVARD.EDU >>>>> mailto:greve@NMR.MGH.HARVARD.EDU >>>>> mailto:greve@NMR.MGH.HARVARD.EDU >>>>> mailto:greve@NMR.MGH.HARVARD.EDU >>>>> mailto:greve@NMR.MGH.HARVARD.EDU> wrote: >>>>> >>>>>> Hi Joe, >>>>>> >>>>>> On 05/29/2013 01:00 AM, Joseph Dien wrote: >>>>>>> I need to extract the beta weights from a cluster identified >>>>>>> with >>>>>>> FS-Fast in order to compute percentage signal change. >>>>>>> >>>>>>> 1) I see a file called beta.nii.gz that appears to have >>>>>>> the beta >>>>>>> weight information. It has a four dimensional structure >>>>>>> and the >>>>>>> fourth dimension appears to be the beta weights. Is there an >>>>>>> index >>>>>>> somewhere as to which beta weight is which? Or if not, how >>>>>>> are they >>>>>>> organized? >>>>>> For the first level analysis, the first N beta weights >>>>>> correspond >>>>>> to the >>>>>> N conditions in the paradigm file. The rest are nuisance >>>>>> variables. >>>>>>> >>>>> >>>>> Ah, very good! In order to compute the percent signal change >>>>> statistic (I'm following the MarsBaR approach: >>>>> http://marsbar.sourceforge.net/faq.html#how-is-the-percent-signal-change-cal...) >>>>> >>>>> >>>>> >>>>> I'm also going to need the beta weights for the session mean >>>>> regressors. How are the nuisance regressors organized? >>>> You can just use the meanfunc.nii.gz. Also, each contrasts is >>>> computed as the simple contrast (ces) and as a percent of the >>>> baseline at the voxel (cespct, cesvarpct). >>>>> >>>>>>> 2) In order to extract the cluster, it looks like I would >>>>>>> use mri_label2vol to convert cache.th20.neg.sig.ocn.annot >>>>>>> into a >>>>>>> volume where the voxels are tagged with the number of the >>>>>>> corresponding cluster. >>>>>> Is that from a group analysis? >>>>>>> >>>>> >>>>> Yes, that's right. >>>>> >>>>>>> I could then use that to generate masks to extract the >>>>>>> information I >>>>>>> need for each cluster from beta.nii.gz. >>>>>> If this is from a group analysis, then there should already be >>>>>> a file >>>>>> there (something.y.ocn.dat) that has a value for each subject >>>>>> in the >>>>>> rows and a value for each cluster in the columns. >>>>>>> >>>>> >>>>> I see it. Are these values already scaled as percent signal >>>>> change? If so, that would be wonderful! :) >>>> Only if you specified it when you ran isxconcat-sess. Note >>>> that the >>>> "non-scaled" values are actually scaled to percent of grand mean >>>> intensity. >>>>> >>>>>>> Is that correct? >>>>>>> >>>>>>> 3) The final information that I would need is the >>>>>>> canonical hrf >>>>>>> shape >>>>>>> generated by FSFAST for a single event. I guess I could >>>>>>> generate >>>>>>> that >>>>>>> by setting up a dummy analysis run with a single event of the >>>>>>> desired >>>>>>> duration and then look in the X variable in the resulting >>>>>>> X.mat file? >>>>>> try this >>>>>> plot(X.runflac(1).flac.ev(2).tirf, >>>>>> X.runflac(1).flac.ev(2).Xirf) >>>>>>> >>>>> >>>>> Perfect! :) >>>>> >>>>>>> Sorry for all the questions! >>>>>>> >>>>>>> Joe >>>>>>> >>>>>>> >>>>>>> >>>>>>>
-- Douglas N. Greve, Ph.D. MGH-NMR Center greve@nmr.mgh.harvard.edu mailto:greve@nmr.mgh.harvard.edu mailto:greve@nmr.mgh.harvard.edu Phone Number: 617-724-2358 Fax: 617-726-7422
Bugs: surfer.nmr.mgh.harvard.edu/fswiki/BugReporting FileDrop: https://gate.nmr.mgh.harvard.edu/filedrop2 www.nmr.mgh.harvard.edu/facility/filedrop/index.html http://www.nmr.mgh.harvard.edu/facility/filedrop/index.html Outgoing: ftp://surfer.nmr.mgh.harvard.edu/transfer/outgoing/flat/greve/
Freesurfer mailing list Freesurfer@nmr.mgh.harvard.edu https://mail.nmr.mgh.harvard.edu/mailman/listinfo/freesurfer
The information in this e-mail is intended only for the person to whom it is addressed. If you believe this e-mail was sent to you in error and the e-mail contains patient information, please contact the Partners Compliance HelpLine at http://www.partners.org/complianceline . If the e-mail was sent to you in error but does not contain patient information, please contact the sender and properly dispose of the e-mail.
Joseph Dien, Senior Research Scientist University of Maryland
E-mail: jdien07@mac.com mailto:jdien07@mac.com mailto:jdien07@mac.com Phone: 202-297-8117 http://joedien.com//
-- Douglas N. Greve, Ph.D. MGH-NMR Center greve@nmr.mgh.harvard.edu mailto:greve@nmr.mgh.harvard.edu Phone Number: 617-724-2358 Fax: 617-726-7422
Bugs: surfer.nmr.mgh.harvard.edu/fswiki/BugReporting FileDrop: https://gate.nmr.mgh.harvard.edu/filedrop2 www.nmr.mgh.harvard.edu/facility/filedrop/index.html Outgoing: ftp://surfer.nmr.mgh.harvard.edu/transfer/outgoing/flat/greve/
Freesurfer mailing list Freesurfer@nmr.mgh.harvard.edu https://mail.nmr.mgh.harvard.edu/mailman/listinfo/freesurfer
Joseph Dien, Senior Research Scientist University of Maryland
E-mail: jdien07@mac.com mailto:jdien07@mac.com Phone: 202-297-8117 http://joedien.com//
It's a boxcar design so 20.265.
mkanalysis-sess -fsd bold -analysis CPA.sm05.lh -surface fsaverage lh -fwhm 5 -event-related -paradigm CPA1.par -nconditions 20 -spmhrf 0 -TR 2 -refeventdur 20.265 -polyfit 2 -per-run -force -nuisreg nuisreg2.dat 7 -tpexclude tpexclude.dat
On Jul 17, 2013, at 3:50 PM, Douglas N Greve greve@nmr.mgh.harvard.edu wrote:
when you ran mkanalysis-sess, what did you set --refeventdur to? On 07/17/2013 02:50 PM, Joseph Dien wrote:
then I get on the order of .02% difference between the contrasted conditions. The run mean values are in my expected ballpark of about 100 or so. The condition betas are just very very small. Or perhaps this is typical of FSFAST analyses?
On Jul 17, 2013, at 2:00 PM, Douglas N Greve <greve@nmr.mgh.harvard.edu mailto:greve@nmr.mgh.harvard.edu> wrote:
The beta's have already been scaled. What do you get if you just beta/runmean ?
On 07/17/2013 01:45 PM, Joseph Dien wrote:
I implemented the ROI percent signal change formula following the MarsBaR FAQ (http://marsbar.sourceforge.net/faq.html) but the values I'm getting seem too small (on the order of .0002%). Basically the formula is the (beta * peak absolute value of the canonical HRF regressor * 100)/(run mean). No derivatives in this case as it is a boxcar design.
I took the mean across all the runs since FSFAST uses the same regressor across the entire experiment (unlike SPM). I used the X.runflac(1).flac.ev(m).Xirf values for the canonical HRF as you suggested (where m equals the condition+1).
Is it possible that I'm missing something in the scaling here? Especially with a boxcar design, the signal change should be much larger than this for a significant cluster, I think. For example, the peak HRF value for one of the conditions is 0.0092. If the betas are already scaled according to the peak value, then it would come out as .02%, which is more reasonable, although still too small.
Thanks for your help with this!
Joe
On May 31, 2013, at 5:02 PM, Douglas N Greve <greve@NMR.MGH.HARVARD.EDU mailto:greve@NMR.MGH.HARVARD.EDU mailto:greve@NMR.MGH.HARVARD.EDU> wrote:
Oh, right, it is probably not there for subcortical. I don't know what I would have to do to write it out. It won't be something that happens before I get back from HBM. Can you remind me after HBM? doug
On 05/31/2013 04:44 PM, Joseph Dien wrote:
It looks like the corrected vertex p-values (ex: cache.th13.abs.sig.voxel.nii.gz) are only available for the surface-based lh and rh spaces. For the subcortical volume-based analysis I don't see the corresponding corrected voxel p-values being available?
On May 31, 2013, at 2:46 PM, Joseph Dien <jdien07@mac.com mailto:jdien07@mac.com mailto:jdien07@mac.com mailto:jdien07@mac.com> wrote:
> > On May 31, 2013, at 12:11 PM, Douglas N Greve > <greve@nmr.mgh.harvard.edu mailto:greve@nmr.mgh.harvard.edu mailto:greve@nmr.mgh.harvard.edu > mailto:greve@nmr.mgh.harvard.edu> wrote: > >> >> On 05/31/2013 01:49 AM, Joseph Dien wrote: >>> I was able to make more progress so I'm mostly good at this point but >>> I have a remaining question: >>> >>> I assume the contents of sig.nii.gz (which I assume are the vertex >>> p-values) are not FWE corrected. Is it possible to get FWE-corrected >>> vertex p-values? Or are only clusterwise corrections available? >> There should be something like cache.th13.abs.sig.voxel.mgh which is >> corrected on a voxelwise basis (the th13 is just part of the name >> but it >> should be the same regardless of the threshold you choose) >> doug > > Excellent! Thanks! :) > >>> >>> Thanks again for your patience! >>> >>> Joe >>> >>> On May 30, 2013, at 4:37 PM, Joseph Dien <jdien07@mac.com mailto:jdien07@mac.com >>> mailto:jdien07@mac.com >>> mailto:jdien07@mac.com >>> mailto:jdien07@mac.com> wrote: >>> >>>> Just to make sure I'm doing this right, I'm going to summarize what >>>> I've taken away from your answers and to ask some new questions. In >>>> order to present the results, I need two things: >>>> >>>> 1) A set of histograms (with error bars) for each cluster figure to >>>> show the % signal change for each of the four contrasts of interest. >>>> The cache.th20.pos.y.ocn.dat file only gives it for the condition >>>> where the cluster was significant so I can't use that. >>>> So I could use mri_label2vol to convert cache.th20.neg.sig.ocn.annot >>>> from the group level analysis to generate a mask for each cluster of >>>> interest. >>>> Then I could extract the value of the voxels from each >>>> subject's cespct file for each contrast, average them across the >>>> cluster ROI, then average them across each subject, to generate the >>>> histogram? >>>> This would suffice to give me the %age signal change? >>>> I would be doing these computations in Matlab using MRIread. >>>> >>>> 2) A results table with the headings: >>>> >>>> Cluster p (FWE corrected) >>>> Cluster size >>>> Peak Voxel p (FWE corrected) >>>> Peak Voxel T >>>> Peak Voxel Coords >>>> BA >>>> Anatomical Landmark >>>> >>>> I can get the first two from >>>> the cache.th20.pos/neg.sig.cluster.summary files from the group >>>> level >>>> analysis. >>>> I can get the peak voxel coordinates from the summary files as well. >>>> I can use this to get the peak voxel p from the group >>>> level sig.nii.gz file. Is this FWE corrected? If not, how can >>>> I get >>>> this information? >>>> I can use these coordinates to get the peak voxel T by getting the >>>> value from the group level F.nii.gz file and taking its square root. >>>> How can I get the sign of the T statistic? >>>> I can use the Lancaster transform to convert the MNI305 peak voxel >>>> coordinates into the Atlas coordinates to look up the putative >>>> BA and >>>> landmarks (unless there is a better way with Freesurfer? I'm seeing >>>> some references to some BA labels in the forum but it doesn't look >>>> like this is a complete set yet?). >>>> >>>> Sorry for all these questions! I got some nice results from FSFAST >>>> and would like to get them written up. >>>> >>>> Cheers! >>>> >>>> Joe >>>> >>>> >>>> >>>> >>>> On May 29, 2013, at 10:53 PM, Douglas Greve >>>> <greve@nmr.mgh.harvard.edu mailto:greve@nmr.mgh.harvard.edu mailto:greve@nmr.mgh.harvard.edu >>>> mailto:greve@nmr.mgh.harvard.edu >>>> mailto:greve@nmr.mgh.harvard.edu> wrote: >>>> >>>>> >>>>> On 5/29/13 10:42 PM, Joseph Dien wrote: >>>>>> >>>>>> On May 29, 2013, at 11:40 AM, Douglas N Greve >>>>>> <greve@NMR.MGH.HARVARD.EDU mailto:greve@NMR.MGH.HARVARD.EDU mailto:greve@NMR.MGH.HARVARD.EDU >>>>>> mailto:greve@NMR.MGH.HARVARD.EDU >>>>>> mailto:greve@NMR.MGH.HARVARD.EDU> wrote: >>>>>> >>>>>>> Hi Joe, >>>>>>> >>>>>>> On 05/29/2013 01:00 AM, Joseph Dien wrote: >>>>>>>> I need to extract the beta weights from a cluster identified >>>>>>>> with >>>>>>>> FS-Fast in order to compute percentage signal change. >>>>>>>> >>>>>>>> 1) I see a file called beta.nii.gz that appears to have the beta >>>>>>>> weight information. It has a four dimensional structure and the >>>>>>>> fourth dimension appears to be the beta weights. Is there an >>>>>>>> index >>>>>>>> somewhere as to which beta weight is which? Or if not, how >>>>>>>> are they >>>>>>>> organized? >>>>>>> For the first level analysis, the first N beta weights correspond >>>>>>> to the >>>>>>> N conditions in the paradigm file. The rest are nuisance >>>>>>> variables. >>>>>>>> >>>>>> >>>>>> Ah, very good! In order to compute the percent signal change >>>>>> statistic (I'm following the MarsBaR approach: >>>>>> http://marsbar.sourceforge.net/faq.html#how-is-the-percent-signal-change-cal...) >>>>>> >>>>>> >>>>>> I'm also going to need the beta weights for the session mean >>>>>> regressors. How are the nuisance regressors organized? >>>>> You can just use the meanfunc.nii.gz. Also, each contrasts is >>>>> computed as the simple contrast (ces) and as a percent of the >>>>> baseline at the voxel (cespct, cesvarpct). >>>>>> >>>>>>>> 2) In order to extract the cluster, it looks like I would >>>>>>>> use mri_label2vol to convert cache.th20.neg.sig.ocn.annot into a >>>>>>>> volume where the voxels are tagged with the number of the >>>>>>>> corresponding cluster. >>>>>>> Is that from a group analysis? >>>>>>>> >>>>>> >>>>>> Yes, that's right. >>>>>> >>>>>>>> I could then use that to generate masks to extract the >>>>>>>> information I >>>>>>>> need for each cluster from beta.nii.gz. >>>>>>> If this is from a group analysis, then there should already be >>>>>>> a file >>>>>>> there (something.y.ocn.dat) that has a value for each subject >>>>>>> in the >>>>>>> rows and a value for each cluster in the columns. >>>>>>>> >>>>>> >>>>>> I see it. Are these values already scaled as percent signal >>>>>> change? If so, that would be wonderful! :) >>>>> Only if you specified it when you ran isxconcat-sess. Note that the >>>>> "non-scaled" values are actually scaled to percent of grand mean >>>>> intensity. >>>>>> >>>>>>>> Is that correct? >>>>>>>> >>>>>>>> 3) The final information that I would need is the canonical hrf >>>>>>>> shape >>>>>>>> generated by FSFAST for a single event. I guess I could >>>>>>>> generate >>>>>>>> that >>>>>>>> by setting up a dummy analysis run with a single event of the >>>>>>>> desired >>>>>>>> duration and then look in the X variable in the resulting >>>>>>>> X.mat file? >>>>>>> try this >>>>>>> plot(X.runflac(1).flac.ev(2).tirf, X.runflac(1).flac.ev(2).Xirf) >>>>>>>> >>>>>> >>>>>> Perfect! :) >>>>>> >>>>>>>> Sorry for all the questions! >>>>>>>> >>>>>>>> Joe >>>>>>>> >>>>>>>> >>>>>>>> >>>>>>>>
-- Douglas N. Greve, Ph.D. MGH-NMR Center greve@nmr.mgh.harvard.edu mailto:greve@nmr.mgh.harvard.edu mailto:greve@nmr.mgh.harvard.edu Phone Number: 617-724-2358 Fax: 617-726-7422
Bugs: surfer.nmr.mgh.harvard.edu/fswiki/BugReporting FileDrop: https://gate.nmr.mgh.harvard.edu/filedrop2 www.nmr.mgh.harvard.edu/facility/filedrop/index.html http://www.nmr.mgh.harvard.edu/facility/filedrop/index.html Outgoing: ftp://surfer.nmr.mgh.harvard.edu/transfer/outgoing/flat/greve/
Freesurfer mailing list Freesurfer@nmr.mgh.harvard.edu https://mail.nmr.mgh.harvard.edu/mailman/listinfo/freesurfer
The information in this e-mail is intended only for the person to whom it is addressed. If you believe this e-mail was sent to you in error and the e-mail contains patient information, please contact the Partners Compliance HelpLine at http://www.partners.org/complianceline . If the e-mail was sent to you in error but does not contain patient information, please contact the sender and properly dispose of the e-mail.
Joseph Dien, Senior Research Scientist University of Maryland
E-mail: jdien07@mac.com mailto:jdien07@mac.com mailto:jdien07@mac.com Phone: 202-297-8117 http://joedien.com//
-- Douglas N. Greve, Ph.D. MGH-NMR Center greve@nmr.mgh.harvard.edu mailto:greve@nmr.mgh.harvard.edu Phone Number: 617-724-2358 Fax: 617-726-7422
Bugs: surfer.nmr.mgh.harvard.edu/fswiki/BugReporting FileDrop: https://gate.nmr.mgh.harvard.edu/filedrop2 www.nmr.mgh.harvard.edu/facility/filedrop/index.html Outgoing: ftp://surfer.nmr.mgh.harvard.edu/transfer/outgoing/flat/greve/
Freesurfer mailing list Freesurfer@nmr.mgh.harvard.edu https://mail.nmr.mgh.harvard.edu/mailman/listinfo/freesurfer
Joseph Dien, Senior Research Scientist University of Maryland
E-mail: jdien07@mac.com mailto:jdien07@mac.com Phone: 202-297-8117 http://joedien.com//
-- Douglas N. Greve, Ph.D. MGH-NMR Center greve@nmr.mgh.harvard.edu Phone Number: 617-724-2358 Fax: 617-726-7422
Bugs: surfer.nmr.mgh.harvard.edu/fswiki/BugReporting FileDrop: https://gate.nmr.mgh.harvard.edu/filedrop2 www.nmr.mgh.harvard.edu/facility/filedrop/index.html Outgoing: ftp://surfer.nmr.mgh.harvard.edu/transfer/outgoing/flat/greve/
--------------------------------------------------------------------------------
Joseph Dien, Senior Research Scientist University of Maryland
E-mail: jdien07@mac.com Phone: 202-297-8117 http://joedien.com//
why do you have 20 conditions? And what are the 7 nuisance regressors?
On 07/17/2013 03:54 PM, Joseph Dien wrote:
It's a boxcar design so 20.265.
mkanalysis-sess -fsd bold -analysis CPA.sm05.lh -surface fsaverage lh -fwhm 5 -event-related-paradigm CPA1.par -nconditions 20 -spmhrf 0 -TR 2 -refeventdur 20.265 -polyfit 2 -per-run -force -nuisreg nuisreg2.dat 7 -tpexclude tpexclude.dat
On Jul 17, 2013, at 3:50 PM, Douglas N Greve <greve@nmr.mgh.harvard.edu mailto:greve@nmr.mgh.harvard.edu> wrote:
when you ran mkanalysis-sess, what did you set --refeventdur to? On 07/17/2013 02:50 PM, Joseph Dien wrote:
then I get on the order of .02% difference between the contrasted conditions. The run mean values are in my expected ballpark of about 100 or so. The condition betas are just very very small. Or perhaps this is typical of FSFAST analyses?
On Jul 17, 2013, at 2:00 PM, Douglas N Greve <greve@nmr.mgh.harvard.edu mailto:greve@nmr.mgh.harvard.edu mailto:greve@nmr.mgh.harvard.edu> wrote:
The beta's have already been scaled. What do you get if you just beta/runmean ?
On 07/17/2013 01:45 PM, Joseph Dien wrote:
I implemented the ROI percent signal change formula following the MarsBaR FAQ (http://marsbar.sourceforge.net/faq.html) but the values I'm getting seem too small (on the order of .0002%). Basically the formula is the (beta * peak absolute value of the canonical HRF regressor * 100)/(run mean). No derivatives in this case as it is a boxcar design.
I took the mean across all the runs since FSFAST uses the same regressor across the entire experiment (unlike SPM). I used the X.runflac(1).flac.ev(m).Xirf values for the canonical HRF as you suggested (where m equals the condition+1).
Is it possible that I'm missing something in the scaling here? Especially with a boxcar design, the signal change should be much larger than this for a significant cluster, I think. For example, the peak HRF value for one of the conditions is 0.0092. If the betas are already scaled according to the peak value, then it would come out as .02%, which is more reasonable, although still too small.
Thanks for your help with this!
Joe
On May 31, 2013, at 5:02 PM, Douglas N Greve <greve@NMR.MGH.HARVARD.EDU mailto:greve@NMR.MGH.HARVARD.EDU mailto:greve@NMR.MGH.HARVARD.EDU mailto:greve@NMR.MGH.HARVARD.EDU> wrote:
Oh, right, it is probably not there for subcortical. I don't know what I would have to do to write it out. It won't be something that happens before I get back from HBM. Can you remind me after HBM? doug
On 05/31/2013 04:44 PM, Joseph Dien wrote: > It looks like the corrected vertex p-values > (ex: cache.th13.abs.sig.voxel.nii.gz) are only available for the > surface-based lh and rh spaces. For the subcortical volume-based > analysis I don't see the corresponding corrected voxel p-values > being > available? > > On May 31, 2013, at 2:46 PM, Joseph Dien <jdien07@mac.com > mailto:jdien07@mac.com mailto:jdien07@mac.com > mailto:jdien07@mac.com > mailto:jdien07@mac.com> wrote: > >> >> On May 31, 2013, at 12:11 PM, Douglas N Greve >> <greve@nmr.mgh.harvard.edu mailto:greve@nmr.mgh.harvard.edu >> mailto:greve@nmr.mgh.harvard.edu >> mailto:greve@nmr.mgh.harvard.edu >> mailto:greve@nmr.mgh.harvard.edu> wrote: >> >>> >>> On 05/31/2013 01:49 AM, Joseph Dien wrote: >>>> I was able to make more progress so I'm mostly good at this >>>> point but >>>> I have a remaining question: >>>> >>>> I assume the contents of sig.nii.gz (which I assume are the >>>> vertex >>>> p-values) are not FWE corrected. Is it possible to get >>>> FWE-corrected >>>> vertex p-values? Or are only clusterwise corrections available? >>> There should be something like cache.th13.abs.sig.voxel.mgh >>> which is >>> corrected on a voxelwise basis (the th13 is just part of the name >>> but it >>> should be the same regardless of the threshold you choose) >>> doug >> >> Excellent! Thanks! :) >> >>>> >>>> Thanks again for your patience! >>>> >>>> Joe >>>> >>>> On May 30, 2013, at 4:37 PM, Joseph Dien <jdien07@mac.com >>>> mailto:jdien07@mac.com mailto:jdien07@mac.com >>>> mailto:jdien07@mac.com >>>> mailto:jdien07@mac.com >>>> mailto:jdien07@mac.com> wrote: >>>> >>>>> Just to make sure I'm doing this right, I'm going to >>>>> summarize what >>>>> I've taken away from your answers and to ask some new >>>>> questions. In >>>>> order to present the results, I need two things: >>>>> >>>>> 1) A set of histograms (with error bars) for each cluster >>>>> figure to >>>>> show the % signal change for each of the four contrasts of >>>>> interest. >>>>> The cache.th20.pos.y.ocn.dat file only gives it for the >>>>> condition >>>>> where the cluster was significant so I can't use that. >>>>> So I could use mri_label2vol to convert >>>>> cache.th20.neg.sig.ocn.annot >>>>> from the group level analysis to generate a mask for each >>>>> cluster of >>>>> interest. >>>>> Then I could extract the value of the voxels from each >>>>> subject's cespct file for each contrast, average them across the >>>>> cluster ROI, then average them across each subject, to >>>>> generate the >>>>> histogram? >>>>> This would suffice to give me the %age signal change? >>>>> I would be doing these computations in Matlab using MRIread. >>>>> >>>>> 2) A results table with the headings: >>>>> >>>>> Cluster p (FWE corrected) >>>>> Cluster size >>>>> Peak Voxel p (FWE corrected) >>>>> Peak Voxel T >>>>> Peak Voxel Coords >>>>> BA >>>>> Anatomical Landmark >>>>> >>>>> I can get the first two from >>>>> the cache.th20.pos/neg.sig.cluster.summary files from the group >>>>> level >>>>> analysis. >>>>> I can get the peak voxel coordinates from the summary files >>>>> as well. >>>>> I can use this to get the peak voxel p from the group >>>>> level sig.nii.gz file. Is this FWE corrected? If not, how can >>>>> I get >>>>> this information? >>>>> I can use these coordinates to get the peak voxel T by >>>>> getting the >>>>> value from the group level F.nii.gz file and taking its >>>>> square root. >>>>> How can I get the sign of the T statistic? >>>>> I can use the Lancaster transform to convert the MNI305 peak >>>>> voxel >>>>> coordinates into the Atlas coordinates to look up the putative >>>>> BA and >>>>> landmarks (unless there is a better way with Freesurfer? >>>>> I'm seeing >>>>> some references to some BA labels in the forum but it >>>>> doesn't look >>>>> like this is a complete set yet?). >>>>> >>>>> Sorry for all these questions! I got some nice results from >>>>> FSFAST >>>>> and would like to get them written up. >>>>> >>>>> Cheers! >>>>> >>>>> Joe >>>>> >>>>> >>>>> >>>>> >>>>> On May 29, 2013, at 10:53 PM, Douglas Greve >>>>> <greve@nmr.mgh.harvard.edu >>>>> mailto:greve@nmr.mgh.harvard.edu >>>>> mailto:greve@nmr.mgh.harvard.edu >>>>> mailto:greve@nmr.mgh.harvard.edu >>>>> mailto:greve@nmr.mgh.harvard.edu >>>>> mailto:greve@nmr.mgh.harvard.edu> wrote: >>>>> >>>>>> >>>>>> On 5/29/13 10:42 PM, Joseph Dien wrote: >>>>>>> >>>>>>> On May 29, 2013, at 11:40 AM, Douglas N Greve >>>>>>> <greve@NMR.MGH.HARVARD.EDU >>>>>>> mailto:greve@NMR.MGH.HARVARD.EDU >>>>>>> mailto:greve@NMR.MGH.HARVARD.EDU >>>>>>> mailto:greve@NMR.MGH.HARVARD.EDU >>>>>>> mailto:greve@NMR.MGH.HARVARD.EDU >>>>>>> mailto:greve@NMR.MGH.HARVARD.EDU> wrote: >>>>>>> >>>>>>>> Hi Joe, >>>>>>>> >>>>>>>> On 05/29/2013 01:00 AM, Joseph Dien wrote: >>>>>>>>> I need to extract the beta weights from a cluster identified >>>>>>>>> with >>>>>>>>> FS-Fast in order to compute percentage signal change. >>>>>>>>> >>>>>>>>> 1) I see a file called beta.nii.gz that appears to have >>>>>>>>> the beta >>>>>>>>> weight information. It has a four dimensional structure >>>>>>>>> and the >>>>>>>>> fourth dimension appears to be the beta weights. Is >>>>>>>>> there an >>>>>>>>> index >>>>>>>>> somewhere as to which beta weight is which? Or if not, how >>>>>>>>> are they >>>>>>>>> organized? >>>>>>>> For the first level analysis, the first N beta weights >>>>>>>> correspond >>>>>>>> to the >>>>>>>> N conditions in the paradigm file. The rest are nuisance >>>>>>>> variables. >>>>>>>>> >>>>>>> >>>>>>> Ah, very good! In order to compute the percent signal change >>>>>>> statistic (I'm following the MarsBaR approach: >>>>>>> http://marsbar.sourceforge.net/faq.html#how-is-the-percent-signal-change-cal...) >>>>>>> >>>>>>> >>>>>>> >>>>>>> I'm also going to need the beta weights for the session mean >>>>>>> regressors. How are the nuisance regressors organized? >>>>>> You can just use the meanfunc.nii.gz. Also, each contrasts is >>>>>> computed as the simple contrast (ces) and as a percent of the >>>>>> baseline at the voxel (cespct, cesvarpct). >>>>>>> >>>>>>>>> 2) In order to extract the cluster, it looks like I would >>>>>>>>> use mri_label2vol to convert >>>>>>>>> cache.th20.neg.sig.ocn.annot into a >>>>>>>>> volume where the voxels are tagged with the number of the >>>>>>>>> corresponding cluster. >>>>>>>> Is that from a group analysis? >>>>>>>>> >>>>>>> >>>>>>> Yes, that's right. >>>>>>> >>>>>>>>> I could then use that to generate masks to extract the >>>>>>>>> information I >>>>>>>>> need for each cluster from beta.nii.gz. >>>>>>>> If this is from a group analysis, then there should >>>>>>>> already be >>>>>>>> a file >>>>>>>> there (something.y.ocn.dat) that has a value for each subject >>>>>>>> in the >>>>>>>> rows and a value for each cluster in the columns. >>>>>>>>> >>>>>>> >>>>>>> I see it. Are these values already scaled as percent signal >>>>>>> change? If so, that would be wonderful! :) >>>>>> Only if you specified it when you ran isxconcat-sess. Note >>>>>> that the >>>>>> "non-scaled" values are actually scaled to percent of grand >>>>>> mean >>>>>> intensity. >>>>>>> >>>>>>>>> Is that correct? >>>>>>>>> >>>>>>>>> 3) The final information that I would need is the >>>>>>>>> canonical hrf >>>>>>>>> shape >>>>>>>>> generated by FSFAST for a single event. I guess I could >>>>>>>>> generate >>>>>>>>> that >>>>>>>>> by setting up a dummy analysis run with a single event >>>>>>>>> of the >>>>>>>>> desired >>>>>>>>> duration and then look in the X variable in the resulting >>>>>>>>> X.mat file? >>>>>>>> try this >>>>>>>> plot(X.runflac(1).flac.ev(2).tirf, >>>>>>>> X.runflac(1).flac.ev(2).Xirf) >>>>>>>>> >>>>>>> >>>>>>> Perfect! :) >>>>>>> >>>>>>>>> Sorry for all the questions! >>>>>>>>> >>>>>>>>> Joe >>>>>>>>> >>>>>>>>> >>>>>>>>> >>>>>>>>> > > > > > > > > > > >
-- Douglas N. Greve, Ph.D. MGH-NMR Center greve@nmr.mgh.harvard.edu mailto:greve@nmr.mgh.harvard.edu mailto:greve@nmr.mgh.harvard.edu mailto:greve@nmr.mgh.harvard.edu Phone Number: 617-724-2358 Fax: 617-726-7422
Bugs: surfer.nmr.mgh.harvard.edu/fswiki/BugReporting FileDrop: https://gate.nmr.mgh.harvard.edu/filedrop2 www.nmr.mgh.harvard.edu/facility/filedrop/index.html http://www.nmr.mgh.harvard.edu/facility/filedrop/index.html http://www.nmr.mgh.harvard.edu/facility/filedrop/index.html Outgoing: ftp://surfer.nmr.mgh.harvard.edu/transfer/outgoing/flat/greve/
Freesurfer mailing list Freesurfer@nmr.mgh.harvard.edu mailto:Freesurfer@nmr.mgh.harvard.edu https://mail.nmr.mgh.harvard.edu/mailman/listinfo/freesurfer
The information in this e-mail is intended only for the person to whom it is addressed. If you believe this e-mail was sent to you in error and the e-mail contains patient information, please contact the Partners Compliance HelpLine at http://www.partners.org/complianceline . If the e-mail was sent to you in error but does not contain patient information, please contact the sender and properly dispose of the e-mail.
Joseph Dien, Senior Research Scientist University of Maryland
E-mail: jdien07@mac.com mailto:jdien07@mac.com mailto:jdien07@mac.com mailto:jdien07@mac.com Phone: 202-297-8117 http://joedien.com//
-- Douglas N. Greve, Ph.D. MGH-NMR Center greve@nmr.mgh.harvard.edu mailto:greve@nmr.mgh.harvard.edu mailto:greve@nmr.mgh.harvard.edu Phone Number: 617-724-2358 Fax: 617-726-7422
Bugs: surfer.nmr.mgh.harvard.edu/fswiki/BugReporting FileDrop: https://gate.nmr.mgh.harvard.edu/filedrop2 www.nmr.mgh.harvard.edu/facility/filedrop/index.html http://www.nmr.mgh.harvard.edu/facility/filedrop/index.html Outgoing: ftp://surfer.nmr.mgh.harvard.edu/transfer/outgoing/flat/greve/
Freesurfer mailing list Freesurfer@nmr.mgh.harvard.edu https://mail.nmr.mgh.harvard.edu/mailman/listinfo/freesurfer
Joseph Dien, Senior Research Scientist University of Maryland
E-mail: jdien07@mac.com mailto:jdien07@mac.com mailto:jdien07@mac.com Phone: 202-297-8117 http://joedien.com//
-- Douglas N. Greve, Ph.D. MGH-NMR Center greve@nmr.mgh.harvard.edu mailto:greve@nmr.mgh.harvard.edu Phone Number: 617-724-2358 Fax: 617-726-7422
Bugs: surfer.nmr.mgh.harvard.edu/fswiki/BugReporting FileDrop: https://gate.nmr.mgh.harvard.edu/filedrop2 www.nmr.mgh.harvard.edu/facility/filedrop/index.html Outgoing: ftp://surfer.nmr.mgh.harvard.edu/transfer/outgoing/flat/greve/
Joseph Dien, Senior Research Scientist University of Maryland
E-mail: jdien07@mac.com mailto:jdien07@mac.com Phone: 202-297-8117 http://joedien.com//
It's a little complicated. Basically there were eight runs, comprising four conditions (me, we, you1, you2) each with two adjoining runs. For the analysis, I merged each of the pairs into a single run and added a nuisance regressor to account for the difference in run means. There were a total of four different kinds of boxcars (AR, CS, EM, MP). So 4x4=16 conditions. There was also a covariate of non-interest to mark the switch point for each boxcar, one for each run, so 20 total.
The 7 nuisance regressors are six movement covariates plus one to account for merging eight runs into four (it consists of 1 for the first half and -1 for the second, so the difference in the run means). I'm using the movement covariates from a prior SPM run since ARTdetect (for detecting bad volumes) isn't set up for AFNI style data. From all published accounts the different movement detection routines yield similar enough results that it shouldn't be a problem (consistent with what I found when I compared them for this dataset).
You're thinking that collinearity could have reduced the effect sizes? When I correlate the X.X regressor matrix, the 20 predictors don't correlate by more than about .2 at worst. I do see greater correlations with some of the nuisance regressors (as high as the .4 range). Are my betas unusually small for FSFAST analyses? They did come up clusterwise significant at least. Or should I not worry? I'm not sure what to expect from FSFAST analyses.
Thanks!
Joe
On Jul 17, 2013, at 3:58 PM, Douglas N Greve greve@nmr.mgh.harvard.edu wrote:
why do you have 20 conditions? And what are the 7 nuisance regressors?
On 07/17/2013 03:54 PM, Joseph Dien wrote:
It's a boxcar design so 20.265.
mkanalysis-sess -fsd bold -analysis CPA.sm05.lh -surface fsaverage lh -fwhm 5 -event-related-paradigm CPA1.par -nconditions 20 -spmhrf 0 -TR 2 -refeventdur 20.265 -polyfit 2 -per-run -force -nuisreg nuisreg2.dat 7 -tpexclude tpexclude.dat
On Jul 17, 2013, at 3:50 PM, Douglas N Greve <greve@nmr.mgh.harvard.edu mailto:greve@nmr.mgh.harvard.edu> wrote:
when you ran mkanalysis-sess, what did you set --refeventdur to? On 07/17/2013 02:50 PM, Joseph Dien wrote:
then I get on the order of .02% difference between the contrasted conditions. The run mean values are in my expected ballpark of about 100 or so. The condition betas are just very very small. Or perhaps this is typical of FSFAST analyses?
On Jul 17, 2013, at 2:00 PM, Douglas N Greve <greve@nmr.mgh.harvard.edu mailto:greve@nmr.mgh.harvard.edu mailto:greve@nmr.mgh.harvard.edu> wrote:
The beta's have already been scaled. What do you get if you just beta/runmean ?
On 07/17/2013 01:45 PM, Joseph Dien wrote:
I implemented the ROI percent signal change formula following the MarsBaR FAQ (http://marsbar.sourceforge.net/faq.html) but the values I'm getting seem too small (on the order of .0002%). Basically the formula is the (beta * peak absolute value of the canonical HRF regressor * 100)/(run mean). No derivatives in this case as it is a boxcar design.
I took the mean across all the runs since FSFAST uses the same regressor across the entire experiment (unlike SPM). I used the X.runflac(1).flac.ev(m).Xirf values for the canonical HRF as you suggested (where m equals the condition+1).
Is it possible that I'm missing something in the scaling here? Especially with a boxcar design, the signal change should be much larger than this for a significant cluster, I think. For example, the peak HRF value for one of the conditions is 0.0092. If the betas are already scaled according to the peak value, then it would come out as .02%, which is more reasonable, although still too small.
Thanks for your help with this!
Joe
On May 31, 2013, at 5:02 PM, Douglas N Greve <greve@NMR.MGH.HARVARD.EDU mailto:greve@NMR.MGH.HARVARD.EDU mailto:greve@NMR.MGH.HARVARD.EDU mailto:greve@NMR.MGH.HARVARD.EDU> wrote:
> > Oh, right, it is probably not there for subcortical. I don't know > what I > would have to do to write it out. It won't be something that happens > before I get back from HBM. Can you remind me after HBM? > doug > > On 05/31/2013 04:44 PM, Joseph Dien wrote: >> It looks like the corrected vertex p-values >> (ex: cache.th13.abs.sig.voxel.nii.gz) are only available for the >> surface-based lh and rh spaces. For the subcortical volume-based >> analysis I don't see the corresponding corrected voxel p-values >> being >> available? >> >> On May 31, 2013, at 2:46 PM, Joseph Dien <jdien07@mac.com >> mailto:jdien07@mac.com mailto:jdien07@mac.com >> mailto:jdien07@mac.com >> mailto:jdien07@mac.com> wrote: >> >>> >>> On May 31, 2013, at 12:11 PM, Douglas N Greve >>> <greve@nmr.mgh.harvard.edu mailto:greve@nmr.mgh.harvard.edu >>> mailto:greve@nmr.mgh.harvard.edu >>> mailto:greve@nmr.mgh.harvard.edu >>> mailto:greve@nmr.mgh.harvard.edu> wrote: >>> >>>> >>>> On 05/31/2013 01:49 AM, Joseph Dien wrote: >>>>> I was able to make more progress so I'm mostly good at this >>>>> point but >>>>> I have a remaining question: >>>>> >>>>> I assume the contents of sig.nii.gz (which I assume are the >>>>> vertex >>>>> p-values) are not FWE corrected. Is it possible to get >>>>> FWE-corrected >>>>> vertex p-values? Or are only clusterwise corrections available? >>>> There should be something like cache.th13.abs.sig.voxel.mgh >>>> which is >>>> corrected on a voxelwise basis (the th13 is just part of the name >>>> but it >>>> should be the same regardless of the threshold you choose) >>>> doug >>> >>> Excellent! Thanks! :) >>> >>>>> >>>>> Thanks again for your patience! >>>>> >>>>> Joe >>>>> >>>>> On May 30, 2013, at 4:37 PM, Joseph Dien <jdien07@mac.com >>>>> mailto:jdien07@mac.com mailto:jdien07@mac.com >>>>> mailto:jdien07@mac.com >>>>> mailto:jdien07@mac.com >>>>> mailto:jdien07@mac.com> wrote: >>>>> >>>>>> Just to make sure I'm doing this right, I'm going to >>>>>> summarize what >>>>>> I've taken away from your answers and to ask some new >>>>>> questions. In >>>>>> order to present the results, I need two things: >>>>>> >>>>>> 1) A set of histograms (with error bars) for each cluster >>>>>> figure to >>>>>> show the % signal change for each of the four contrasts of >>>>>> interest. >>>>>> The cache.th20.pos.y.ocn.dat file only gives it for the >>>>>> condition >>>>>> where the cluster was significant so I can't use that. >>>>>> So I could use mri_label2vol to convert >>>>>> cache.th20.neg.sig.ocn.annot >>>>>> from the group level analysis to generate a mask for each >>>>>> cluster of >>>>>> interest. >>>>>> Then I could extract the value of the voxels from each >>>>>> subject's cespct file for each contrast, average them across the >>>>>> cluster ROI, then average them across each subject, to >>>>>> generate the >>>>>> histogram? >>>>>> This would suffice to give me the %age signal change? >>>>>> I would be doing these computations in Matlab using MRIread. >>>>>> >>>>>> 2) A results table with the headings: >>>>>> >>>>>> Cluster p (FWE corrected) >>>>>> Cluster size >>>>>> Peak Voxel p (FWE corrected) >>>>>> Peak Voxel T >>>>>> Peak Voxel Coords >>>>>> BA >>>>>> Anatomical Landmark >>>>>> >>>>>> I can get the first two from >>>>>> the cache.th20.pos/neg.sig.cluster.summary files from the group >>>>>> level >>>>>> analysis. >>>>>> I can get the peak voxel coordinates from the summary files >>>>>> as well. >>>>>> I can use this to get the peak voxel p from the group >>>>>> level sig.nii.gz file. Is this FWE corrected? If not, how can >>>>>> I get >>>>>> this information? >>>>>> I can use these coordinates to get the peak voxel T by >>>>>> getting the >>>>>> value from the group level F.nii.gz file and taking its >>>>>> square root. >>>>>> How can I get the sign of the T statistic? >>>>>> I can use the Lancaster transform to convert the MNI305 peak >>>>>> voxel >>>>>> coordinates into the Atlas coordinates to look up the putative >>>>>> BA and >>>>>> landmarks (unless there is a better way with Freesurfer? >>>>>> I'm seeing >>>>>> some references to some BA labels in the forum but it >>>>>> doesn't look >>>>>> like this is a complete set yet?). >>>>>> >>>>>> Sorry for all these questions! I got some nice results from >>>>>> FSFAST >>>>>> and would like to get them written up. >>>>>> >>>>>> Cheers! >>>>>> >>>>>> Joe >>>>>> >>>>>> >>>>>> >>>>>> >>>>>> On May 29, 2013, at 10:53 PM, Douglas Greve >>>>>> <greve@nmr.mgh.harvard.edu >>>>>> mailto:greve@nmr.mgh.harvard.edu >>>>>> mailto:greve@nmr.mgh.harvard.edu >>>>>> mailto:greve@nmr.mgh.harvard.edu >>>>>> mailto:greve@nmr.mgh.harvard.edu >>>>>> mailto:greve@nmr.mgh.harvard.edu> wrote: >>>>>> >>>>>>> >>>>>>> On 5/29/13 10:42 PM, Joseph Dien wrote: >>>>>>>> >>>>>>>> On May 29, 2013, at 11:40 AM, Douglas N Greve >>>>>>>> <greve@NMR.MGH.HARVARD.EDU >>>>>>>> mailto:greve@NMR.MGH.HARVARD.EDU >>>>>>>> mailto:greve@NMR.MGH.HARVARD.EDU >>>>>>>> mailto:greve@NMR.MGH.HARVARD.EDU >>>>>>>> mailto:greve@NMR.MGH.HARVARD.EDU >>>>>>>> mailto:greve@NMR.MGH.HARVARD.EDU> wrote: >>>>>>>> >>>>>>>>> Hi Joe, >>>>>>>>> >>>>>>>>> On 05/29/2013 01:00 AM, Joseph Dien wrote: >>>>>>>>>> I need to extract the beta weights from a cluster identified >>>>>>>>>> with >>>>>>>>>> FS-Fast in order to compute percentage signal change. >>>>>>>>>> >>>>>>>>>> 1) I see a file called beta.nii.gz that appears to have >>>>>>>>>> the beta >>>>>>>>>> weight information. It has a four dimensional structure >>>>>>>>>> and the >>>>>>>>>> fourth dimension appears to be the beta weights. Is >>>>>>>>>> there an >>>>>>>>>> index >>>>>>>>>> somewhere as to which beta weight is which? Or if not, how >>>>>>>>>> are they >>>>>>>>>> organized? >>>>>>>>> For the first level analysis, the first N beta weights >>>>>>>>> correspond >>>>>>>>> to the >>>>>>>>> N conditions in the paradigm file. The rest are nuisance >>>>>>>>> variables. >>>>>>>>>> >>>>>>>> >>>>>>>> Ah, very good! In order to compute the percent signal change >>>>>>>> statistic (I'm following the MarsBaR approach: >>>>>>>> http://marsbar.sourceforge.net/faq.html#how-is-the-percent-signal-change-cal...) >>>>>>>> >>>>>>>> >>>>>>>> >>>>>>>> I'm also going to need the beta weights for the session mean >>>>>>>> regressors. How are the nuisance regressors organized? >>>>>>> You can just use the meanfunc.nii.gz. Also, each contrasts is >>>>>>> computed as the simple contrast (ces) and as a percent of the >>>>>>> baseline at the voxel (cespct, cesvarpct). >>>>>>>> >>>>>>>>>> 2) In order to extract the cluster, it looks like I would >>>>>>>>>> use mri_label2vol to convert >>>>>>>>>> cache.th20.neg.sig.ocn.annot into a >>>>>>>>>> volume where the voxels are tagged with the number of the >>>>>>>>>> corresponding cluster. >>>>>>>>> Is that from a group analysis? >>>>>>>>>> >>>>>>>> >>>>>>>> Yes, that's right. >>>>>>>> >>>>>>>>>> I could then use that to generate masks to extract the >>>>>>>>>> information I >>>>>>>>>> need for each cluster from beta.nii.gz. >>>>>>>>> If this is from a group analysis, then there should >>>>>>>>> already be >>>>>>>>> a file >>>>>>>>> there (something.y.ocn.dat) that has a value for each subject >>>>>>>>> in the >>>>>>>>> rows and a value for each cluster in the columns. >>>>>>>>>> >>>>>>>> >>>>>>>> I see it. Are these values already scaled as percent signal >>>>>>>> change? If so, that would be wonderful! :) >>>>>>> Only if you specified it when you ran isxconcat-sess. Note >>>>>>> that the >>>>>>> "non-scaled" values are actually scaled to percent of grand >>>>>>> mean >>>>>>> intensity. >>>>>>>> >>>>>>>>>> Is that correct? >>>>>>>>>> >>>>>>>>>> 3) The final information that I would need is the >>>>>>>>>> canonical hrf >>>>>>>>>> shape >>>>>>>>>> generated by FSFAST for a single event. I guess I could >>>>>>>>>> generate >>>>>>>>>> that >>>>>>>>>> by setting up a dummy analysis run with a single event >>>>>>>>>> of the >>>>>>>>>> desired >>>>>>>>>> duration and then look in the X variable in the resulting >>>>>>>>>> X.mat file? >>>>>>>>> try this >>>>>>>>> plot(X.runflac(1).flac.ev(2).tirf, >>>>>>>>> X.runflac(1).flac.ev(2).Xirf) >>>>>>>>>> >>>>>>>> >>>>>>>> Perfect! :) >>>>>>>> >>>>>>>>>> Sorry for all the questions! >>>>>>>>>> >>>>>>>>>> Joe >>>>>>>>>> >>>>>>>>>> >>>>>>>>>> >>>>>>>>>> >> >> >> >> >> >> >> >> >> >> >> > > -- > Douglas N. Greve, Ph.D. > MGH-NMR Center > greve@nmr.mgh.harvard.edu mailto:greve@nmr.mgh.harvard.edu > mailto:greve@nmr.mgh.harvard.edu mailto:greve@nmr.mgh.harvard.edu > Phone Number: 617-724-2358 > Fax: 617-726-7422 > > Bugs: surfer.nmr.mgh.harvard.edu/fswiki/BugReporting > FileDrop: https://gate.nmr.mgh.harvard.edu/filedrop2 > www.nmr.mgh.harvard.edu/facility/filedrop/index.html > http://www.nmr.mgh.harvard.edu/facility/filedrop/index.html > http://www.nmr.mgh.harvard.edu/facility/filedrop/index.html > Outgoing: > ftp://surfer.nmr.mgh.harvard.edu/transfer/outgoing/flat/greve/ > > _______________________________________________ > Freesurfer mailing list > Freesurfer@nmr.mgh.harvard.edu > mailto:Freesurfer@nmr.mgh.harvard.edu > https://mail.nmr.mgh.harvard.edu/mailman/listinfo/freesurfer > > > The information in this e-mail is intended only for the person to > whom it is > addressed. If you believe this e-mail was sent to you in error and > the e-mail > contains patient information, please contact the Partners Compliance > HelpLine at > http://www.partners.org/complianceline . If the e-mail was sent to > you in error > but does not contain patient information, please contact the sender > and properly > dispose of the e-mail. >
Joseph Dien, Senior Research Scientist University of Maryland
E-mail: jdien07@mac.com mailto:jdien07@mac.com mailto:jdien07@mac.com mailto:jdien07@mac.com Phone: 202-297-8117 http://joedien.com//
-- Douglas N. Greve, Ph.D. MGH-NMR Center greve@nmr.mgh.harvard.edu mailto:greve@nmr.mgh.harvard.edu mailto:greve@nmr.mgh.harvard.edu Phone Number: 617-724-2358 Fax: 617-726-7422
Bugs: surfer.nmr.mgh.harvard.edu/fswiki/BugReporting FileDrop: https://gate.nmr.mgh.harvard.edu/filedrop2 www.nmr.mgh.harvard.edu/facility/filedrop/index.html http://www.nmr.mgh.harvard.edu/facility/filedrop/index.html Outgoing: ftp://surfer.nmr.mgh.harvard.edu/transfer/outgoing/flat/greve/
Freesurfer mailing list Freesurfer@nmr.mgh.harvard.edu https://mail.nmr.mgh.harvard.edu/mailman/listinfo/freesurfer
Joseph Dien, Senior Research Scientist University of Maryland
E-mail: jdien07@mac.com mailto:jdien07@mac.com mailto:jdien07@mac.com Phone: 202-297-8117 http://joedien.com//
-- Douglas N. Greve, Ph.D. MGH-NMR Center greve@nmr.mgh.harvard.edu mailto:greve@nmr.mgh.harvard.edu Phone Number: 617-724-2358 Fax: 617-726-7422
Bugs: surfer.nmr.mgh.harvard.edu/fswiki/BugReporting FileDrop: https://gate.nmr.mgh.harvard.edu/filedrop2 www.nmr.mgh.harvard.edu/facility/filedrop/index.html Outgoing: ftp://surfer.nmr.mgh.harvard.edu/transfer/outgoing/flat/greve/
Joseph Dien, Senior Research Scientist University of Maryland
E-mail: jdien07@mac.com mailto:jdien07@mac.com Phone: 202-297-8117 http://joedien.com//
-- Douglas N. Greve, Ph.D. MGH-NMR Center greve@nmr.mgh.harvard.edu Phone Number: 617-724-2358 Fax: 617-726-7422
Bugs: surfer.nmr.mgh.harvard.edu/fswiki/BugReporting FileDrop: https://gate.nmr.mgh.harvard.edu/filedrop2 www.nmr.mgh.harvard.edu/facility/filedrop/index.html Outgoing: ftp://surfer.nmr.mgh.harvard.edu/transfer/outgoing/flat/greve/
Freesurfer mailing list Freesurfer@nmr.mgh.harvard.edu https://mail.nmr.mgh.harvard.edu/mailman/listinfo/freesurfer
--------------------------------------------------------------------------------
Joseph Dien, Senior Research Scientist University of Maryland
E-mail: jdien07@mac.com Phone: 202-297-8117 http://joedien.com//
It is not necessary or beneficial to combine the runs in this way. FSFAST will do all this for you and keep account of all the runs and transitions. FSFAST will put in regressors to fit each of the run means. The single regressor you have is not the right way to hand this (at least I don't understand how it works). It could be that the low % signal change is related to the colinearity between the task waveform and the mean regressors. Can you set things up in the way that FSFAST expects them and don't use any nuisance regressors?
Also, in what area are you looking at the percent change? .02% sounds very small, but may be if it is in some cognitive area, maybe it is ok. If it is in visual cortex, then it looks way too low.
Also, can you send the paradigm file?
doug
On 07/17/2013 04:27 PM, Joseph Dien wrote:
It's a little complicated. Basically there were eight runs, comprising four conditions (me, we, you1, you2) each with two adjoining runs. For the analysis, I merged each of the pairs into a single run and added a nuisance regressor to account for the difference in run means. There were a total of four different kinds of boxcars (AR, CS, EM, MP). So 4x4=16 conditions. There was also a covariate of non-interest to mark the switch point for each boxcar, one for each run, so 20 total.
The 7 nuisance regressors are six movement covariates plus one to account for merging eight runs into four (it consists of 1 for the first half and -1 for the second, so the difference in the run means). I'm using the movement covariates from a prior SPM run since ARTdetect (for detecting bad volumes) isn't set up for AFNI style data. From all published accounts the different movement detection routines yield similar enough results that it shouldn't be a problem (consistent with what I found when I compared them for this dataset).
You're thinking that collinearity could have reduced the effect sizes? When I correlate the X.X regressor matrix, the 20 predictors don't correlate by more than about .2 at worst. I do see greater correlations with some of the nuisance regressors (as high as the .4 range). Are my betas unusually small for FSFAST analyses? They did come up clusterwise significant at least. Or should I not worry? I'm not sure what to expect from FSFAST analyses.
Thanks!
Joe
On Jul 17, 2013, at 3:58 PM, Douglas N Greve <greve@nmr.mgh.harvard.edu mailto:greve@nmr.mgh.harvard.edu> wrote:
why do you have 20 conditions? And what are the 7 nuisance regressors?
On 07/17/2013 03:54 PM, Joseph Dien wrote:
It's a boxcar design so 20.265.
mkanalysis-sess -fsd bold -analysis CPA.sm05.lh -surface fsaverage lh -fwhm 5 -event-related-paradigm CPA1.par -nconditions 20 -spmhrf 0 -TR 2 -refeventdur 20.265 -polyfit 2 -per-run -force -nuisreg nuisreg2.dat 7 -tpexclude tpexclude.dat
On Jul 17, 2013, at 3:50 PM, Douglas N Greve s. <greve@nmr.mgh.harvard.edu mailto:greve@nmr.mgh.harvard.edu mailto:greve@nmr.mgh.harvard.edu> wrote:
when you ran mkanalysis-sess, what did you set --refeventdur to? On 07/17/2013 02:50 PM, Joseph Dien wrote:
then I get on the order of .02% difference between the contrasted conditions. The run mean values are in my expected ballpark of about 100 or so. The condition betas are just very very small. Or perhaps this is typical of FSFAST analyses?
On Jul 17, 2013, at 2:00 PM, Douglas N Greve <greve@nmr.mgh.harvard.edu mailto:greve@nmr.mgh.harvard.edu mailto:greve@nmr.mgh.harvard.edu mailto:greve@nmr.mgh.harvard.edu> wrote:
The beta's have already been scaled. What do you get if you just beta/runmean ?
On 07/17/2013 01:45 PM, Joseph Dien wrote: > I implemented the ROI percent signal change formula following the > MarsBaR FAQ (http://marsbar.sourceforge.net/faq.html) but the values > I'm getting seem too small (on the order of .0002%). Basically the > formula is the (beta * peak absolute value of the canonical HRF > regressor * 100)/(run mean). No derivatives in this case as it is a > boxcar design. > > I took the mean across all the runs since FSFAST uses the same > regressor across the entire experiment (unlike SPM). > I used the X.runflac(1).flac.ev(m).Xirf values for the canonical HRF > as you suggested (where m equals the condition+1). > > Is it possible that I'm missing something in the scaling here? > Especially with a boxcar design, the signal change should be much > larger than this for a significant cluster, I think. For > example, the > peak HRF value for one of the conditions is 0.0092. If the > betas are > already scaled according to the peak value, then it would come > out as > .02%, which is more reasonable, although still too small. > > Thanks for your help with this! > > Joe > > > > On May 31, 2013, at 5:02 PM, Douglas N Greve > <greve@NMR.MGH.HARVARD.EDU mailto:greve@NMR.MGH.HARVARD.EDU > mailto:greve@NMR.MGH.HARVARD.EDU > mailto:greve@NMR.MGH.HARVARD.EDU > mailto:greve@NMR.MGH.HARVARD.EDU> wrote: > >> >> Oh, right, it is probably not there for subcortical. I don't know >> what I >> would have to do to write it out. It won't be something that >> happens >> before I get back from HBM. Can you remind me after HBM? >> doug >> >> On 05/31/2013 04:44 PM, Joseph Dien wrote: >>> It looks like the corrected vertex p-values >>> (ex: cache.th13.abs.sig.voxel.nii.gz) are only available for the >>> surface-based lh and rh spaces. For the subcortical volume-based >>> analysis I don't see the corresponding corrected voxel p-values >>> being >>> available? >>> >>> On May 31, 2013, at 2:46 PM, Joseph Dien <jdien07@mac.com >>> mailto:jdien07@mac.com >>> mailto:jdien07@mac.com mailto:jdien07@mac.com >>> mailto:jdien07@mac.com >>> mailto:jdien07@mac.com> wrote: >>> >>>> >>>> On May 31, 2013, at 12:11 PM, Douglas N Greve >>>> <greve@nmr.mgh.harvard.edu mailto:greve@nmr.mgh.harvard.edu >>>> mailto:greve@nmr.mgh.harvard.edu >>>> mailto:greve@nmr.mgh.harvard.edu >>>> mailto:greve@nmr.mgh.harvard.edu >>>> mailto:greve@nmr.mgh.harvard.edu> wrote: >>>> >>>>> >>>>> On 05/31/2013 01:49 AM, Joseph Dien wrote: >>>>>> I was able to make more progress so I'm mostly good at this >>>>>> point but >>>>>> I have a remaining question: >>>>>> >>>>>> I assume the contents of sig.nii.gz (which I assume are the >>>>>> vertex >>>>>> p-values) are not FWE corrected. Is it possible to get >>>>>> FWE-corrected >>>>>> vertex p-values? Or are only clusterwise corrections >>>>>> available? >>>>> There should be something like cache.th13.abs.sig.voxel.mgh >>>>> which is >>>>> corrected on a voxelwise basis (the th13 is just part of the >>>>> name >>>>> but it >>>>> should be the same regardless of the threshold you choose) >>>>> doug >>>> >>>> Excellent! Thanks! :) >>>> >>>>>> >>>>>> Thanks again for your patience! >>>>>> >>>>>> Joe >>>>>> >>>>>> On May 30, 2013, at 4:37 PM, Joseph Dien <jdien07@mac.com >>>>>> mailto:jdien07@mac.com >>>>>> mailto:jdien07@mac.com mailto:jdien07@mac.com >>>>>> mailto:jdien07@mac.com >>>>>> mailto:jdien07@mac.com >>>>>> mailto:jdien07@mac.com> wrote: >>>>>> >>>>>>> Just to make sure I'm doing this right, I'm going to >>>>>>> summarize what >>>>>>> I've taken away from your answers and to ask some new >>>>>>> questions. In >>>>>>> order to present the results, I need two things: >>>>>>> >>>>>>> 1) A set of histograms (with error bars) for each cluster >>>>>>> figure to >>>>>>> show the % signal change for each of the four contrasts of >>>>>>> interest. >>>>>>> The cache.th20.pos.y.ocn.dat file only gives it for the >>>>>>> condition >>>>>>> where the cluster was significant so I can't use that. >>>>>>> So I could use mri_label2vol to convert >>>>>>> cache.th20.neg.sig.ocn.annot >>>>>>> from the group level analysis to generate a mask for each >>>>>>> cluster of >>>>>>> interest. >>>>>>> Then I could extract the value of the voxels from each >>>>>>> subject's cespct file for each contrast, average them >>>>>>> across the >>>>>>> cluster ROI, then average them across each subject, to >>>>>>> generate the >>>>>>> histogram? >>>>>>> This would suffice to give me the %age signal change? >>>>>>> I would be doing these computations in Matlab using MRIread. >>>>>>> >>>>>>> 2) A results table with the headings: >>>>>>> >>>>>>> Cluster p (FWE corrected) >>>>>>> Cluster size >>>>>>> Peak Voxel p (FWE corrected) >>>>>>> Peak Voxel T >>>>>>> Peak Voxel Coords >>>>>>> BA >>>>>>> Anatomical Landmark >>>>>>> >>>>>>> I can get the first two from >>>>>>> the cache.th20.pos/neg.sig.cluster.summary files from the >>>>>>> group >>>>>>> level >>>>>>> analysis. >>>>>>> I can get the peak voxel coordinates from the summary files >>>>>>> as well. >>>>>>> I can use this to get the peak voxel p from the group >>>>>>> level sig.nii.gz file. Is this FWE corrected? If not, >>>>>>> how can >>>>>>> I get >>>>>>> this information? >>>>>>> I can use these coordinates to get the peak voxel T by >>>>>>> getting the >>>>>>> value from the group level F.nii.gz file and taking its >>>>>>> square root. >>>>>>> How can I get the sign of the T statistic? >>>>>>> I can use the Lancaster transform to convert the MNI305 peak >>>>>>> voxel >>>>>>> coordinates into the Atlas coordinates to look up the putative >>>>>>> BA and >>>>>>> landmarks (unless there is a better way with Freesurfer? >>>>>>> I'm seeing >>>>>>> some references to some BA labels in the forum but it >>>>>>> doesn't look >>>>>>> like this is a complete set yet?). >>>>>>> >>>>>>> Sorry for all these questions! I got some nice results from >>>>>>> FSFAST >>>>>>> and would like to get them written up. >>>>>>> >>>>>>> Cheers! >>>>>>> >>>>>>> Joe >>>>>>> >>>>>>> >>>>>>> >>>>>>> >>>>>>> On May 29, 2013, at 10:53 PM, Douglas Greve >>>>>>> <greve@nmr.mgh.harvard.edu mailto:greve@nmr.mgh.harvard.edu >>>>>>> mailto:greve@nmr.mgh.harvard.edu >>>>>>> mailto:greve@nmr.mgh.harvard.edu >>>>>>> mailto:greve@nmr.mgh.harvard.edu >>>>>>> mailto:greve@nmr.mgh.harvard.edu >>>>>>> mailto:greve@nmr.mgh.harvard.edu> wrote: >>>>>>> >>>>>>>> >>>>>>>> On 5/29/13 10:42 PM, Joseph Dien wrote: >>>>>>>>> >>>>>>>>> On May 29, 2013, at 11:40 AM, Douglas N Greve >>>>>>>>> <greve@NMR.MGH.HARVARD.EDU >>>>>>>>> mailto:greve@NMR.MGH.HARVARD.EDU >>>>>>>>> mailto:greve@NMR.MGH.HARVARD.EDU >>>>>>>>> mailto:greve@NMR.MGH.HARVARD.EDU >>>>>>>>> mailto:greve@NMR.MGH.HARVARD.EDU >>>>>>>>> mailto:greve@NMR.MGH.HARVARD.EDU >>>>>>>>> mailto:greve@NMR.MGH.HARVARD.EDU> wrote: >>>>>>>>> >>>>>>>>>> Hi Joe, >>>>>>>>>> >>>>>>>>>> On 05/29/2013 01:00 AM, Joseph Dien wrote: >>>>>>>>>>> I need to extract the beta weights from a cluster >>>>>>>>>>> identified >>>>>>>>>>> with >>>>>>>>>>> FS-Fast in order to compute percentage signal change. >>>>>>>>>>> >>>>>>>>>>> 1) I see a file called beta.nii.gz that appears to have >>>>>>>>>>> the beta >>>>>>>>>>> weight information. It has a four dimensional structure >>>>>>>>>>> and the >>>>>>>>>>> fourth dimension appears to be the beta weights. Is >>>>>>>>>>> there an >>>>>>>>>>> index >>>>>>>>>>> somewhere as to which beta weight is which? Or if >>>>>>>>>>> not, how >>>>>>>>>>> are they >>>>>>>>>>> organized? >>>>>>>>>> For the first level analysis, the first N beta weights >>>>>>>>>> correspond >>>>>>>>>> to the >>>>>>>>>> N conditions in the paradigm file. The rest are nuisance >>>>>>>>>> variables. >>>>>>>>>>> >>>>>>>>> >>>>>>>>> Ah, very good! In order to compute the percent signal >>>>>>>>> change >>>>>>>>> statistic (I'm following the MarsBaR approach: >>>>>>>>> http://marsbar.sourceforge.net/faq.html#how-is-the-percent-signal-change-cal...) >>>>>>>>> >>>>>>>>> >>>>>>>>> >>>>>>>>> >>>>>>>>> I'm also going to need the beta weights for the session mean >>>>>>>>> regressors. How are the nuisance regressors organized? >>>>>>>> You can just use the meanfunc.nii.gz. Also, each contrasts is >>>>>>>> computed as the simple contrast (ces) and as a percent of the >>>>>>>> baseline at the voxel (cespct, cesvarpct). >>>>>>>>> >>>>>>>>>>> 2) In order to extract the cluster, it looks like I would >>>>>>>>>>> use mri_label2vol to convert >>>>>>>>>>> cache.th20.neg.sig.ocn.annot into a >>>>>>>>>>> volume where the voxels are tagged with the number of the >>>>>>>>>>> corresponding cluster. >>>>>>>>>> Is that from a group analysis? >>>>>>>>>>> >>>>>>>>> >>>>>>>>> Yes, that's right. >>>>>>>>> >>>>>>>>>>> I could then use that to generate masks to extract the >>>>>>>>>>> information I >>>>>>>>>>> need for each cluster from beta.nii.gz. >>>>>>>>>> If this is from a group analysis, then there should >>>>>>>>>> already be >>>>>>>>>> a file >>>>>>>>>> there (something.y.ocn.dat) that has a value for each >>>>>>>>>> subject >>>>>>>>>> in the >>>>>>>>>> rows and a value for each cluster in the columns. >>>>>>>>>>> >>>>>>>>> >>>>>>>>> I see it. Are these values already scaled as percent signal >>>>>>>>> change? If so, that would be wonderful! :) >>>>>>>> Only if you specified it when you ran isxconcat-sess. Note >>>>>>>> that the >>>>>>>> "non-scaled" values are actually scaled to percent of grand >>>>>>>> mean >>>>>>>> intensity. >>>>>>>>> >>>>>>>>>>> Is that correct? >>>>>>>>>>> >>>>>>>>>>> 3) The final information that I would need is the >>>>>>>>>>> canonical hrf >>>>>>>>>>> shape >>>>>>>>>>> generated by FSFAST for a single event. I guess I could >>>>>>>>>>> generate >>>>>>>>>>> that >>>>>>>>>>> by setting up a dummy analysis run with a single event >>>>>>>>>>> of the >>>>>>>>>>> desired >>>>>>>>>>> duration and then look in the X variable in the resulting >>>>>>>>>>> X.mat file? >>>>>>>>>> try this >>>>>>>>>> plot(X.runflac(1).flac.ev(2).tirf, >>>>>>>>>> X.runflac(1).flac.ev(2).Xirf) >>>>>>>>>>> >>>>>>>>> >>>>>>>>> Perfect! :) >>>>>>>>> >>>>>>>>>>> Sorry for all the questions! >>>>>>>>>>> >>>>>>>>>>> Joe >>>>>>>>>>> >>>>>>>>>>> >>>>>>>>>>> >>>>>>>>>>> >>> >>> >>> >>> >>> >>> >>> >>> >>> >>> >>> >> >> -- >> Douglas N. Greve, Ph.D. >> MGH-NMR Center >> greve@nmr.mgh.harvard.edu mailto:greve@nmr.mgh.harvard.edu >> mailto:greve@nmr.mgh.harvard.edu >> mailto:greve@nmr.mgh.harvard.edu >> mailto:greve@nmr.mgh.harvard.edu >> Phone Number: 617-724-2358 >> Fax: 617-726-7422 >> >> Bugs: surfer.nmr.mgh.harvard.edu/fswiki/BugReporting >> FileDrop: https://gate.nmr.mgh.harvard.edu/filedrop2 >> www.nmr.mgh.harvard.edu/facility/filedrop/index.html >> http://www.nmr.mgh.harvard.edu/facility/filedrop/index.html >> http://www.nmr.mgh.harvard.edu/facility/filedrop/index.html >> http://www.nmr.mgh.harvard.edu/facility/filedrop/index.html >> Outgoing: >> ftp://surfer.nmr.mgh.harvard.edu/transfer/outgoing/flat/greve/ >> >> _______________________________________________ >> Freesurfer mailing list >> Freesurfer@nmr.mgh.harvard.edu >> mailto:Freesurfer@nmr.mgh.harvard.edu >> https://mail.nmr.mgh.harvard.edu/mailman/listinfo/freesurfer >> >> >> The information in this e-mail is intended only for the person to >> whom it is >> addressed. If you believe this e-mail was sent to you in error and >> the e-mail >> contains patient information, please contact the Partners >> Compliance >> HelpLine at >> http://www.partners.org/complianceline . If the e-mail was sent to >> you in error >> but does not contain patient information, please contact the sender >> and properly >> dispose of the e-mail. >> > > > -------------------------------------------------------------------------------- > > Joseph Dien, > Senior Research Scientist > University of Maryland > > E-mail: jdien07@mac.com mailto:jdien07@mac.com > mailto:jdien07@mac.com > mailto:jdien07@mac.com mailto:jdien07@mac.com > Phone: 202-297-8117 > http://joedien.com// > > > > > > > > > > > >
-- Douglas N. Greve, Ph.D. MGH-NMR Center greve@nmr.mgh.harvard.edu mailto:greve@nmr.mgh.harvard.edu mailto:greve@nmr.mgh.harvard.edu mailto:greve@nmr.mgh.harvard.edu Phone Number: 617-724-2358 Fax: 617-726-7422
Bugs: surfer.nmr.mgh.harvard.edu/fswiki/BugReporting FileDrop: https://gate.nmr.mgh.harvard.edu/filedrop2 www.nmr.mgh.harvard.edu/facility/filedrop/index.html http://www.nmr.mgh.harvard.edu/facility/filedrop/index.html http://www.nmr.mgh.harvard.edu/facility/filedrop/index.html Outgoing: ftp://surfer.nmr.mgh.harvard.edu/transfer/outgoing/flat/greve/
Freesurfer mailing list Freesurfer@nmr.mgh.harvard.edu https://mail.nmr.mgh.harvard.edu/mailman/listinfo/freesurfer
Joseph Dien, Senior Research Scientist University of Maryland
E-mail: jdien07@mac.com mailto:jdien07@mac.com mailto:jdien07@mac.com mailto:jdien07@mac.com Phone: 202-297-8117 http://joedien.com//
-- Douglas N. Greve, Ph.D. MGH-NMR Center greve@nmr.mgh.harvard.edu mailto:greve@nmr.mgh.harvard.edu mailto:greve@nmr.mgh.harvard.edu Phone Number: 617-724-2358 Fax: 617-726-7422
Bugs: surfer.nmr.mgh.harvard.edu/fswiki/BugReporting FileDrop: https://gate.nmr.mgh.harvard.edu/filedrop2 www.nmr.mgh.harvard.edu/facility/filedrop/index.html http://www.nmr.mgh.harvard.edu/facility/filedrop/index.html Outgoing: ftp://surfer.nmr.mgh.harvard.edu/transfer/outgoing/flat/greve/
Joseph Dien, Senior Research Scientist University of Maryland
E-mail: jdien07@mac.com mailto:jdien07@mac.com mailto:jdien07@mac.com Phone: 202-297-8117 http://joedien.com//
-- Douglas N. Greve, Ph.D. MGH-NMR Center greve@nmr.mgh.harvard.edu mailto:greve@nmr.mgh.harvard.edu Phone Number: 617-724-2358 Fax: 617-726-7422
Bugs: surfer.nmr.mgh.harvard.edu/fswiki/BugReporting FileDrop: https://gate.nmr.mgh.harvard.edu/filedrop2 www.nmr.mgh.harvard.edu/facility/filedrop/index.html Outgoing: ftp://surfer.nmr.mgh.harvard.edu/transfer/outgoing/flat/greve/
Freesurfer mailing list Freesurfer@nmr.mgh.harvard.edu https://mail.nmr.mgh.harvard.edu/mailman/listinfo/freesurfer
Joseph Dien, Senior Research Scientist University of Maryland
E-mail: jdien07@mac.com mailto:jdien07@mac.com Phone: 202-297-8117 http://joedien.com//
The single nuisance regressor models the difference between the merged runs. So if the first run had a mean of 90 and the second run had a mean of 110 then the merged run mean would be 100. The nuisance regressor has 1s for the volumes of the first run and -1s for the volumes of the second run so it ends up with a beta value of 10, thus accounting for the difference between these two sets of volumes. I think it does make sense.
In any case, while it was necessary to do so for my original SPM analyses since it uses a separate covariates for each run, after working through the FSFAST procedures with your help I see that is not the case for FSFAST (a single regressor models a given condition in all the runs). I'll try doing as you suggest to see what difference it makes.
It is indeed cognitive areas and the manipulations are subtle social cognition manipulations so perhaps not surprising after all.
I'll send you the paradigm file separately.
Thanks for taking the time to look into this!
Joe
On Jul 17, 2013, at 4:38 PM, Douglas N Greve greve@nmr.mgh.harvard.edu wrote:
It is not necessary or beneficial to combine the runs in this way. FSFAST will do all this for you and keep account of all the runs and transitions. FSFAST will put in regressors to fit each of the run means. The single regressor you have is not the right way to hand this (at least I don't understand how it works). It could be that the low % signal change is related to the colinearity between the task waveform and the mean regressors. Can you set things up in the way that FSFAST expects them and don't use any nuisance regressors?
Also, in what area are you looking at the percent change? .02% sounds very small, but may be if it is in some cognitive area, maybe it is ok. If it is in visual cortex, then it looks way too low.
Also, can you send the paradigm file?
doug
On 07/17/2013 04:27 PM, Joseph Dien wrote:
It's a little complicated. Basically there were eight runs, comprising four conditions (me, we, you1, you2) each with two adjoining runs. For the analysis, I merged each of the pairs into a single run and added a nuisance regressor to account for the difference in run means. There were a total of four different kinds of boxcars (AR, CS, EM, MP). So 4x4=16 conditions. There was also a covariate of non-interest to mark the switch point for each boxcar, one for each run, so 20 total.
The 7 nuisance regressors are six movement covariates plus one to account for merging eight runs into four (it consists of 1 for the first half and -1 for the second, so the difference in the run means). I'm using the movement covariates from a prior SPM run since ARTdetect (for detecting bad volumes) isn't set up for AFNI style data. From all published accounts the different movement detection routines yield similar enough results that it shouldn't be a problem (consistent with what I found when I compared them for this dataset).
You're thinking that collinearity could have reduced the effect sizes? When I correlate the X.X regressor matrix, the 20 predictors don't correlate by more than about .2 at worst. I do see greater correlations with some of the nuisance regressors (as high as the .4 range). Are my betas unusually small for FSFAST analyses? They did come up clusterwise significant at least. Or should I not worry? I'm not sure what to expect from FSFAST analyses.
Thanks!
Joe
On Jul 17, 2013, at 3:58 PM, Douglas N Greve <greve@nmr.mgh.harvard.edu mailto:greve@nmr.mgh.harvard.edu> wrote:
why do you have 20 conditions? And what are the 7 nuisance regressors?
On 07/17/2013 03:54 PM, Joseph Dien wrote:
It's a boxcar design so 20.265.
mkanalysis-sess -fsd bold -analysis CPA.sm05.lh -surface fsaverage lh -fwhm 5 -event-related-paradigm CPA1.par -nconditions 20 -spmhrf 0 -TR 2 -refeventdur 20.265 -polyfit 2 -per-run -force -nuisreg nuisreg2.dat 7 -tpexclude tpexclude.dat
On Jul 17, 2013, at 3:50 PM, Douglas N Greve s. <greve@nmr.mgh.harvard.edu mailto:greve@nmr.mgh.harvard.edu mailto:greve@nmr.mgh.harvard.edu> wrote:
when you ran mkanalysis-sess, what did you set --refeventdur to? On 07/17/2013 02:50 PM, Joseph Dien wrote:
then I get on the order of .02% difference between the contrasted conditions. The run mean values are in my expected ballpark of about 100 or so. The condition betas are just very very small. Or perhaps this is typical of FSFAST analyses?
On Jul 17, 2013, at 2:00 PM, Douglas N Greve <greve@nmr.mgh.harvard.edu mailto:greve@nmr.mgh.harvard.edu mailto:greve@nmr.mgh.harvard.edu mailto:greve@nmr.mgh.harvard.edu> wrote:
> > The beta's have already been scaled. What do you get if you just > beta/runmean ? > > > > On 07/17/2013 01:45 PM, Joseph Dien wrote: >> I implemented the ROI percent signal change formula following the >> MarsBaR FAQ (http://marsbar.sourceforge.net/faq.html) but the values >> I'm getting seem too small (on the order of .0002%). Basically the >> formula is the (beta * peak absolute value of the canonical HRF >> regressor * 100)/(run mean). No derivatives in this case as it is a >> boxcar design. >> >> I took the mean across all the runs since FSFAST uses the same >> regressor across the entire experiment (unlike SPM). >> I used the X.runflac(1).flac.ev(m).Xirf values for the canonical HRF >> as you suggested (where m equals the condition+1). >> >> Is it possible that I'm missing something in the scaling here? >> Especially with a boxcar design, the signal change should be much >> larger than this for a significant cluster, I think. For >> example, the >> peak HRF value for one of the conditions is 0.0092. If the >> betas are >> already scaled according to the peak value, then it would come >> out as >> .02%, which is more reasonable, although still too small. >> >> Thanks for your help with this! >> >> Joe >> >> >> >> On May 31, 2013, at 5:02 PM, Douglas N Greve >> <greve@NMR.MGH.HARVARD.EDU mailto:greve@NMR.MGH.HARVARD.EDU >> mailto:greve@NMR.MGH.HARVARD.EDU >> mailto:greve@NMR.MGH.HARVARD.EDU >> mailto:greve@NMR.MGH.HARVARD.EDU> wrote: >> >>> >>> Oh, right, it is probably not there for subcortical. I don't know >>> what I >>> would have to do to write it out. It won't be something that >>> happens >>> before I get back from HBM. Can you remind me after HBM? >>> doug >>> >>> On 05/31/2013 04:44 PM, Joseph Dien wrote: >>>> It looks like the corrected vertex p-values >>>> (ex: cache.th13.abs.sig.voxel.nii.gz) are only available for the >>>> surface-based lh and rh spaces. For the subcortical volume-based >>>> analysis I don't see the corresponding corrected voxel p-values >>>> being >>>> available? >>>> >>>> On May 31, 2013, at 2:46 PM, Joseph Dien <jdien07@mac.com >>>> mailto:jdien07@mac.com >>>> mailto:jdien07@mac.com mailto:jdien07@mac.com >>>> mailto:jdien07@mac.com >>>> mailto:jdien07@mac.com> wrote: >>>> >>>>> >>>>> On May 31, 2013, at 12:11 PM, Douglas N Greve >>>>> <greve@nmr.mgh.harvard.edu mailto:greve@nmr.mgh.harvard.edu >>>>> mailto:greve@nmr.mgh.harvard.edu >>>>> mailto:greve@nmr.mgh.harvard.edu >>>>> mailto:greve@nmr.mgh.harvard.edu >>>>> mailto:greve@nmr.mgh.harvard.edu> wrote: >>>>> >>>>>> >>>>>> On 05/31/2013 01:49 AM, Joseph Dien wrote: >>>>>>> I was able to make more progress so I'm mostly good at this >>>>>>> point but >>>>>>> I have a remaining question: >>>>>>> >>>>>>> I assume the contents of sig.nii.gz (which I assume are the >>>>>>> vertex >>>>>>> p-values) are not FWE corrected. Is it possible to get >>>>>>> FWE-corrected >>>>>>> vertex p-values? Or are only clusterwise corrections >>>>>>> available? >>>>>> There should be something like cache.th13.abs.sig.voxel.mgh >>>>>> which is >>>>>> corrected on a voxelwise basis (the th13 is just part of the >>>>>> name >>>>>> but it >>>>>> should be the same regardless of the threshold you choose) >>>>>> doug >>>>> >>>>> Excellent! Thanks! :) >>>>> >>>>>>> >>>>>>> Thanks again for your patience! >>>>>>> >>>>>>> Joe >>>>>>> >>>>>>> On May 30, 2013, at 4:37 PM, Joseph Dien <jdien07@mac.com >>>>>>> mailto:jdien07@mac.com >>>>>>> mailto:jdien07@mac.com mailto:jdien07@mac.com >>>>>>> mailto:jdien07@mac.com >>>>>>> mailto:jdien07@mac.com >>>>>>> mailto:jdien07@mac.com> wrote: >>>>>>> >>>>>>>> Just to make sure I'm doing this right, I'm going to >>>>>>>> summarize what >>>>>>>> I've taken away from your answers and to ask some new >>>>>>>> questions. In >>>>>>>> order to present the results, I need two things: >>>>>>>> >>>>>>>> 1) A set of histograms (with error bars) for each cluster >>>>>>>> figure to >>>>>>>> show the % signal change for each of the four contrasts of >>>>>>>> interest. >>>>>>>> The cache.th20.pos.y.ocn.dat file only gives it for the >>>>>>>> condition >>>>>>>> where the cluster was significant so I can't use that. >>>>>>>> So I could use mri_label2vol to convert >>>>>>>> cache.th20.neg.sig.ocn.annot >>>>>>>> from the group level analysis to generate a mask for each >>>>>>>> cluster of >>>>>>>> interest. >>>>>>>> Then I could extract the value of the voxels from each >>>>>>>> subject's cespct file for each contrast, average them >>>>>>>> across the >>>>>>>> cluster ROI, then average them across each subject, to >>>>>>>> generate the >>>>>>>> histogram? >>>>>>>> This would suffice to give me the %age signal change? >>>>>>>> I would be doing these computations in Matlab using MRIread. >>>>>>>> >>>>>>>> 2) A results table with the headings: >>>>>>>> >>>>>>>> Cluster p (FWE corrected) >>>>>>>> Cluster size >>>>>>>> Peak Voxel p (FWE corrected) >>>>>>>> Peak Voxel T >>>>>>>> Peak Voxel Coords >>>>>>>> BA >>>>>>>> Anatomical Landmark >>>>>>>> >>>>>>>> I can get the first two from >>>>>>>> the cache.th20.pos/neg.sig.cluster.summary files from the >>>>>>>> group >>>>>>>> level >>>>>>>> analysis. >>>>>>>> I can get the peak voxel coordinates from the summary files >>>>>>>> as well. >>>>>>>> I can use this to get the peak voxel p from the group >>>>>>>> level sig.nii.gz file. Is this FWE corrected? If not, >>>>>>>> how can >>>>>>>> I get >>>>>>>> this information? >>>>>>>> I can use these coordinates to get the peak voxel T by >>>>>>>> getting the >>>>>>>> value from the group level F.nii.gz file and taking its >>>>>>>> square root. >>>>>>>> How can I get the sign of the T statistic? >>>>>>>> I can use the Lancaster transform to convert the MNI305 peak >>>>>>>> voxel >>>>>>>> coordinates into the Atlas coordinates to look up the putative >>>>>>>> BA and >>>>>>>> landmarks (unless there is a better way with Freesurfer? >>>>>>>> I'm seeing >>>>>>>> some references to some BA labels in the forum but it >>>>>>>> doesn't look >>>>>>>> like this is a complete set yet?). >>>>>>>> >>>>>>>> Sorry for all these questions! I got some nice results from >>>>>>>> FSFAST >>>>>>>> and would like to get them written up. >>>>>>>> >>>>>>>> Cheers! >>>>>>>> >>>>>>>> Joe >>>>>>>> >>>>>>>> >>>>>>>> >>>>>>>> >>>>>>>> On May 29, 2013, at 10:53 PM, Douglas Greve >>>>>>>> <greve@nmr.mgh.harvard.edu mailto:greve@nmr.mgh.harvard.edu >>>>>>>> mailto:greve@nmr.mgh.harvard.edu >>>>>>>> mailto:greve@nmr.mgh.harvard.edu >>>>>>>> mailto:greve@nmr.mgh.harvard.edu >>>>>>>> mailto:greve@nmr.mgh.harvard.edu >>>>>>>> mailto:greve@nmr.mgh.harvard.edu> wrote: >>>>>>>> >>>>>>>>> >>>>>>>>> On 5/29/13 10:42 PM, Joseph Dien wrote: >>>>>>>>>> >>>>>>>>>> On May 29, 2013, at 11:40 AM, Douglas N Greve >>>>>>>>>> <greve@NMR.MGH.HARVARD.EDU >>>>>>>>>> mailto:greve@NMR.MGH.HARVARD.EDU >>>>>>>>>> mailto:greve@NMR.MGH.HARVARD.EDU >>>>>>>>>> mailto:greve@NMR.MGH.HARVARD.EDU >>>>>>>>>> mailto:greve@NMR.MGH.HARVARD.EDU >>>>>>>>>> mailto:greve@NMR.MGH.HARVARD.EDU >>>>>>>>>> mailto:greve@NMR.MGH.HARVARD.EDU> wrote: >>>>>>>>>> >>>>>>>>>>> Hi Joe, >>>>>>>>>>> >>>>>>>>>>> On 05/29/2013 01:00 AM, Joseph Dien wrote: >>>>>>>>>>>> I need to extract the beta weights from a cluster >>>>>>>>>>>> identified >>>>>>>>>>>> with >>>>>>>>>>>> FS-Fast in order to compute percentage signal change. >>>>>>>>>>>> >>>>>>>>>>>> 1) I see a file called beta.nii.gz that appears to have >>>>>>>>>>>> the beta >>>>>>>>>>>> weight information. It has a four dimensional structure >>>>>>>>>>>> and the >>>>>>>>>>>> fourth dimension appears to be the beta weights. Is >>>>>>>>>>>> there an >>>>>>>>>>>> index >>>>>>>>>>>> somewhere as to which beta weight is which? Or if >>>>>>>>>>>> not, how >>>>>>>>>>>> are they >>>>>>>>>>>> organized? >>>>>>>>>>> For the first level analysis, the first N beta weights >>>>>>>>>>> correspond >>>>>>>>>>> to the >>>>>>>>>>> N conditions in the paradigm file. The rest are nuisance >>>>>>>>>>> variables. >>>>>>>>>>>> >>>>>>>>>> >>>>>>>>>> Ah, very good! In order to compute the percent signal >>>>>>>>>> change >>>>>>>>>> statistic (I'm following the MarsBaR approach: >>>>>>>>>> http://marsbar.sourceforge.net/faq.html#how-is-the-percent-signal-change-cal...) >>>>>>>>>> >>>>>>>>>> >>>>>>>>>> >>>>>>>>>> >>>>>>>>>> I'm also going to need the beta weights for the session mean >>>>>>>>>> regressors. How are the nuisance regressors organized? >>>>>>>>> You can just use the meanfunc.nii.gz. Also, each contrasts is >>>>>>>>> computed as the simple contrast (ces) and as a percent of the >>>>>>>>> baseline at the voxel (cespct, cesvarpct). >>>>>>>>>> >>>>>>>>>>>> 2) In order to extract the cluster, it looks like I would >>>>>>>>>>>> use mri_label2vol to convert >>>>>>>>>>>> cache.th20.neg.sig.ocn.annot into a >>>>>>>>>>>> volume where the voxels are tagged with the number of the >>>>>>>>>>>> corresponding cluster. >>>>>>>>>>> Is that from a group analysis? >>>>>>>>>>>> >>>>>>>>>> >>>>>>>>>> Yes, that's right. >>>>>>>>>> >>>>>>>>>>>> I could then use that to generate masks to extract the >>>>>>>>>>>> information I >>>>>>>>>>>> need for each cluster from beta.nii.gz. >>>>>>>>>>> If this is from a group analysis, then there should >>>>>>>>>>> already be >>>>>>>>>>> a file >>>>>>>>>>> there (something.y.ocn.dat) that has a value for each >>>>>>>>>>> subject >>>>>>>>>>> in the >>>>>>>>>>> rows and a value for each cluster in the columns. >>>>>>>>>>>> >>>>>>>>>> >>>>>>>>>> I see it. Are these values already scaled as percent signal >>>>>>>>>> change? If so, that would be wonderful! :) >>>>>>>>> Only if you specified it when you ran isxconcat-sess. Note >>>>>>>>> that the >>>>>>>>> "non-scaled" values are actually scaled to percent of grand >>>>>>>>> mean >>>>>>>>> intensity. >>>>>>>>>> >>>>>>>>>>>> Is that correct? >>>>>>>>>>>> >>>>>>>>>>>> 3) The final information that I would need is the >>>>>>>>>>>> canonical hrf >>>>>>>>>>>> shape >>>>>>>>>>>> generated by FSFAST for a single event. I guess I could >>>>>>>>>>>> generate >>>>>>>>>>>> that >>>>>>>>>>>> by setting up a dummy analysis run with a single event >>>>>>>>>>>> of the >>>>>>>>>>>> desired >>>>>>>>>>>> duration and then look in the X variable in the resulting >>>>>>>>>>>> X.mat file? >>>>>>>>>>> try this >>>>>>>>>>> plot(X.runflac(1).flac.ev(2).tirf, >>>>>>>>>>> X.runflac(1).flac.ev(2).Xirf) >>>>>>>>>>>> >>>>>>>>>> >>>>>>>>>> Perfect! :) >>>>>>>>>> >>>>>>>>>>>> Sorry for all the questions! >>>>>>>>>>>> >>>>>>>>>>>> Joe >>>>>>>>>>>> >>>>>>>>>>>> >>>>>>>>>>>> >>>>>>>>>>>> >>>> >>>> >>>> >>>> >>>> >>>> >>>> >>>> >>>> >>>> >>>> >>> >>> -- >>> Douglas N. Greve, Ph.D. >>> MGH-NMR Center >>> greve@nmr.mgh.harvard.edu mailto:greve@nmr.mgh.harvard.edu >>> mailto:greve@nmr.mgh.harvard.edu >>> mailto:greve@nmr.mgh.harvard.edu >>> mailto:greve@nmr.mgh.harvard.edu >>> Phone Number: 617-724-2358 >>> Fax: 617-726-7422 >>> >>> Bugs: surfer.nmr.mgh.harvard.edu/fswiki/BugReporting >>> FileDrop: https://gate.nmr.mgh.harvard.edu/filedrop2 >>> www.nmr.mgh.harvard.edu/facility/filedrop/index.html >>> http://www.nmr.mgh.harvard.edu/facility/filedrop/index.html >>> http://www.nmr.mgh.harvard.edu/facility/filedrop/index.html >>> http://www.nmr.mgh.harvard.edu/facility/filedrop/index.html >>> Outgoing: >>> ftp://surfer.nmr.mgh.harvard.edu/transfer/outgoing/flat/greve/ >>> >>> _______________________________________________ >>> Freesurfer mailing list >>> Freesurfer@nmr.mgh.harvard.edu >>> mailto:Freesurfer@nmr.mgh.harvard.edu >>> https://mail.nmr.mgh.harvard.edu/mailman/listinfo/freesurfer >>> >>> >>> The information in this e-mail is intended only for the person to >>> whom it is >>> addressed. If you believe this e-mail was sent to you in error and >>> the e-mail >>> contains patient information, please contact the Partners >>> Compliance >>> HelpLine at >>> http://www.partners.org/complianceline . If the e-mail was sent to >>> you in error >>> but does not contain patient information, please contact the sender >>> and properly >>> dispose of the e-mail. >>> >> >> >> -------------------------------------------------------------------------------- >> >> Joseph Dien, >> Senior Research Scientist >> University of Maryland >> >> E-mail: jdien07@mac.com mailto:jdien07@mac.com >> mailto:jdien07@mac.com >> mailto:jdien07@mac.com mailto:jdien07@mac.com >> Phone: 202-297-8117 >> http://joedien.com// >> >> >> >> >> >> >> >> >> >> >> >> > > -- > Douglas N. Greve, Ph.D. > MGH-NMR Center > greve@nmr.mgh.harvard.edu mailto:greve@nmr.mgh.harvard.edu > mailto:greve@nmr.mgh.harvard.edu > mailto:greve@nmr.mgh.harvard.edu > Phone Number: 617-724-2358 > Fax: 617-726-7422 > > Bugs: surfer.nmr.mgh.harvard.edu/fswiki/BugReporting > FileDrop: https://gate.nmr.mgh.harvard.edu/filedrop2 > www.nmr.mgh.harvard.edu/facility/filedrop/index.html > http://www.nmr.mgh.harvard.edu/facility/filedrop/index.html > http://www.nmr.mgh.harvard.edu/facility/filedrop/index.html > Outgoing: > ftp://surfer.nmr.mgh.harvard.edu/transfer/outgoing/flat/greve/ > > _______________________________________________ > Freesurfer mailing list > Freesurfer@nmr.mgh.harvard.edu > https://mail.nmr.mgh.harvard.edu/mailman/listinfo/freesurfer
Joseph Dien, Senior Research Scientist University of Maryland
E-mail: jdien07@mac.com mailto:jdien07@mac.com mailto:jdien07@mac.com mailto:jdien07@mac.com Phone: 202-297-8117 http://joedien.com//
-- Douglas N. Greve, Ph.D. MGH-NMR Center greve@nmr.mgh.harvard.edu mailto:greve@nmr.mgh.harvard.edu mailto:greve@nmr.mgh.harvard.edu Phone Number: 617-724-2358 Fax: 617-726-7422
Bugs: surfer.nmr.mgh.harvard.edu/fswiki/BugReporting FileDrop: https://gate.nmr.mgh.harvard.edu/filedrop2 www.nmr.mgh.harvard.edu/facility/filedrop/index.html http://www.nmr.mgh.harvard.edu/facility/filedrop/index.html Outgoing: ftp://surfer.nmr.mgh.harvard.edu/transfer/outgoing/flat/greve/
Joseph Dien, Senior Research Scientist University of Maryland
E-mail: jdien07@mac.com mailto:jdien07@mac.com mailto:jdien07@mac.com Phone: 202-297-8117 http://joedien.com//
-- Douglas N. Greve, Ph.D. MGH-NMR Center greve@nmr.mgh.harvard.edu mailto:greve@nmr.mgh.harvard.edu Phone Number: 617-724-2358 Fax: 617-726-7422
Bugs: surfer.nmr.mgh.harvard.edu/fswiki/BugReporting FileDrop: https://gate.nmr.mgh.harvard.edu/filedrop2 www.nmr.mgh.harvard.edu/facility/filedrop/index.html Outgoing: ftp://surfer.nmr.mgh.harvard.edu/transfer/outgoing/flat/greve/
Freesurfer mailing list Freesurfer@nmr.mgh.harvard.edu https://mail.nmr.mgh.harvard.edu/mailman/listinfo/freesurfer
Joseph Dien, Senior Research Scientist University of Maryland
E-mail: jdien07@mac.com mailto:jdien07@mac.com Phone: 202-297-8117 http://joedien.com//
-- Douglas N. Greve, Ph.D. MGH-NMR Center greve@nmr.mgh.harvard.edu Phone Number: 617-724-2358 Fax: 617-726-7422
Bugs: surfer.nmr.mgh.harvard.edu/fswiki/BugReporting FileDrop: https://gate.nmr.mgh.harvard.edu/filedrop2 www.nmr.mgh.harvard.edu/facility/filedrop/index.html Outgoing: ftp://surfer.nmr.mgh.harvard.edu/transfer/outgoing/flat/greve/
Freesurfer mailing list Freesurfer@nmr.mgh.harvard.edu https://mail.nmr.mgh.harvard.edu/mailman/listinfo/freesurfer
--------------------------------------------------------------------------------
Joseph Dien, Senior Research Scientist University of Maryland
E-mail: jdien07@mac.com Phone: 202-297-8117 http://joedien.com//
On 07/17/2013 04:48 PM, Joseph Dien wrote:
The single nuisance regressor models the difference between the merged runs. So if the first run had a mean of 90 and the second run had a mean of 110 then the merged run mean would be 100. The nuisance regressor has 1s for the volumes of the first run and -1s for the volumes of the second run so it ends up with a beta value of 10, thus accounting for the difference between these two sets of volumes. I think it does make sense.
Do you do this in a single regressor? So you would have a +1 -1 pattern repeated 4 times? I think to make it work, you would need 4 regressors. In any event, FSFAST will do the right thing, so maybe it is not important.
In any case, while it was necessary to do so for my original SPM analyses since it uses a separate covariates for each run, after working through the FSFAST procedures with your help I see that is not the case for FSFAST (a single regressor models a given condition in all the runs). I'll try doing as you suggest to see what difference it makes.
It is indeed cognitive areas and the manipulations are subtle social cognition manipulations so perhaps not surprising after all.
I'll send you the paradigm file separately.
Thanks for taking the time to look into this!
Joe
On Jul 17, 2013, at 4:38 PM, Douglas N Greve <greve@nmr.mgh.harvard.edu mailto:greve@nmr.mgh.harvard.edu> wrote:
It is not necessary or beneficial to combine the runs in this way. FSFAST will do all this for you and keep account of all the runs and transitions. FSFAST will put in regressors to fit each of the run means. The single regressor you have is not the right way to hand this (at least I don't understand how it works). It could be that the low % signal change is related to the colinearity between the task waveform and the mean regressors. Can you set things up in the way that FSFAST expects them and don't use any nuisance regressors?
Also, in what area are you looking at the percent change? .02% sounds very small, but may be if it is in some cognitive area, maybe it is ok. If it is in visual cortex, then it looks way too low.
Also, can you send the paradigm file?
doug
On 07/17/2013 04:27 PM, Joseph Dien wrote:
It's a little complicated. Basically there were eight runs, comprising four conditions (me, we, you1, you2) each with two adjoining runs. For the analysis, I merged each of the pairs into a single run and added a nuisance regressor to account for the difference in run means. There were a total of four different kinds of boxcars (AR, CS, EM, MP). So 4x4=16 conditions. There was also a covariate of non-interest to mark the switch point for each boxcar, one for each run, so 20 total.
The 7 nuisance regressors are six movement covariates plus one to account for merging eight runs into four (it consists of 1 for the first half and -1 for the second, so the difference in the run means). I'm using the movement covariates from a prior SPM run since ARTdetect (for detecting bad volumes) isn't set up for AFNI style data. From all published accounts the different movement detection routines yield similar enough results that it shouldn't be a problem (consistent with what I found when I compared them for this dataset).
You're thinking that collinearity could have reduced the effect sizes? When I correlate the X.X regressor matrix, the 20 predictors don't correlate by more than about .2 at worst. I do see greater correlations with some of the nuisance regressors (as high as the .4 range). Are my betas unusually small for FSFAST analyses? They did come up clusterwise significant at least. Or should I not worry? I'm not sure what to expect from FSFAST analyses.
Thanks!
Joe
On Jul 17, 2013, at 3:58 PM, Douglas N Greve <greve@nmr.mgh.harvard.edu mailto:greve@nmr.mgh.harvard.edu mailto:greve@nmr.mgh.harvard.edu> wrote:
why do you have 20 conditions? And what are the 7 nuisance regressors?
On 07/17/2013 03:54 PM, Joseph Dien wrote:
It's a boxcar design so 20.265.
mkanalysis-sess -fsd bold -analysis CPA.sm05.lh -surface fsaverage lh -fwhm 5 -event-related-paradigm CPA1.par -nconditions 20 -spmhrf 0 -TR 2 -refeventdur 20.265 -polyfit 2 -per-run -force -nuisreg nuisreg2.dat 7 -tpexclude tpexclude.dat
On Jul 17, 2013, at 3:50 PM, Douglas N Greve s. <greve@nmr.mgh.harvard.edu mailto:greve@nmr.mgh.harvard.edu mailto:greve@nmr.mgh.harvard.edu mailto:greve@nmr.mgh.harvard.edu> wrote:
when you ran mkanalysis-sess, what did you set --refeventdur to? On 07/17/2013 02:50 PM, Joseph Dien wrote: > then I get on the order of .02% difference between the contrasted > conditions. > The run mean values are in my expected ballpark of about 100 or so. > The condition betas are just very very small. > Or perhaps this is typical of FSFAST analyses? > > On Jul 17, 2013, at 2:00 PM, Douglas N Greve > <greve@nmr.mgh.harvard.edu mailto:greve@nmr.mgh.harvard.edu > mailto:greve@nmr.mgh.harvard.edu > mailto:greve@nmr.mgh.harvard.edu > mailto:greve@nmr.mgh.harvard.edu> wrote: > >> >> The beta's have already been scaled. What do you get if you just >> beta/runmean ? >> >> >> >> On 07/17/2013 01:45 PM, Joseph Dien wrote: >>> I implemented the ROI percent signal change formula following the >>> MarsBaR FAQ (http://marsbar.sourceforge.net/faq.html) but the >>> values >>> I'm getting seem too small (on the order of .0002%). >>> Basically the >>> formula is the (beta * peak absolute value of the canonical HRF >>> regressor * 100)/(run mean). No derivatives in this case as >>> it is a >>> boxcar design. >>> >>> I took the mean across all the runs since FSFAST uses the same >>> regressor across the entire experiment (unlike SPM). >>> I used the X.runflac(1).flac.ev(m).Xirf values for the >>> canonical HRF >>> as you suggested (where m equals the condition+1). >>> >>> Is it possible that I'm missing something in the scaling here? >>> Especially with a boxcar design, the signal change should be much >>> larger than this for a significant cluster, I think. For >>> example, the >>> peak HRF value for one of the conditions is 0.0092. If the >>> betas are >>> already scaled according to the peak value, then it would come >>> out as >>> .02%, which is more reasonable, although still too small. >>> >>> Thanks for your help with this! >>> >>> Joe >>> >>> >>> >>> On May 31, 2013, at 5:02 PM, Douglas N Greve >>> <greve@NMR.MGH.HARVARD.EDU mailto:greve@NMR.MGH.HARVARD.EDU >>> mailto:greve@NMR.MGH.HARVARD.EDU >>> mailto:greve@NMR.MGH.HARVARD.EDU >>> mailto:greve@NMR.MGH.HARVARD.EDU >>> mailto:greve@NMR.MGH.HARVARD.EDU> wrote: >>> >>>> >>>> Oh, right, it is probably not there for subcortical. I don't know >>>> what I >>>> would have to do to write it out. It won't be something that >>>> happens >>>> before I get back from HBM. Can you remind me after HBM? >>>> doug >>>> >>>> On 05/31/2013 04:44 PM, Joseph Dien wrote: >>>>> It looks like the corrected vertex p-values >>>>> (ex: cache.th13.abs.sig.voxel.nii.gz) are only available for the >>>>> surface-based lh and rh spaces. For the subcortical >>>>> volume-based >>>>> analysis I don't see the corresponding corrected voxel p-values >>>>> being >>>>> available? >>>>> >>>>> On May 31, 2013, at 2:46 PM, Joseph Dien <jdien07@mac.com >>>>> mailto:jdien07@mac.com >>>>> mailto:jdien07@mac.com >>>>> mailto:jdien07@mac.com mailto:jdien07@mac.com >>>>> mailto:jdien07@mac.com >>>>> mailto:jdien07@mac.com> wrote: >>>>> >>>>>> >>>>>> On May 31, 2013, at 12:11 PM, Douglas N Greve >>>>>> <greve@nmr.mgh.harvard.edu >>>>>> mailto:greve@nmr.mgh.harvard.edu >>>>>> mailto:greve@nmr.mgh.harvard.edu >>>>>> mailto:greve@nmr.mgh.harvard.edu >>>>>> mailto:greve@nmr.mgh.harvard.edu >>>>>> mailto:greve@nmr.mgh.harvard.edu >>>>>> mailto:greve@nmr.mgh.harvard.edu> wrote: >>>>>> >>>>>>> >>>>>>> On 05/31/2013 01:49 AM, Joseph Dien wrote: >>>>>>>> I was able to make more progress so I'm mostly good at this >>>>>>>> point but >>>>>>>> I have a remaining question: >>>>>>>> >>>>>>>> I assume the contents of sig.nii.gz (which I assume are the >>>>>>>> vertex >>>>>>>> p-values) are not FWE corrected. Is it possible to get >>>>>>>> FWE-corrected >>>>>>>> vertex p-values? Or are only clusterwise corrections >>>>>>>> available? >>>>>>> There should be something like cache.th13.abs.sig.voxel.mgh >>>>>>> which is >>>>>>> corrected on a voxelwise basis (the th13 is just part of the >>>>>>> name >>>>>>> but it >>>>>>> should be the same regardless of the threshold you choose) >>>>>>> doug >>>>>> >>>>>> Excellent! Thanks! :) >>>>>> >>>>>>>> >>>>>>>> Thanks again for your patience! >>>>>>>> >>>>>>>> Joe >>>>>>>> >>>>>>>> On May 30, 2013, at 4:37 PM, Joseph Dien <jdien07@mac.com >>>>>>>> mailto:jdien07@mac.com >>>>>>>> mailto:jdien07@mac.com >>>>>>>> mailto:jdien07@mac.com mailto:jdien07@mac.com >>>>>>>> mailto:jdien07@mac.com >>>>>>>> mailto:jdien07@mac.com >>>>>>>> mailto:jdien07@mac.com> wrote: >>>>>>>> >>>>>>>>> Just to make sure I'm doing this right, I'm going to >>>>>>>>> summarize what >>>>>>>>> I've taken away from your answers and to ask some new >>>>>>>>> questions. In >>>>>>>>> order to present the results, I need two things: >>>>>>>>> >>>>>>>>> 1) A set of histograms (with error bars) for each cluster >>>>>>>>> figure to >>>>>>>>> show the % signal change for each of the four contrasts of >>>>>>>>> interest. >>>>>>>>> The cache.th20.pos.y.ocn.dat file only gives it for the >>>>>>>>> condition >>>>>>>>> where the cluster was significant so I can't use that. >>>>>>>>> So I could use mri_label2vol to convert >>>>>>>>> cache.th20.neg.sig.ocn.annot >>>>>>>>> from the group level analysis to generate a mask for each >>>>>>>>> cluster of >>>>>>>>> interest. >>>>>>>>> Then I could extract the value of the voxels from each >>>>>>>>> subject's cespct file for each contrast, average them >>>>>>>>> across the >>>>>>>>> cluster ROI, then average them across each subject, to >>>>>>>>> generate the >>>>>>>>> histogram? >>>>>>>>> This would suffice to give me the %age signal change? >>>>>>>>> I would be doing these computations in Matlab using MRIread. >>>>>>>>> >>>>>>>>> 2) A results table with the headings: >>>>>>>>> >>>>>>>>> Cluster p (FWE corrected) >>>>>>>>> Cluster size >>>>>>>>> Peak Voxel p (FWE corrected) >>>>>>>>> Peak Voxel T >>>>>>>>> Peak Voxel Coords >>>>>>>>> BA >>>>>>>>> Anatomical Landmark >>>>>>>>> >>>>>>>>> I can get the first two from >>>>>>>>> the cache.th20.pos/neg.sig.cluster.summary files from the >>>>>>>>> group >>>>>>>>> level >>>>>>>>> analysis. >>>>>>>>> I can get the peak voxel coordinates from the summary files >>>>>>>>> as well. >>>>>>>>> I can use this to get the peak voxel p from the group >>>>>>>>> level sig.nii.gz file. Is this FWE corrected? If not, >>>>>>>>> how can >>>>>>>>> I get >>>>>>>>> this information? >>>>>>>>> I can use these coordinates to get the peak voxel T by >>>>>>>>> getting the >>>>>>>>> value from the group level F.nii.gz file and taking its >>>>>>>>> square root. >>>>>>>>> How can I get the sign of the T statistic? >>>>>>>>> I can use the Lancaster transform to convert the MNI305 peak >>>>>>>>> voxel >>>>>>>>> coordinates into the Atlas coordinates to look up the >>>>>>>>> putative >>>>>>>>> BA and >>>>>>>>> landmarks (unless there is a better way with Freesurfer? >>>>>>>>> I'm seeing >>>>>>>>> some references to some BA labels in the forum but it >>>>>>>>> doesn't look >>>>>>>>> like this is a complete set yet?). >>>>>>>>> >>>>>>>>> Sorry for all these questions! I got some nice results from >>>>>>>>> FSFAST >>>>>>>>> and would like to get them written up. >>>>>>>>> >>>>>>>>> Cheers! >>>>>>>>> >>>>>>>>> Joe >>>>>>>>> >>>>>>>>> >>>>>>>>> >>>>>>>>> >>>>>>>>> On May 29, 2013, at 10:53 PM, Douglas Greve >>>>>>>>> <greve@nmr.mgh.harvard.edu >>>>>>>>> mailto:greve@nmr.mgh.harvard.edu >>>>>>>>> mailto:greve@nmr.mgh.harvard.edu >>>>>>>>> mailto:greve@nmr.mgh.harvard.edu >>>>>>>>> mailto:greve@nmr.mgh.harvard.edu >>>>>>>>> mailto:greve@nmr.mgh.harvard.edu >>>>>>>>> mailto:greve@nmr.mgh.harvard.edu >>>>>>>>> mailto:greve@nmr.mgh.harvard.edu> wrote: >>>>>>>>> >>>>>>>>>> >>>>>>>>>> On 5/29/13 10:42 PM, Joseph Dien wrote: >>>>>>>>>>> >>>>>>>>>>> On May 29, 2013, at 11:40 AM, Douglas N Greve >>>>>>>>>>> <greve@NMR.MGH.HARVARD.EDU >>>>>>>>>>> mailto:greve@NMR.MGH.HARVARD.EDU >>>>>>>>>>> mailto:greve@NMR.MGH.HARVARD.EDU >>>>>>>>>>> mailto:greve@NMR.MGH.HARVARD.EDU >>>>>>>>>>> mailto:greve@NMR.MGH.HARVARD.EDU >>>>>>>>>>> mailto:greve@NMR.MGH.HARVARD.EDU >>>>>>>>>>> mailto:greve@NMR.MGH.HARVARD.EDU >>>>>>>>>>> mailto:greve@NMR.MGH.HARVARD.EDU> wrote: >>>>>>>>>>> >>>>>>>>>>>> Hi Joe, >>>>>>>>>>>> >>>>>>>>>>>> On 05/29/2013 01:00 AM, Joseph Dien wrote: >>>>>>>>>>>>> I need to extract the beta weights from a cluster >>>>>>>>>>>>> identified >>>>>>>>>>>>> with >>>>>>>>>>>>> FS-Fast in order to compute percentage signal change. >>>>>>>>>>>>> >>>>>>>>>>>>> 1) I see a file called beta.nii.gz that appears to have >>>>>>>>>>>>> the beta >>>>>>>>>>>>> weight information. It has a four dimensional structure >>>>>>>>>>>>> and the >>>>>>>>>>>>> fourth dimension appears to be the beta weights. Is >>>>>>>>>>>>> there an >>>>>>>>>>>>> index >>>>>>>>>>>>> somewhere as to which beta weight is which? Or if >>>>>>>>>>>>> not, how >>>>>>>>>>>>> are they >>>>>>>>>>>>> organized? >>>>>>>>>>>> For the first level analysis, the first N beta weights >>>>>>>>>>>> correspond >>>>>>>>>>>> to the >>>>>>>>>>>> N conditions in the paradigm file. The rest are nuisance >>>>>>>>>>>> variables. >>>>>>>>>>>>> >>>>>>>>>>> >>>>>>>>>>> Ah, very good! In order to compute the percent signal >>>>>>>>>>> change >>>>>>>>>>> statistic (I'm following the MarsBaR approach: >>>>>>>>>>> http://marsbar.sourceforge.net/faq.html#how-is-the-percent-signal-change-cal...) >>>>>>>>>>> >>>>>>>>>>> >>>>>>>>>>> >>>>>>>>>>> >>>>>>>>>>> >>>>>>>>>>> I'm also going to need the beta weights for the >>>>>>>>>>> session mean >>>>>>>>>>> regressors. How are the nuisance regressors organized? >>>>>>>>>> You can just use the meanfunc.nii.gz. Also, each >>>>>>>>>> contrasts is >>>>>>>>>> computed as the simple contrast (ces) and as a percent >>>>>>>>>> of the >>>>>>>>>> baseline at the voxel (cespct, cesvarpct). >>>>>>>>>>> >>>>>>>>>>>>> 2) In order to extract the cluster, it looks like I >>>>>>>>>>>>> would >>>>>>>>>>>>> use mri_label2vol to convert >>>>>>>>>>>>> cache.th20.neg.sig.ocn.annot into a >>>>>>>>>>>>> volume where the voxels are tagged with the number >>>>>>>>>>>>> of the >>>>>>>>>>>>> corresponding cluster. >>>>>>>>>>>> Is that from a group analysis? >>>>>>>>>>>>> >>>>>>>>>>> >>>>>>>>>>> Yes, that's right. >>>>>>>>>>> >>>>>>>>>>>>> I could then use that to generate masks to extract the >>>>>>>>>>>>> information I >>>>>>>>>>>>> need for each cluster from beta.nii.gz. >>>>>>>>>>>> If this is from a group analysis, then there should >>>>>>>>>>>> already be >>>>>>>>>>>> a file >>>>>>>>>>>> there (something.y.ocn.dat) that has a value for each >>>>>>>>>>>> subject >>>>>>>>>>>> in the >>>>>>>>>>>> rows and a value for each cluster in the columns. >>>>>>>>>>>>> >>>>>>>>>>> >>>>>>>>>>> I see it. Are these values already scaled as percent >>>>>>>>>>> signal >>>>>>>>>>> change? If so, that would be wonderful! :) >>>>>>>>>> Only if you specified it when you ran isxconcat-sess. Note >>>>>>>>>> that the >>>>>>>>>> "non-scaled" values are actually scaled to percent of grand >>>>>>>>>> mean >>>>>>>>>> intensity. >>>>>>>>>>> >>>>>>>>>>>>> Is that correct? >>>>>>>>>>>>> >>>>>>>>>>>>> 3) The final information that I would need is the >>>>>>>>>>>>> canonical hrf >>>>>>>>>>>>> shape >>>>>>>>>>>>> generated by FSFAST for a single event. I guess I could >>>>>>>>>>>>> generate >>>>>>>>>>>>> that >>>>>>>>>>>>> by setting up a dummy analysis run with a single event >>>>>>>>>>>>> of the >>>>>>>>>>>>> desired >>>>>>>>>>>>> duration and then look in the X variable in the >>>>>>>>>>>>> resulting >>>>>>>>>>>>> X.mat file? >>>>>>>>>>>> try this >>>>>>>>>>>> plot(X.runflac(1).flac.ev(2).tirf, >>>>>>>>>>>> X.runflac(1).flac.ev(2).Xirf) >>>>>>>>>>>>> >>>>>>>>>>> >>>>>>>>>>> Perfect! :) >>>>>>>>>>> >>>>>>>>>>>>> Sorry for all the questions! >>>>>>>>>>>>> >>>>>>>>>>>>> Joe >>>>>>>>>>>>> >>>>>>>>>>>>> >>>>>>>>>>>>> >>>>>>>>>>>>> >>>>> >>>>> >>>>> >>>>> >>>>> >>>>> >>>>> >>>>> >>>>> >>>>> >>>>> >>>> >>>> -- >>>> Douglas N. Greve, Ph.D. >>>> MGH-NMR Center >>>> greve@nmr.mgh.harvard.edu mailto:greve@nmr.mgh.harvard.edu >>>> mailto:greve@nmr.mgh.harvard.edu >>>> mailto:greve@nmr.mgh.harvard.edu >>>> mailto:greve@nmr.mgh.harvard.edu >>>> mailto:greve@nmr.mgh.harvard.edu >>>> Phone Number: 617-724-2358 >>>> Fax: 617-726-7422 >>>> >>>> Bugs: surfer.nmr.mgh.harvard.edu/fswiki/BugReporting >>>> FileDrop: https://gate.nmr.mgh.harvard.edu/filedrop2 >>>> www.nmr.mgh.harvard.edu/facility/filedrop/index.html >>>> http://www.nmr.mgh.harvard.edu/facility/filedrop/index.html >>>> http://www.nmr.mgh.harvard.edu/facility/filedrop/index.html >>>> http://www.nmr.mgh.harvard.edu/facility/filedrop/index.html >>>> http://www.nmr.mgh.harvard.edu/facility/filedrop/index.html >>>> Outgoing: >>>> ftp://surfer.nmr.mgh.harvard.edu/transfer/outgoing/flat/greve/ >>>> >>>> _______________________________________________ >>>> Freesurfer mailing list >>>> Freesurfer@nmr.mgh.harvard.edu >>>> mailto:Freesurfer@nmr.mgh.harvard.edu >>>> https://mail.nmr.mgh.harvard.edu/mailman/listinfo/freesurfer >>>> >>>> >>>> The information in this e-mail is intended only for the person to >>>> whom it is >>>> addressed. If you believe this e-mail was sent to you in >>>> error and >>>> the e-mail >>>> contains patient information, please contact the Partners >>>> Compliance >>>> HelpLine at >>>> http://www.partners.org/complianceline . If the e-mail was >>>> sent to >>>> you in error >>>> but does not contain patient information, please contact the >>>> sender >>>> and properly >>>> dispose of the e-mail. >>>> >>> >>> >>> -------------------------------------------------------------------------------- >>> >>> Joseph Dien, >>> Senior Research Scientist >>> University of Maryland >>> >>> E-mail: jdien07@mac.com mailto:jdien07@mac.com >>> mailto:jdien07@mac.com >>> mailto:jdien07@mac.com >>> mailto:jdien07@mac.com mailto:jdien07@mac.com >>> Phone: 202-297-8117 >>> http://joedien.com// >>> >>> >>> >>> >>> >>> >>> >>> >>> >>> >>> >>> >> >> -- >> Douglas N. Greve, Ph.D. >> MGH-NMR Center >> greve@nmr.mgh.harvard.edu mailto:greve@nmr.mgh.harvard.edu >> mailto:greve@nmr.mgh.harvard.edu >> mailto:greve@nmr.mgh.harvard.edu >> mailto:greve@nmr.mgh.harvard.edu >> Phone Number: 617-724-2358 >> Fax: 617-726-7422 >> >> Bugs: surfer.nmr.mgh.harvard.edu/fswiki/BugReporting >> FileDrop: https://gate.nmr.mgh.harvard.edu/filedrop2 >> www.nmr.mgh.harvard.edu/facility/filedrop/index.html >> http://www.nmr.mgh.harvard.edu/facility/filedrop/index.html >> http://www.nmr.mgh.harvard.edu/facility/filedrop/index.html >> http://www.nmr.mgh.harvard.edu/facility/filedrop/index.html >> Outgoing: >> ftp://surfer.nmr.mgh.harvard.edu/transfer/outgoing/flat/greve/ >> >> _______________________________________________ >> Freesurfer mailing list >> Freesurfer@nmr.mgh.harvard.edu >> https://mail.nmr.mgh.harvard.edu/mailman/listinfo/freesurfer > > > -------------------------------------------------------------------------------- > > Joseph Dien, > Senior Research Scientist > University of Maryland > > E-mail: jdien07@mac.com mailto:jdien07@mac.com > mailto:jdien07@mac.com > mailto:jdien07@mac.com > mailto:jdien07@mac.com > Phone: 202-297-8117 > http://joedien.com// > > > > > > > > > > > >
-- Douglas N. Greve, Ph.D. MGH-NMR Center greve@nmr.mgh.harvard.edu mailto:greve@nmr.mgh.harvard.edu mailto:greve@nmr.mgh.harvard.edu mailto:greve@nmr.mgh.harvard.edu Phone Number: 617-724-2358 Fax: 617-726-7422
Bugs: surfer.nmr.mgh.harvard.edu/fswiki/BugReporting FileDrop: https://gate.nmr.mgh.harvard.edu/filedrop2 www.nmr.mgh.harvard.edu/facility/filedrop/index.html http://www.nmr.mgh.harvard.edu/facility/filedrop/index.html http://www.nmr.mgh.harvard.edu/facility/filedrop/index.html Outgoing: ftp://surfer.nmr.mgh.harvard.edu/transfer/outgoing/flat/greve/
Joseph Dien, Senior Research Scientist University of Maryland
E-mail: jdien07@mac.com mailto:jdien07@mac.com mailto:jdien07@mac.com mailto:jdien07@mac.com Phone: 202-297-8117 http://joedien.com//
-- Douglas N. Greve, Ph.D. MGH-NMR Center greve@nmr.mgh.harvard.edu mailto:greve@nmr.mgh.harvard.edu mailto:greve@nmr.mgh.harvard.edu Phone Number: 617-724-2358 Fax: 617-726-7422
Bugs: surfer.nmr.mgh.harvard.edu/fswiki/BugReporting FileDrop: https://gate.nmr.mgh.harvard.edu/filedrop2 www.nmr.mgh.harvard.edu/facility/filedrop/index.html http://www.nmr.mgh.harvard.edu/facility/filedrop/index.html Outgoing: ftp://surfer.nmr.mgh.harvard.edu/transfer/outgoing/flat/greve/
Freesurfer mailing list Freesurfer@nmr.mgh.harvard.edu https://mail.nmr.mgh.harvard.edu/mailman/listinfo/freesurfer
Joseph Dien, Senior Research Scientist University of Maryland
E-mail: jdien07@mac.com mailto:jdien07@mac.com mailto:jdien07@mac.com Phone: 202-297-8117 http://joedien.com//
-- Douglas N. Greve, Ph.D. MGH-NMR Center greve@nmr.mgh.harvard.edu mailto:greve@nmr.mgh.harvard.edu Phone Number: 617-724-2358 Fax: 617-726-7422
Bugs: surfer.nmr.mgh.harvard.edu/fswiki/BugReporting FileDrop: https://gate.nmr.mgh.harvard.edu/filedrop2 www.nmr.mgh.harvard.edu/facility/filedrop/index.html Outgoing: ftp://surfer.nmr.mgh.harvard.edu/transfer/outgoing/flat/greve/
Freesurfer mailing list Freesurfer@nmr.mgh.harvard.edu https://mail.nmr.mgh.harvard.edu/mailman/listinfo/freesurfer
Joseph Dien, Senior Research Scientist University of Maryland
E-mail: jdien07@mac.com mailto:jdien07@mac.com Phone: 202-297-8117 http://joedien.com//
On Jul 17, 2013, at 4:50 PM, Douglas N Greve greve@nmr.mgh.harvard.edu wrote:
On 07/17/2013 04:48 PM, Joseph Dien wrote:
The single nuisance regressor models the difference between the merged runs. So if the first run had a mean of 90 and the second run had a mean of 110 then the merged run mean would be 100. The nuisance regressor has 1s for the volumes of the first run and -1s for the volumes of the second run so it ends up with a beta value of 10, thus accounting for the difference between these two sets of volumes. I think it does make sense.
Do you do this in a single regressor? So you would have a +1 -1 pattern repeated 4 times? I think to make it work, you would need 4 regressors. In any event, FSFAST will do the right thing, so maybe it is not important.
Looking at the X.X file, it did create four nuisance regressors. I'm really impressed with how well FSFAST handles all this! :)
In any case, while it was necessary to do so for my original SPM analyses since it uses a separate covariates for each run, after working through the FSFAST procedures with your help I see that is not the case for FSFAST (a single regressor models a given condition in all the runs). I'll try doing as you suggest to see what difference it makes.
It is indeed cognitive areas and the manipulations are subtle social cognition manipulations so perhaps not surprising after all.
I'll send you the paradigm file separately.
Thanks for taking the time to look into this!
Joe
On Jul 17, 2013, at 4:38 PM, Douglas N Greve <greve@nmr.mgh.harvard.edu mailto:greve@nmr.mgh.harvard.edu> wrote:
It is not necessary or beneficial to combine the runs in this way. FSFAST will do all this for you and keep account of all the runs and transitions. FSFAST will put in regressors to fit each of the run means. The single regressor you have is not the right way to hand this (at least I don't understand how it works). It could be that the low % signal change is related to the colinearity between the task waveform and the mean regressors. Can you set things up in the way that FSFAST expects them and don't use any nuisance regressors?
Also, in what area are you looking at the percent change? .02% sounds very small, but may be if it is in some cognitive area, maybe it is ok. If it is in visual cortex, then it looks way too low.
Also, can you send the paradigm file?
doug
On 07/17/2013 04:27 PM, Joseph Dien wrote:
It's a little complicated. Basically there were eight runs, comprising four conditions (me, we, you1, you2) each with two adjoining runs. For the analysis, I merged each of the pairs into a single run and added a nuisance regressor to account for the difference in run means. There were a total of four different kinds of boxcars (AR, CS, EM, MP). So 4x4=16 conditions. There was also a covariate of non-interest to mark the switch point for each boxcar, one for each run, so 20 total.
The 7 nuisance regressors are six movement covariates plus one to account for merging eight runs into four (it consists of 1 for the first half and -1 for the second, so the difference in the run means). I'm using the movement covariates from a prior SPM run since ARTdetect (for detecting bad volumes) isn't set up for AFNI style data. From all published accounts the different movement detection routines yield similar enough results that it shouldn't be a problem (consistent with what I found when I compared them for this dataset).
You're thinking that collinearity could have reduced the effect sizes? When I correlate the X.X regressor matrix, the 20 predictors don't correlate by more than about .2 at worst. I do see greater correlations with some of the nuisance regressors (as high as the .4 range). Are my betas unusually small for FSFAST analyses? They did come up clusterwise significant at least. Or should I not worry? I'm not sure what to expect from FSFAST analyses.
Thanks!
Joe
On Jul 17, 2013, at 3:58 PM, Douglas N Greve <greve@nmr.mgh.harvard.edu mailto:greve@nmr.mgh.harvard.edu mailto:greve@nmr.mgh.harvard.edu> wrote:
why do you have 20 conditions? And what are the 7 nuisance regressors?
On 07/17/2013 03:54 PM, Joseph Dien wrote:
It's a boxcar design so 20.265.
mkanalysis-sess -fsd bold -analysis CPA.sm05.lh -surface fsaverage lh -fwhm 5 -event-related-paradigm CPA1.par -nconditions 20 -spmhrf 0 -TR 2 -refeventdur 20.265 -polyfit 2 -per-run -force -nuisreg nuisreg2.dat 7 -tpexclude tpexclude.dat
On Jul 17, 2013, at 3:50 PM, Douglas N Greve s. <greve@nmr.mgh.harvard.edu mailto:greve@nmr.mgh.harvard.edu mailto:greve@nmr.mgh.harvard.edu mailto:greve@nmr.mgh.harvard.edu> wrote:
> when you ran mkanalysis-sess, what did you set --refeventdur to? > On 07/17/2013 02:50 PM, Joseph Dien wrote: >> then I get on the order of .02% difference between the contrasted >> conditions. >> The run mean values are in my expected ballpark of about 100 or so. >> The condition betas are just very very small. >> Or perhaps this is typical of FSFAST analyses? >> >> On Jul 17, 2013, at 2:00 PM, Douglas N Greve >> <greve@nmr.mgh.harvard.edu mailto:greve@nmr.mgh.harvard.edu >> mailto:greve@nmr.mgh.harvard.edu >> mailto:greve@nmr.mgh.harvard.edu >> mailto:greve@nmr.mgh.harvard.edu> wrote: >> >>> >>> The beta's have already been scaled. What do you get if you just >>> beta/runmean ? >>> >>> >>> >>> On 07/17/2013 01:45 PM, Joseph Dien wrote: >>>> I implemented the ROI percent signal change formula following the >>>> MarsBaR FAQ (http://marsbar.sourceforge.net/faq.html) but the >>>> values >>>> I'm getting seem too small (on the order of .0002%). >>>> Basically the >>>> formula is the (beta * peak absolute value of the canonical HRF >>>> regressor * 100)/(run mean). No derivatives in this case as >>>> it is a >>>> boxcar design. >>>> >>>> I took the mean across all the runs since FSFAST uses the same >>>> regressor across the entire experiment (unlike SPM). >>>> I used the X.runflac(1).flac.ev(m).Xirf values for the >>>> canonical HRF >>>> as you suggested (where m equals the condition+1). >>>> >>>> Is it possible that I'm missing something in the scaling here? >>>> Especially with a boxcar design, the signal change should be much >>>> larger than this for a significant cluster, I think. For >>>> example, the >>>> peak HRF value for one of the conditions is 0.0092. If the >>>> betas are >>>> already scaled according to the peak value, then it would come >>>> out as >>>> .02%, which is more reasonable, although still too small. >>>> >>>> Thanks for your help with this! >>>> >>>> Joe >>>> >>>> >>>> >>>> On May 31, 2013, at 5:02 PM, Douglas N Greve >>>> <greve@NMR.MGH.HARVARD.EDU mailto:greve@NMR.MGH.HARVARD.EDU >>>> mailto:greve@NMR.MGH.HARVARD.EDU >>>> mailto:greve@NMR.MGH.HARVARD.EDU >>>> mailto:greve@NMR.MGH.HARVARD.EDU >>>> mailto:greve@NMR.MGH.HARVARD.EDU> wrote: >>>> >>>>> >>>>> Oh, right, it is probably not there for subcortical. I don't know >>>>> what I >>>>> would have to do to write it out. It won't be something that >>>>> happens >>>>> before I get back from HBM. Can you remind me after HBM? >>>>> doug >>>>> >>>>> On 05/31/2013 04:44 PM, Joseph Dien wrote: >>>>>> It looks like the corrected vertex p-values >>>>>> (ex: cache.th13.abs.sig.voxel.nii.gz) are only available for the >>>>>> surface-based lh and rh spaces. For the subcortical >>>>>> volume-based >>>>>> analysis I don't see the corresponding corrected voxel p-values >>>>>> being >>>>>> available? >>>>>> >>>>>> On May 31, 2013, at 2:46 PM, Joseph Dien <jdien07@mac.com >>>>>> mailto:jdien07@mac.com >>>>>> mailto:jdien07@mac.com >>>>>> mailto:jdien07@mac.com mailto:jdien07@mac.com >>>>>> mailto:jdien07@mac.com >>>>>> mailto:jdien07@mac.com> wrote: >>>>>> >>>>>>> >>>>>>> On May 31, 2013, at 12:11 PM, Douglas N Greve >>>>>>> <greve@nmr.mgh.harvard.edu >>>>>>> mailto:greve@nmr.mgh.harvard.edu >>>>>>> mailto:greve@nmr.mgh.harvard.edu >>>>>>> mailto:greve@nmr.mgh.harvard.edu >>>>>>> mailto:greve@nmr.mgh.harvard.edu >>>>>>> mailto:greve@nmr.mgh.harvard.edu >>>>>>> mailto:greve@nmr.mgh.harvard.edu> wrote: >>>>>>> >>>>>>>> >>>>>>>> On 05/31/2013 01:49 AM, Joseph Dien wrote: >>>>>>>>> I was able to make more progress so I'm mostly good at this >>>>>>>>> point but >>>>>>>>> I have a remaining question: >>>>>>>>> >>>>>>>>> I assume the contents of sig.nii.gz (which I assume are the >>>>>>>>> vertex >>>>>>>>> p-values) are not FWE corrected. Is it possible to get >>>>>>>>> FWE-corrected >>>>>>>>> vertex p-values? Or are only clusterwise corrections >>>>>>>>> available? >>>>>>>> There should be something like cache.th13.abs.sig.voxel.mgh >>>>>>>> which is >>>>>>>> corrected on a voxelwise basis (the th13 is just part of the >>>>>>>> name >>>>>>>> but it >>>>>>>> should be the same regardless of the threshold you choose) >>>>>>>> doug >>>>>>> >>>>>>> Excellent! Thanks! :) >>>>>>> >>>>>>>>> >>>>>>>>> Thanks again for your patience! >>>>>>>>> >>>>>>>>> Joe >>>>>>>>> >>>>>>>>> On May 30, 2013, at 4:37 PM, Joseph Dien <jdien07@mac.com >>>>>>>>> mailto:jdien07@mac.com >>>>>>>>> mailto:jdien07@mac.com >>>>>>>>> mailto:jdien07@mac.com mailto:jdien07@mac.com >>>>>>>>> mailto:jdien07@mac.com >>>>>>>>> mailto:jdien07@mac.com >>>>>>>>> mailto:jdien07@mac.com> wrote: >>>>>>>>> >>>>>>>>>> Just to make sure I'm doing this right, I'm going to >>>>>>>>>> summarize what >>>>>>>>>> I've taken away from your answers and to ask some new >>>>>>>>>> questions. In >>>>>>>>>> order to present the results, I need two things: >>>>>>>>>> >>>>>>>>>> 1) A set of histograms (with error bars) for each cluster >>>>>>>>>> figure to >>>>>>>>>> show the % signal change for each of the four contrasts of >>>>>>>>>> interest. >>>>>>>>>> The cache.th20.pos.y.ocn.dat file only gives it for the >>>>>>>>>> condition >>>>>>>>>> where the cluster was significant so I can't use that. >>>>>>>>>> So I could use mri_label2vol to convert >>>>>>>>>> cache.th20.neg.sig.ocn.annot >>>>>>>>>> from the group level analysis to generate a mask for each >>>>>>>>>> cluster of >>>>>>>>>> interest. >>>>>>>>>> Then I could extract the value of the voxels from each >>>>>>>>>> subject's cespct file for each contrast, average them >>>>>>>>>> across the >>>>>>>>>> cluster ROI, then average them across each subject, to >>>>>>>>>> generate the >>>>>>>>>> histogram? >>>>>>>>>> This would suffice to give me the %age signal change? >>>>>>>>>> I would be doing these computations in Matlab using MRIread. >>>>>>>>>> >>>>>>>>>> 2) A results table with the headings: >>>>>>>>>> >>>>>>>>>> Cluster p (FWE corrected) >>>>>>>>>> Cluster size >>>>>>>>>> Peak Voxel p (FWE corrected) >>>>>>>>>> Peak Voxel T >>>>>>>>>> Peak Voxel Coords >>>>>>>>>> BA >>>>>>>>>> Anatomical Landmark >>>>>>>>>> >>>>>>>>>> I can get the first two from >>>>>>>>>> the cache.th20.pos/neg.sig.cluster.summary files from the >>>>>>>>>> group >>>>>>>>>> level >>>>>>>>>> analysis. >>>>>>>>>> I can get the peak voxel coordinates from the summary files >>>>>>>>>> as well. >>>>>>>>>> I can use this to get the peak voxel p from the group >>>>>>>>>> level sig.nii.gz file. Is this FWE corrected? If not, >>>>>>>>>> how can >>>>>>>>>> I get >>>>>>>>>> this information? >>>>>>>>>> I can use these coordinates to get the peak voxel T by >>>>>>>>>> getting the >>>>>>>>>> value from the group level F.nii.gz file and taking its >>>>>>>>>> square root. >>>>>>>>>> How can I get the sign of the T statistic? >>>>>>>>>> I can use the Lancaster transform to convert the MNI305 peak >>>>>>>>>> voxel >>>>>>>>>> coordinates into the Atlas coordinates to look up the >>>>>>>>>> putative >>>>>>>>>> BA and >>>>>>>>>> landmarks (unless there is a better way with Freesurfer? >>>>>>>>>> I'm seeing >>>>>>>>>> some references to some BA labels in the forum but it >>>>>>>>>> doesn't look >>>>>>>>>> like this is a complete set yet?). >>>>>>>>>> >>>>>>>>>> Sorry for all these questions! I got some nice results from >>>>>>>>>> FSFAST >>>>>>>>>> and would like to get them written up. >>>>>>>>>> >>>>>>>>>> Cheers! >>>>>>>>>> >>>>>>>>>> Joe >>>>>>>>>> >>>>>>>>>> >>>>>>>>>> >>>>>>>>>> >>>>>>>>>> On May 29, 2013, at 10:53 PM, Douglas Greve >>>>>>>>>> <greve@nmr.mgh.harvard.edu >>>>>>>>>> mailto:greve@nmr.mgh.harvard.edu >>>>>>>>>> mailto:greve@nmr.mgh.harvard.edu >>>>>>>>>> mailto:greve@nmr.mgh.harvard.edu >>>>>>>>>> mailto:greve@nmr.mgh.harvard.edu >>>>>>>>>> mailto:greve@nmr.mgh.harvard.edu >>>>>>>>>> mailto:greve@nmr.mgh.harvard.edu >>>>>>>>>> mailto:greve@nmr.mgh.harvard.edu> wrote: >>>>>>>>>> >>>>>>>>>>> >>>>>>>>>>> On 5/29/13 10:42 PM, Joseph Dien wrote: >>>>>>>>>>>> >>>>>>>>>>>> On May 29, 2013, at 11:40 AM, Douglas N Greve >>>>>>>>>>>> <greve@NMR.MGH.HARVARD.EDU >>>>>>>>>>>> mailto:greve@NMR.MGH.HARVARD.EDU >>>>>>>>>>>> mailto:greve@NMR.MGH.HARVARD.EDU >>>>>>>>>>>> mailto:greve@NMR.MGH.HARVARD.EDU >>>>>>>>>>>> mailto:greve@NMR.MGH.HARVARD.EDU >>>>>>>>>>>> mailto:greve@NMR.MGH.HARVARD.EDU >>>>>>>>>>>> mailto:greve@NMR.MGH.HARVARD.EDU >>>>>>>>>>>> mailto:greve@NMR.MGH.HARVARD.EDU> wrote: >>>>>>>>>>>> >>>>>>>>>>>>> Hi Joe, >>>>>>>>>>>>> >>>>>>>>>>>>> On 05/29/2013 01:00 AM, Joseph Dien wrote: >>>>>>>>>>>>>> I need to extract the beta weights from a cluster >>>>>>>>>>>>>> identified >>>>>>>>>>>>>> with >>>>>>>>>>>>>> FS-Fast in order to compute percentage signal change. >>>>>>>>>>>>>> >>>>>>>>>>>>>> 1) I see a file called beta.nii.gz that appears to have >>>>>>>>>>>>>> the beta >>>>>>>>>>>>>> weight information. It has a four dimensional structure >>>>>>>>>>>>>> and the >>>>>>>>>>>>>> fourth dimension appears to be the beta weights. Is >>>>>>>>>>>>>> there an >>>>>>>>>>>>>> index >>>>>>>>>>>>>> somewhere as to which beta weight is which? Or if >>>>>>>>>>>>>> not, how >>>>>>>>>>>>>> are they >>>>>>>>>>>>>> organized? >>>>>>>>>>>>> For the first level analysis, the first N beta weights >>>>>>>>>>>>> correspond >>>>>>>>>>>>> to the >>>>>>>>>>>>> N conditions in the paradigm file. The rest are nuisance >>>>>>>>>>>>> variables. >>>>>>>>>>>>>> >>>>>>>>>>>> >>>>>>>>>>>> Ah, very good! In order to compute the percent signal >>>>>>>>>>>> change >>>>>>>>>>>> statistic (I'm following the MarsBaR approach: >>>>>>>>>>>> http://marsbar.sourceforge.net/faq.html#how-is-the-percent-signal-change-cal...) >>>>>>>>>>>> >>>>>>>>>>>> >>>>>>>>>>>> >>>>>>>>>>>> >>>>>>>>>>>> >>>>>>>>>>>> I'm also going to need the beta weights for the >>>>>>>>>>>> session mean >>>>>>>>>>>> regressors. How are the nuisance regressors organized? >>>>>>>>>>> You can just use the meanfunc.nii.gz. Also, each >>>>>>>>>>> contrasts is >>>>>>>>>>> computed as the simple contrast (ces) and as a percent >>>>>>>>>>> of the >>>>>>>>>>> baseline at the voxel (cespct, cesvarpct). >>>>>>>>>>>> >>>>>>>>>>>>>> 2) In order to extract the cluster, it looks like I >>>>>>>>>>>>>> would >>>>>>>>>>>>>> use mri_label2vol to convert >>>>>>>>>>>>>> cache.th20.neg.sig.ocn.annot into a >>>>>>>>>>>>>> volume where the voxels are tagged with the number >>>>>>>>>>>>>> of the >>>>>>>>>>>>>> corresponding cluster. >>>>>>>>>>>>> Is that from a group analysis? >>>>>>>>>>>>>> >>>>>>>>>>>> >>>>>>>>>>>> Yes, that's right. >>>>>>>>>>>> >>>>>>>>>>>>>> I could then use that to generate masks to extract the >>>>>>>>>>>>>> information I >>>>>>>>>>>>>> need for each cluster from beta.nii.gz. >>>>>>>>>>>>> If this is from a group analysis, then there should >>>>>>>>>>>>> already be >>>>>>>>>>>>> a file >>>>>>>>>>>>> there (something.y.ocn.dat) that has a value for each >>>>>>>>>>>>> subject >>>>>>>>>>>>> in the >>>>>>>>>>>>> rows and a value for each cluster in the columns. >>>>>>>>>>>>>> >>>>>>>>>>>> >>>>>>>>>>>> I see it. Are these values already scaled as percent >>>>>>>>>>>> signal >>>>>>>>>>>> change? If so, that would be wonderful! :) >>>>>>>>>>> Only if you specified it when you ran isxconcat-sess. Note >>>>>>>>>>> that the >>>>>>>>>>> "non-scaled" values are actually scaled to percent of grand >>>>>>>>>>> mean >>>>>>>>>>> intensity. >>>>>>>>>>>> >>>>>>>>>>>>>> Is that correct? >>>>>>>>>>>>>> >>>>>>>>>>>>>> 3) The final information that I would need is the >>>>>>>>>>>>>> canonical hrf >>>>>>>>>>>>>> shape >>>>>>>>>>>>>> generated by FSFAST for a single event. I guess I could >>>>>>>>>>>>>> generate >>>>>>>>>>>>>> that >>>>>>>>>>>>>> by setting up a dummy analysis run with a single event >>>>>>>>>>>>>> of the >>>>>>>>>>>>>> desired >>>>>>>>>>>>>> duration and then look in the X variable in the >>>>>>>>>>>>>> resulting >>>>>>>>>>>>>> X.mat file? >>>>>>>>>>>>> try this >>>>>>>>>>>>> plot(X.runflac(1).flac.ev(2).tirf, >>>>>>>>>>>>> X.runflac(1).flac.ev(2).Xirf) >>>>>>>>>>>>>> >>>>>>>>>>>> >>>>>>>>>>>> Perfect! :) >>>>>>>>>>>> >>>>>>>>>>>>>> Sorry for all the questions! >>>>>>>>>>>>>> >>>>>>>>>>>>>> Joe >>>>>>>>>>>>>> >>>>>>>>>>>>>> >>>>>>>>>>>>>> >>>>>>>>>>>>>> >>>>>> >>>>>> >>>>>> >>>>>> >>>>>> >>>>>> >>>>>> >>>>>> >>>>>> >>>>>> >>>>>> >>>>> >>>>> -- >>>>> Douglas N. Greve, Ph.D. >>>>> MGH-NMR Center >>>>> greve@nmr.mgh.harvard.edu mailto:greve@nmr.mgh.harvard.edu >>>>> mailto:greve@nmr.mgh.harvard.edu >>>>> mailto:greve@nmr.mgh.harvard.edu >>>>> mailto:greve@nmr.mgh.harvard.edu >>>>> mailto:greve@nmr.mgh.harvard.edu >>>>> Phone Number: 617-724-2358 >>>>> Fax: 617-726-7422 >>>>> >>>>> Bugs: surfer.nmr.mgh.harvard.edu/fswiki/BugReporting >>>>> FileDrop: https://gate.nmr.mgh.harvard.edu/filedrop2 >>>>> www.nmr.mgh.harvard.edu/facility/filedrop/index.html >>>>> http://www.nmr.mgh.harvard.edu/facility/filedrop/index.html >>>>> http://www.nmr.mgh.harvard.edu/facility/filedrop/index.html >>>>> http://www.nmr.mgh.harvard.edu/facility/filedrop/index.html >>>>> http://www.nmr.mgh.harvard.edu/facility/filedrop/index.html >>>>> Outgoing: >>>>> ftp://surfer.nmr.mgh.harvard.edu/transfer/outgoing/flat/greve/ >>>>> >>>>> _______________________________________________ >>>>> Freesurfer mailing list >>>>> Freesurfer@nmr.mgh.harvard.edu >>>>> mailto:Freesurfer@nmr.mgh.harvard.edu >>>>> https://mail.nmr.mgh.harvard.edu/mailman/listinfo/freesurfer >>>>> >>>>> >>>>> The information in this e-mail is intended only for the person to >>>>> whom it is >>>>> addressed. If you believe this e-mail was sent to you in >>>>> error and >>>>> the e-mail >>>>> contains patient information, please contact the Partners >>>>> Compliance >>>>> HelpLine at >>>>> http://www.partners.org/complianceline . If the e-mail was >>>>> sent to >>>>> you in error >>>>> but does not contain patient information, please contact the >>>>> sender >>>>> and properly >>>>> dispose of the e-mail. >>>>> >>>> >>>> >>>> -------------------------------------------------------------------------------- >>>> >>>> Joseph Dien, >>>> Senior Research Scientist >>>> University of Maryland >>>> >>>> E-mail: jdien07@mac.com mailto:jdien07@mac.com >>>> mailto:jdien07@mac.com >>>> mailto:jdien07@mac.com >>>> mailto:jdien07@mac.com mailto:jdien07@mac.com >>>> Phone: 202-297-8117 >>>> http://joedien.com// >>>> >>>> >>>> >>>> >>>> >>>> >>>> >>>> >>>> >>>> >>>> >>>> >>> >>> -- >>> Douglas N. Greve, Ph.D. >>> MGH-NMR Center >>> greve@nmr.mgh.harvard.edu mailto:greve@nmr.mgh.harvard.edu >>> mailto:greve@nmr.mgh.harvard.edu >>> mailto:greve@nmr.mgh.harvard.edu >>> mailto:greve@nmr.mgh.harvard.edu >>> Phone Number: 617-724-2358 >>> Fax: 617-726-7422 >>> >>> Bugs: surfer.nmr.mgh.harvard.edu/fswiki/BugReporting >>> FileDrop: https://gate.nmr.mgh.harvard.edu/filedrop2 >>> www.nmr.mgh.harvard.edu/facility/filedrop/index.html >>> http://www.nmr.mgh.harvard.edu/facility/filedrop/index.html >>> http://www.nmr.mgh.harvard.edu/facility/filedrop/index.html >>> http://www.nmr.mgh.harvard.edu/facility/filedrop/index.html >>> Outgoing: >>> ftp://surfer.nmr.mgh.harvard.edu/transfer/outgoing/flat/greve/ >>> >>> _______________________________________________ >>> Freesurfer mailing list >>> Freesurfer@nmr.mgh.harvard.edu >>> https://mail.nmr.mgh.harvard.edu/mailman/listinfo/freesurfer >> >> >> -------------------------------------------------------------------------------- >> >> Joseph Dien, >> Senior Research Scientist >> University of Maryland >> >> E-mail: jdien07@mac.com mailto:jdien07@mac.com >> mailto:jdien07@mac.com >> mailto:jdien07@mac.com >> mailto:jdien07@mac.com >> Phone: 202-297-8117 >> http://joedien.com// >> >> >> >> >> >> >> >> >> >> >> >> > > -- > Douglas N. Greve, Ph.D. > MGH-NMR Center > greve@nmr.mgh.harvard.edu mailto:greve@nmr.mgh.harvard.edu > mailto:greve@nmr.mgh.harvard.edu > mailto:greve@nmr.mgh.harvard.edu > Phone Number: 617-724-2358 > Fax: 617-726-7422 > > Bugs: surfer.nmr.mgh.harvard.edu/fswiki/BugReporting > FileDrop: https://gate.nmr.mgh.harvard.edu/filedrop2 > www.nmr.mgh.harvard.edu/facility/filedrop/index.html > http://www.nmr.mgh.harvard.edu/facility/filedrop/index.html > http://www.nmr.mgh.harvard.edu/facility/filedrop/index.html > Outgoing: > ftp://surfer.nmr.mgh.harvard.edu/transfer/outgoing/flat/greve/ >
Joseph Dien, Senior Research Scientist University of Maryland
E-mail: jdien07@mac.com mailto:jdien07@mac.com mailto:jdien07@mac.com mailto:jdien07@mac.com Phone: 202-297-8117 http://joedien.com//
-- Douglas N. Greve, Ph.D. MGH-NMR Center greve@nmr.mgh.harvard.edu mailto:greve@nmr.mgh.harvard.edu mailto:greve@nmr.mgh.harvard.edu Phone Number: 617-724-2358 Fax: 617-726-7422
Bugs: surfer.nmr.mgh.harvard.edu/fswiki/BugReporting FileDrop: https://gate.nmr.mgh.harvard.edu/filedrop2 www.nmr.mgh.harvard.edu/facility/filedrop/index.html http://www.nmr.mgh.harvard.edu/facility/filedrop/index.html Outgoing: ftp://surfer.nmr.mgh.harvard.edu/transfer/outgoing/flat/greve/
Freesurfer mailing list Freesurfer@nmr.mgh.harvard.edu https://mail.nmr.mgh.harvard.edu/mailman/listinfo/freesurfer
Joseph Dien, Senior Research Scientist University of Maryland
E-mail: jdien07@mac.com mailto:jdien07@mac.com mailto:jdien07@mac.com Phone: 202-297-8117 http://joedien.com//
-- Douglas N. Greve, Ph.D. MGH-NMR Center greve@nmr.mgh.harvard.edu mailto:greve@nmr.mgh.harvard.edu Phone Number: 617-724-2358 Fax: 617-726-7422
Bugs: surfer.nmr.mgh.harvard.edu/fswiki/BugReporting FileDrop: https://gate.nmr.mgh.harvard.edu/filedrop2 www.nmr.mgh.harvard.edu/facility/filedrop/index.html Outgoing: ftp://surfer.nmr.mgh.harvard.edu/transfer/outgoing/flat/greve/
Freesurfer mailing list Freesurfer@nmr.mgh.harvard.edu https://mail.nmr.mgh.harvard.edu/mailman/listinfo/freesurfer
Joseph Dien, Senior Research Scientist University of Maryland
E-mail: jdien07@mac.com mailto:jdien07@mac.com Phone: 202-297-8117 http://joedien.com//
-- Douglas N. Greve, Ph.D. MGH-NMR Center greve@nmr.mgh.harvard.edu Phone Number: 617-724-2358 Fax: 617-726-7422
Bugs: surfer.nmr.mgh.harvard.edu/fswiki/BugReporting FileDrop: https://gate.nmr.mgh.harvard.edu/filedrop2 www.nmr.mgh.harvard.edu/facility/filedrop/index.html Outgoing: ftp://surfer.nmr.mgh.harvard.edu/transfer/outgoing/flat/greve/
Freesurfer mailing list Freesurfer@nmr.mgh.harvard.edu https://mail.nmr.mgh.harvard.edu/mailman/listinfo/freesurfer
--------------------------------------------------------------------------------
Joseph Dien, Senior Research Scientist University of Maryland
E-mail: jdien07@mac.com Phone: 202-297-8117 http://joedien.com//
Oh, right, the nuisance regressors are given a separate regressor for each run. I had forgotten!
On 07/17/2013 04:55 PM, Joseph Dien wrote:
On Jul 17, 2013, at 4:50 PM, Douglas N Greve <greve@nmr.mgh.harvard.edu mailto:greve@nmr.mgh.harvard.edu> wrote:
On 07/17/2013 04:48 PM, Joseph Dien wrote:
The single nuisance regressor models the difference between the merged runs. So if the first run had a mean of 90 and the second run had a mean of 110 then the merged run mean would be 100. The nuisance regressor has 1s for the volumes of the first run and -1s for the volumes of the second run so it ends up with a beta value of 10, thus accounting for the difference between these two sets of volumes. I think it does make sense.
Do you do this in a single regressor? So you would have a +1 -1 pattern repeated 4 times? I think to make it work, you would need 4 regressors. In any event, FSFAST will do the right thing, so maybe it is not important.
Looking at the X.X file, it did create four nuisance regressors. I'm really impressed with how well FSFAST handles all this! :)
In any case, while it was necessary to do so for my original SPM analyses since it uses a separate covariates for each run, after working through the FSFAST procedures with your help I see that is not the case for FSFAST (a single regressor models a given condition in all the runs). I'll try doing as you suggest to see what difference it makes.
It is indeed cognitive areas and the manipulations are subtle social cognition manipulations so perhaps not surprising after all.
I'll send you the paradigm file separately.
Thanks for taking the time to look into this!
Joe
On Jul 17, 2013, at 4:38 PM, Douglas N Greve <greve@nmr.mgh.harvard.edu mailto:greve@nmr.mgh.harvard.edu mailto:greve@nmr.mgh.harvard.edu> wrote:
It is not necessary or beneficial to combine the runs in this way. FSFAST will do all this for you and keep account of all the runs and transitions. FSFAST will put in regressors to fit each of the run means. The single regressor you have is not the right way to hand this (at least I don't understand how it works). It could be that the low % signal change is related to the colinearity between the task waveform and the mean regressors. Can you set things up in the way that FSFAST expects them and don't use any nuisance regressors?
Also, in what area are you looking at the percent change? .02% sounds very small, but may be if it is in some cognitive area, maybe it is ok. If it is in visual cortex, then it looks way too low.
Also, can you send the paradigm file?
doug
On 07/17/2013 04:27 PM, Joseph Dien wrote:
It's a little complicated. Basically there were eight runs, comprising four conditions (me, we, you1, you2) each with two adjoining runs. For the analysis, I merged each of the pairs into a single run and added a nuisance regressor to account for the difference in run means. There were a total of four different kinds of boxcars (AR, CS, EM, MP). So 4x4=16 conditions. There was also a covariate of non-interest to mark the switch point for each boxcar, one for each run, so 20 total.
The 7 nuisance regressors are six movement covariates plus one to account for merging eight runs into four (it consists of 1 for the first half and -1 for the second, so the difference in the run means). I'm using the movement covariates from a prior SPM run since ARTdetect (for detecting bad volumes) isn't set up for AFNI style data. From all published accounts the different movement detection routines yield similar enough results that it shouldn't be a problem (consistent with what I found when I compared them for this dataset).
You're thinking that collinearity could have reduced the effect sizes? When I correlate the X.X regressor matrix, the 20 predictors don't correlate by more than about .2 at worst. I do see greater correlations with some of the nuisance regressors (as high as the .4 range). Are my betas unusually small for FSFAST analyses? They did come up clusterwise significant at least. Or should I not worry? I'm not sure what to expect from FSFAST analyses.
Thanks!
Joe
On Jul 17, 2013, at 3:58 PM, Douglas N Greve <greve@nmr.mgh.harvard.edu mailto:greve@nmr.mgh.harvard.edu mailto:greve@nmr.mgh.harvard.edu mailto:greve@nmr.mgh.harvard.edu> wrote:
why do you have 20 conditions? And what are the 7 nuisance regressors?
On 07/17/2013 03:54 PM, Joseph Dien wrote: > It's a boxcar design so 20.265. > > mkanalysis-sess -fsd bold -analysis CPA.sm05.lh -surface > fsaverage lh > -fwhm 5 -event-related-paradigm CPA1.par -nconditions 20 -spmhrf > 0 -TR > 2 -refeventdur 20.265 -polyfit 2 -per-run -force -nuisreg > nuisreg2.dat > 7 -tpexclude tpexclude.dat > > On Jul 17, 2013, at 3:50 PM, Douglas N Greve s. > <greve@nmr.mgh.harvard.edu mailto:greve@nmr.mgh.harvard.edu > mailto:greve@nmr.mgh.harvard.edu > mailto:greve@nmr.mgh.harvard.edu > mailto:greve@nmr.mgh.harvard.edu> wrote: > >> when you ran mkanalysis-sess, what did you set --refeventdur to? >> On 07/17/2013 02:50 PM, Joseph Dien wrote: >>> then I get on the order of .02% difference between the contrasted >>> conditions. >>> The run mean values are in my expected ballpark of about 100 >>> or so. >>> The condition betas are just very very small. >>> Or perhaps this is typical of FSFAST analyses? >>> >>> On Jul 17, 2013, at 2:00 PM, Douglas N Greve >>> <greve@nmr.mgh.harvard.edu mailto:greve@nmr.mgh.harvard.edu >>> mailto:greve@nmr.mgh.harvard.edu >>> mailto:greve@nmr.mgh.harvard.edu >>> mailto:greve@nmr.mgh.harvard.edu >>> mailto:greve@nmr.mgh.harvard.edu> wrote: >>> >>>> >>>> The beta's have already been scaled. What do you get if you just >>>> beta/runmean ? >>>> >>>> >>>> >>>> On 07/17/2013 01:45 PM, Joseph Dien wrote: >>>>> I implemented the ROI percent signal change formula >>>>> following the >>>>> MarsBaR FAQ (http://marsbar.sourceforge.net/faq.html) but the >>>>> values >>>>> I'm getting seem too small (on the order of .0002%). >>>>> Basically the >>>>> formula is the (beta * peak absolute value of the canonical HRF >>>>> regressor * 100)/(run mean). No derivatives in this case as >>>>> it is a >>>>> boxcar design. >>>>> >>>>> I took the mean across all the runs since FSFAST uses the same >>>>> regressor across the entire experiment (unlike SPM). >>>>> I used the X.runflac(1).flac.ev(m).Xirf values for the >>>>> canonical HRF >>>>> as you suggested (where m equals the condition+1). >>>>> >>>>> Is it possible that I'm missing something in the scaling here? >>>>> Especially with a boxcar design, the signal change should be >>>>> much >>>>> larger than this for a significant cluster, I think. For >>>>> example, the >>>>> peak HRF value for one of the conditions is 0.0092. If the >>>>> betas are >>>>> already scaled according to the peak value, then it would come >>>>> out as >>>>> .02%, which is more reasonable, although still too small. >>>>> >>>>> Thanks for your help with this! >>>>> >>>>> Joe >>>>> >>>>> >>>>> >>>>> On May 31, 2013, at 5:02 PM, Douglas N Greve >>>>> <greve@NMR.MGH.HARVARD.EDU >>>>> mailto:greve@NMR.MGH.HARVARD.EDU >>>>> mailto:greve@NMR.MGH.HARVARD.EDU >>>>> mailto:greve@NMR.MGH.HARVARD.EDU >>>>> mailto:greve@NMR.MGH.HARVARD.EDU >>>>> mailto:greve@NMR.MGH.HARVARD.EDU >>>>> mailto:greve@NMR.MGH.HARVARD.EDU> wrote: >>>>> >>>>>> >>>>>> Oh, right, it is probably not there for subcortical. I >>>>>> don't know >>>>>> what I >>>>>> would have to do to write it out. It won't be something that >>>>>> happens >>>>>> before I get back from HBM. Can you remind me after HBM? >>>>>> doug >>>>>> >>>>>> On 05/31/2013 04:44 PM, Joseph Dien wrote: >>>>>>> It looks like the corrected vertex p-values >>>>>>> (ex: cache.th13.abs.sig.voxel.nii.gz) are only available >>>>>>> for the >>>>>>> surface-based lh and rh spaces. For the subcortical >>>>>>> volume-based >>>>>>> analysis I don't see the corresponding corrected voxel >>>>>>> p-values >>>>>>> being >>>>>>> available? >>>>>>> >>>>>>> On May 31, 2013, at 2:46 PM, Joseph Dien <jdien07@mac.com >>>>>>> mailto:jdien07@mac.com >>>>>>> mailto:jdien07@mac.com >>>>>>> mailto:jdien07@mac.com >>>>>>> mailto:jdien07@mac.com mailto:jdien07@mac.com >>>>>>> mailto:jdien07@mac.com >>>>>>> mailto:jdien07@mac.com> wrote: >>>>>>> >>>>>>>> >>>>>>>> On May 31, 2013, at 12:11 PM, Douglas N Greve >>>>>>>> <greve@nmr.mgh.harvard.edu >>>>>>>> mailto:greve@nmr.mgh.harvard.edu >>>>>>>> mailto:greve@nmr.mgh.harvard.edu >>>>>>>> mailto:greve@nmr.mgh.harvard.edu >>>>>>>> mailto:greve@nmr.mgh.harvard.edu >>>>>>>> mailto:greve@nmr.mgh.harvard.edu >>>>>>>> mailto:greve@nmr.mgh.harvard.edu >>>>>>>> mailto:greve@nmr.mgh.harvard.edu> wrote: >>>>>>>> >>>>>>>>> >>>>>>>>> On 05/31/2013 01:49 AM, Joseph Dien wrote: >>>>>>>>>> I was able to make more progress so I'm mostly good at this >>>>>>>>>> point but >>>>>>>>>> I have a remaining question: >>>>>>>>>> >>>>>>>>>> I assume the contents of sig.nii.gz (which I assume are the >>>>>>>>>> vertex >>>>>>>>>> p-values) are not FWE corrected. Is it possible to get >>>>>>>>>> FWE-corrected >>>>>>>>>> vertex p-values? Or are only clusterwise corrections >>>>>>>>>> available? >>>>>>>>> There should be something like cache.th13.abs.sig.voxel.mgh >>>>>>>>> which is >>>>>>>>> corrected on a voxelwise basis (the th13 is just part of the >>>>>>>>> name >>>>>>>>> but it >>>>>>>>> should be the same regardless of the threshold you choose) >>>>>>>>> doug >>>>>>>> >>>>>>>> Excellent! Thanks! :) >>>>>>>> >>>>>>>>>> >>>>>>>>>> Thanks again for your patience! >>>>>>>>>> >>>>>>>>>> Joe >>>>>>>>>> >>>>>>>>>> On May 30, 2013, at 4:37 PM, Joseph Dien >>>>>>>>>> <jdien07@mac.com mailto:jdien07@mac.com >>>>>>>>>> mailto:jdien07@mac.com >>>>>>>>>> mailto:jdien07@mac.com >>>>>>>>>> mailto:jdien07@mac.com mailto:jdien07@mac.com >>>>>>>>>> mailto:jdien07@mac.com >>>>>>>>>> mailto:jdien07@mac.com >>>>>>>>>> mailto:jdien07@mac.com> wrote: >>>>>>>>>> >>>>>>>>>>> Just to make sure I'm doing this right, I'm going to >>>>>>>>>>> summarize what >>>>>>>>>>> I've taken away from your answers and to ask some new >>>>>>>>>>> questions. In >>>>>>>>>>> order to present the results, I need two things: >>>>>>>>>>> >>>>>>>>>>> 1) A set of histograms (with error bars) for each cluster >>>>>>>>>>> figure to >>>>>>>>>>> show the % signal change for each of the four contrasts of >>>>>>>>>>> interest. >>>>>>>>>>> The cache.th20.pos.y.ocn.dat file only gives it for the >>>>>>>>>>> condition >>>>>>>>>>> where the cluster was significant so I can't use that. >>>>>>>>>>> So I could use mri_label2vol to convert >>>>>>>>>>> cache.th20.neg.sig.ocn.annot >>>>>>>>>>> from the group level analysis to generate a mask for each >>>>>>>>>>> cluster of >>>>>>>>>>> interest. >>>>>>>>>>> Then I could extract the value of the voxels from each >>>>>>>>>>> subject's cespct file for each contrast, average them >>>>>>>>>>> across the >>>>>>>>>>> cluster ROI, then average them across each subject, to >>>>>>>>>>> generate the >>>>>>>>>>> histogram? >>>>>>>>>>> This would suffice to give me the %age signal change? >>>>>>>>>>> I would be doing these computations in Matlab using >>>>>>>>>>> MRIread. >>>>>>>>>>> >>>>>>>>>>> 2) A results table with the headings: >>>>>>>>>>> >>>>>>>>>>> Cluster p (FWE corrected) >>>>>>>>>>> Cluster size >>>>>>>>>>> Peak Voxel p (FWE corrected) >>>>>>>>>>> Peak Voxel T >>>>>>>>>>> Peak Voxel Coords >>>>>>>>>>> BA >>>>>>>>>>> Anatomical Landmark >>>>>>>>>>> >>>>>>>>>>> I can get the first two from >>>>>>>>>>> the cache.th20.pos/neg.sig.cluster.summary files from the >>>>>>>>>>> group >>>>>>>>>>> level >>>>>>>>>>> analysis. >>>>>>>>>>> I can get the peak voxel coordinates from the summary >>>>>>>>>>> files >>>>>>>>>>> as well. >>>>>>>>>>> I can use this to get the peak voxel p from the group >>>>>>>>>>> level sig.nii.gz file. Is this FWE corrected? If not, >>>>>>>>>>> how can >>>>>>>>>>> I get >>>>>>>>>>> this information? >>>>>>>>>>> I can use these coordinates to get the peak voxel T by >>>>>>>>>>> getting the >>>>>>>>>>> value from the group level F.nii.gz file and taking its >>>>>>>>>>> square root. >>>>>>>>>>> How can I get the sign of the T statistic? >>>>>>>>>>> I can use the Lancaster transform to convert the >>>>>>>>>>> MNI305 peak >>>>>>>>>>> voxel >>>>>>>>>>> coordinates into the Atlas coordinates to look up the >>>>>>>>>>> putative >>>>>>>>>>> BA and >>>>>>>>>>> landmarks (unless there is a better way with Freesurfer? >>>>>>>>>>> I'm seeing >>>>>>>>>>> some references to some BA labels in the forum but it >>>>>>>>>>> doesn't look >>>>>>>>>>> like this is a complete set yet?). >>>>>>>>>>> >>>>>>>>>>> Sorry for all these questions! I got some nice >>>>>>>>>>> results from >>>>>>>>>>> FSFAST >>>>>>>>>>> and would like to get them written up. >>>>>>>>>>> >>>>>>>>>>> Cheers! >>>>>>>>>>> >>>>>>>>>>> Joe >>>>>>>>>>> >>>>>>>>>>> >>>>>>>>>>> >>>>>>>>>>> >>>>>>>>>>> On May 29, 2013, at 10:53 PM, Douglas Greve >>>>>>>>>>> <greve@nmr.mgh.harvard.edu >>>>>>>>>>> mailto:greve@nmr.mgh.harvard.edu >>>>>>>>>>> mailto:greve@nmr.mgh.harvard.edu >>>>>>>>>>> mailto:greve@nmr.mgh.harvard.edu >>>>>>>>>>> mailto:greve@nmr.mgh.harvard.edu >>>>>>>>>>> mailto:greve@nmr.mgh.harvard.edu >>>>>>>>>>> mailto:greve@nmr.mgh.harvard.edu >>>>>>>>>>> mailto:greve@nmr.mgh.harvard.edu >>>>>>>>>>> mailto:greve@nmr.mgh.harvard.edu> wrote: >>>>>>>>>>> >>>>>>>>>>>> >>>>>>>>>>>> On 5/29/13 10:42 PM, Joseph Dien wrote: >>>>>>>>>>>>> >>>>>>>>>>>>> On May 29, 2013, at 11:40 AM, Douglas N Greve >>>>>>>>>>>>> <greve@NMR.MGH.HARVARD.EDU >>>>>>>>>>>>> mailto:greve@NMR.MGH.HARVARD.EDU >>>>>>>>>>>>> mailto:greve@NMR.MGH.HARVARD.EDU >>>>>>>>>>>>> mailto:greve@NMR.MGH.HARVARD.EDU >>>>>>>>>>>>> mailto:greve@NMR.MGH.HARVARD.EDU >>>>>>>>>>>>> mailto:greve@NMR.MGH.HARVARD.EDU >>>>>>>>>>>>> mailto:greve@NMR.MGH.HARVARD.EDU >>>>>>>>>>>>> mailto:greve@NMR.MGH.HARVARD.EDU >>>>>>>>>>>>> mailto:greve@NMR.MGH.HARVARD.EDU> wrote: >>>>>>>>>>>>> >>>>>>>>>>>>>> Hi Joe, >>>>>>>>>>>>>> >>>>>>>>>>>>>> On 05/29/2013 01:00 AM, Joseph Dien wrote: >>>>>>>>>>>>>>> I need to extract the beta weights from a cluster >>>>>>>>>>>>>>> identified >>>>>>>>>>>>>>> with >>>>>>>>>>>>>>> FS-Fast in order to compute percentage signal change. >>>>>>>>>>>>>>> >>>>>>>>>>>>>>> 1) I see a file called beta.nii.gz that appears to >>>>>>>>>>>>>>> have >>>>>>>>>>>>>>> the beta >>>>>>>>>>>>>>> weight information. It has a four dimensional >>>>>>>>>>>>>>> structure >>>>>>>>>>>>>>> and the >>>>>>>>>>>>>>> fourth dimension appears to be the beta weights. Is >>>>>>>>>>>>>>> there an >>>>>>>>>>>>>>> index >>>>>>>>>>>>>>> somewhere as to which beta weight is which? Or if >>>>>>>>>>>>>>> not, how >>>>>>>>>>>>>>> are they >>>>>>>>>>>>>>> organized? >>>>>>>>>>>>>> For the first level analysis, the first N beta weights >>>>>>>>>>>>>> correspond >>>>>>>>>>>>>> to the >>>>>>>>>>>>>> N conditions in the paradigm file. The rest are >>>>>>>>>>>>>> nuisance >>>>>>>>>>>>>> variables. >>>>>>>>>>>>>>> >>>>>>>>>>>>> >>>>>>>>>>>>> Ah, very good! In order to compute the percent signal >>>>>>>>>>>>> change >>>>>>>>>>>>> statistic (I'm following the MarsBaR approach: >>>>>>>>>>>>> http://marsbar.sourceforge.net/faq.html#how-is-the-percent-signal-change-cal...) >>>>>>>>>>>>> >>>>>>>>>>>>> >>>>>>>>>>>>> >>>>>>>>>>>>> >>>>>>>>>>>>> >>>>>>>>>>>>> >>>>>>>>>>>>> I'm also going to need the beta weights for the >>>>>>>>>>>>> session mean >>>>>>>>>>>>> regressors. How are the nuisance regressors organized? >>>>>>>>>>>> You can just use the meanfunc.nii.gz. Also, each >>>>>>>>>>>> contrasts is >>>>>>>>>>>> computed as the simple contrast (ces) and as a percent >>>>>>>>>>>> of the >>>>>>>>>>>> baseline at the voxel (cespct, cesvarpct). >>>>>>>>>>>>> >>>>>>>>>>>>>>> 2) In order to extract the cluster, it looks like I >>>>>>>>>>>>>>> would >>>>>>>>>>>>>>> use mri_label2vol to convert >>>>>>>>>>>>>>> cache.th20.neg.sig.ocn.annot into a >>>>>>>>>>>>>>> volume where the voxels are tagged with the number >>>>>>>>>>>>>>> of the >>>>>>>>>>>>>>> corresponding cluster. >>>>>>>>>>>>>> Is that from a group analysis? >>>>>>>>>>>>>>> >>>>>>>>>>>>> >>>>>>>>>>>>> Yes, that's right. >>>>>>>>>>>>> >>>>>>>>>>>>>>> I could then use that to generate masks to extract the >>>>>>>>>>>>>>> information I >>>>>>>>>>>>>>> need for each cluster from beta.nii.gz. >>>>>>>>>>>>>> If this is from a group analysis, then there should >>>>>>>>>>>>>> already be >>>>>>>>>>>>>> a file >>>>>>>>>>>>>> there (something.y.ocn.dat) that has a value for each >>>>>>>>>>>>>> subject >>>>>>>>>>>>>> in the >>>>>>>>>>>>>> rows and a value for each cluster in the columns. >>>>>>>>>>>>>>> >>>>>>>>>>>>> >>>>>>>>>>>>> I see it. Are these values already scaled as percent >>>>>>>>>>>>> signal >>>>>>>>>>>>> change? If so, that would be wonderful! :) >>>>>>>>>>>> Only if you specified it when you ran isxconcat-sess. >>>>>>>>>>>> Note >>>>>>>>>>>> that the >>>>>>>>>>>> "non-scaled" values are actually scaled to percent of >>>>>>>>>>>> grand >>>>>>>>>>>> mean >>>>>>>>>>>> intensity. >>>>>>>>>>>>> >>>>>>>>>>>>>>> Is that correct? >>>>>>>>>>>>>>> >>>>>>>>>>>>>>> 3) The final information that I would need is the >>>>>>>>>>>>>>> canonical hrf >>>>>>>>>>>>>>> shape >>>>>>>>>>>>>>> generated by FSFAST for a single event. I guess I >>>>>>>>>>>>>>> could >>>>>>>>>>>>>>> generate >>>>>>>>>>>>>>> that >>>>>>>>>>>>>>> by setting up a dummy analysis run with a single event >>>>>>>>>>>>>>> of the >>>>>>>>>>>>>>> desired >>>>>>>>>>>>>>> duration and then look in the X variable in the >>>>>>>>>>>>>>> resulting >>>>>>>>>>>>>>> X.mat file? >>>>>>>>>>>>>> try this >>>>>>>>>>>>>> plot(X.runflac(1).flac.ev(2).tirf, >>>>>>>>>>>>>> X.runflac(1).flac.ev(2).Xirf) >>>>>>>>>>>>>>> >>>>>>>>>>>>> >>>>>>>>>>>>> Perfect! :) >>>>>>>>>>>>> >>>>>>>>>>>>>>> Sorry for all the questions! >>>>>>>>>>>>>>> >>>>>>>>>>>>>>> Joe >>>>>>>>>>>>>>> >>>>>>>>>>>>>>> >>>>>>>>>>>>>>> >>>>>>>>>>>>>>> >>>>>>> >>>>>>> >>>>>>> >>>>>>> >>>>>>> >>>>>>> >>>>>>> >>>>>>> >>>>>>> >>>>>>> >>>>>>> >>>>>> >>>>>> -- >>>>>> Douglas N. Greve, Ph.D. >>>>>> MGH-NMR Center >>>>>> greve@nmr.mgh.harvard.edu >>>>>> mailto:greve@nmr.mgh.harvard.edu >>>>>> mailto:greve@nmr.mgh.harvard.edu >>>>>> mailto:greve@nmr.mgh.harvard.edu >>>>>> mailto:greve@nmr.mgh.harvard.edu >>>>>> mailto:greve@nmr.mgh.harvard.edu >>>>>> mailto:greve@nmr.mgh.harvard.edu >>>>>> Phone Number: 617-724-2358 >>>>>> Fax: 617-726-7422 >>>>>> >>>>>> Bugs: surfer.nmr.mgh.harvard.edu/fswiki/BugReporting >>>>>> FileDrop: https://gate.nmr.mgh.harvard.edu/filedrop2 >>>>>> www.nmr.mgh.harvard.edu/facility/filedrop/index.html >>>>>> http://www.nmr.mgh.harvard.edu/facility/filedrop/index.html >>>>>> http://www.nmr.mgh.harvard.edu/facility/filedrop/index.html >>>>>> http://www.nmr.mgh.harvard.edu/facility/filedrop/index.html >>>>>> http://www.nmr.mgh.harvard.edu/facility/filedrop/index.html >>>>>> http://www.nmr.mgh.harvard.edu/facility/filedrop/index.html >>>>>> Outgoing: >>>>>> ftp://surfer.nmr.mgh.harvard.edu/transfer/outgoing/flat/greve/ >>>>>> >>>>>> _______________________________________________ >>>>>> Freesurfer mailing list >>>>>> Freesurfer@nmr.mgh.harvard.edu >>>>>> mailto:Freesurfer@nmr.mgh.harvard.edu >>>>>> https://mail.nmr.mgh.harvard.edu/mailman/listinfo/freesurfer >>>>>> >>>>>> >>>>>> The information in this e-mail is intended only for the >>>>>> person to >>>>>> whom it is >>>>>> addressed. If you believe this e-mail was sent to you in >>>>>> error and >>>>>> the e-mail >>>>>> contains patient information, please contact the Partners >>>>>> Compliance >>>>>> HelpLine at >>>>>> http://www.partners.org/complianceline . If the e-mail was >>>>>> sent to >>>>>> you in error >>>>>> but does not contain patient information, please contact the >>>>>> sender >>>>>> and properly >>>>>> dispose of the e-mail. >>>>>> >>>>> >>>>> >>>>> -------------------------------------------------------------------------------- >>>>> >>>>> Joseph Dien, >>>>> Senior Research Scientist >>>>> University of Maryland >>>>> >>>>> E-mail: jdien07@mac.com mailto:jdien07@mac.com >>>>> mailto:jdien07@mac.com >>>>> mailto:jdien07@mac.com >>>>> mailto:jdien07@mac.com >>>>> mailto:jdien07@mac.com mailto:jdien07@mac.com >>>>> Phone: 202-297-8117 >>>>> http://joedien.com// >>>>> >>>>> >>>>> >>>>> >>>>> >>>>> >>>>> >>>>> >>>>> >>>>> >>>>> >>>>> >>>> >>>> -- >>>> Douglas N. Greve, Ph.D. >>>> MGH-NMR Center >>>> greve@nmr.mgh.harvard.edu mailto:greve@nmr.mgh.harvard.edu >>>> mailto:greve@nmr.mgh.harvard.edu >>>> mailto:greve@nmr.mgh.harvard.edu >>>> mailto:greve@nmr.mgh.harvard.edu >>>> mailto:greve@nmr.mgh.harvard.edu >>>> Phone Number: 617-724-2358 >>>> Fax: 617-726-7422 >>>> >>>> Bugs: surfer.nmr.mgh.harvard.edu/fswiki/BugReporting >>>> FileDrop: https://gate.nmr.mgh.harvard.edu/filedrop2 >>>> www.nmr.mgh.harvard.edu/facility/filedrop/index.html >>>> http://www.nmr.mgh.harvard.edu/facility/filedrop/index.html >>>> http://www.nmr.mgh.harvard.edu/facility/filedrop/index.html >>>> http://www.nmr.mgh.harvard.edu/facility/filedrop/index.html >>>> http://www.nmr.mgh.harvard.edu/facility/filedrop/index.html >>>> Outgoing: >>>> ftp://surfer.nmr.mgh.harvard.edu/transfer/outgoing/flat/greve/ >>>> >>>> _______________________________________________ >>>> Freesurfer mailing list >>>> Freesurfer@nmr.mgh.harvard.edu >>>> https://mail.nmr.mgh.harvard.edu/mailman/listinfo/freesurfer >>> >>> >>> -------------------------------------------------------------------------------- >>> >>> Joseph Dien, >>> Senior Research Scientist >>> University of Maryland >>> >>> E-mail: jdien07@mac.com mailto:jdien07@mac.com >>> mailto:jdien07@mac.com >>> mailto:jdien07@mac.com >>> mailto:jdien07@mac.com >>> mailto:jdien07@mac.com >>> Phone: 202-297-8117 >>> http://joedien.com// >>> >>> >>> >>> >>> >>> >>> >>> >>> >>> >>> >>> >> >> -- >> Douglas N. Greve, Ph.D. >> MGH-NMR Center >> greve@nmr.mgh.harvard.edu mailto:greve@nmr.mgh.harvard.edu >> mailto:greve@nmr.mgh.harvard.edu >> mailto:greve@nmr.mgh.harvard.edu >> mailto:greve@nmr.mgh.harvard.edu >> Phone Number: 617-724-2358 >> Fax: 617-726-7422 >> >> Bugs: surfer.nmr.mgh.harvard.edu/fswiki/BugReporting >> FileDrop: https://gate.nmr.mgh.harvard.edu/filedrop2 >> www.nmr.mgh.harvard.edu/facility/filedrop/index.html >> http://www.nmr.mgh.harvard.edu/facility/filedrop/index.html >> http://www.nmr.mgh.harvard.edu/facility/filedrop/index.html >> http://www.nmr.mgh.harvard.edu/facility/filedrop/index.html >> Outgoing: >> ftp://surfer.nmr.mgh.harvard.edu/transfer/outgoing/flat/greve/ >> > > > -------------------------------------------------------------------------------- > > Joseph Dien, > Senior Research Scientist > University of Maryland > > E-mail: jdien07@mac.com mailto:jdien07@mac.com > mailto:jdien07@mac.com > mailto:jdien07@mac.com > mailto:jdien07@mac.com > Phone: 202-297-8117 > http://joedien.com// > > > > > > > > > > > >
-- Douglas N. Greve, Ph.D. MGH-NMR Center greve@nmr.mgh.harvard.edu mailto:greve@nmr.mgh.harvard.edu mailto:greve@nmr.mgh.harvard.edu mailto:greve@nmr.mgh.harvard.edu Phone Number: 617-724-2358 Fax: 617-726-7422
Bugs: surfer.nmr.mgh.harvard.edu/fswiki/BugReporting FileDrop: https://gate.nmr.mgh.harvard.edu/filedrop2 www.nmr.mgh.harvard.edu/facility/filedrop/index.html http://www.nmr.mgh.harvard.edu/facility/filedrop/index.html http://www.nmr.mgh.harvard.edu/facility/filedrop/index.html Outgoing: ftp://surfer.nmr.mgh.harvard.edu/transfer/outgoing/flat/greve/
Freesurfer mailing list Freesurfer@nmr.mgh.harvard.edu https://mail.nmr.mgh.harvard.edu/mailman/listinfo/freesurfer
Joseph Dien, Senior Research Scientist University of Maryland
E-mail: jdien07@mac.com mailto:jdien07@mac.com mailto:jdien07@mac.com mailto:jdien07@mac.com Phone: 202-297-8117 http://joedien.com//
-- Douglas N. Greve, Ph.D. MGH-NMR Center greve@nmr.mgh.harvard.edu mailto:greve@nmr.mgh.harvard.edu mailto:greve@nmr.mgh.harvard.edu Phone Number: 617-724-2358 Fax: 617-726-7422
Bugs: surfer.nmr.mgh.harvard.edu/fswiki/BugReporting FileDrop: https://gate.nmr.mgh.harvard.edu/filedrop2 www.nmr.mgh.harvard.edu/facility/filedrop/index.html http://www.nmr.mgh.harvard.edu/facility/filedrop/index.html Outgoing: ftp://surfer.nmr.mgh.harvard.edu/transfer/outgoing/flat/greve/
Freesurfer mailing list Freesurfer@nmr.mgh.harvard.edu https://mail.nmr.mgh.harvard.edu/mailman/listinfo/freesurfer
Joseph Dien, Senior Research Scientist University of Maryland
E-mail: jdien07@mac.com mailto:jdien07@mac.com mailto:jdien07@mac.com Phone: 202-297-8117 http://joedien.com//
-- Douglas N. Greve, Ph.D. MGH-NMR Center greve@nmr.mgh.harvard.edu mailto:greve@nmr.mgh.harvard.edu Phone Number: 617-724-2358 Fax: 617-726-7422
Bugs: surfer.nmr.mgh.harvard.edu/fswiki/BugReporting FileDrop: https://gate.nmr.mgh.harvard.edu/filedrop2 www.nmr.mgh.harvard.edu/facility/filedrop/index.html Outgoing: ftp://surfer.nmr.mgh.harvard.edu/transfer/outgoing/flat/greve/
Freesurfer mailing list Freesurfer@nmr.mgh.harvard.edu https://mail.nmr.mgh.harvard.edu/mailman/listinfo/freesurfer
Joseph Dien, Senior Research Scientist University of Maryland
E-mail: jdien07@mac.com mailto:jdien07@mac.com Phone: 202-297-8117 http://joedien.com//
I'm getting some puzzling discrepancies when comparing the ocn and the cluster outputs. The summary file indicates there should be five significant clusters (see below). The cluster file only shows four of the clusters, although I'm guessing that the supramarginal one is not being displayed because it did not pass the three-space Bonferroni (so the cluster file only includes clusters that pass that additional correction)? What is really confusing me is that the ocn file does display the supramarginal cluster but does not show the rostral anterior cingulate cluster. How does this work? See attached images below.
This is with Freesurfer 5.20 on OS X 10.8.3.
Cheers!
Joe
tksurfer fsaverage lh inflated -aparc -overlay CPA.sm05.lh/CS-v-OTHERS/CS-v-OTHERS.wls/osgm/cache.th20.pos.sig.ocn.nii.gz tksurfer fsaverage lh inflated -aparc -overlay CPA.sm05.lh/CS-v-OTHERS/CS-v-OTHERS.wls/osgm/cache.th20.pos.sig.cluster.nii.gz
# Cluster Growing Summary (mri_surfcluster) # $Id: mri_surfcluster.c,v 1.51.2.3 2012/05/31 22:10:05 greve Exp $ # $Id: mrisurf.c,v 1.693.2.4 2012/11/07 22:38:00 nicks Exp $ # CreationTime 2013/05/26-22:53:59-GMT # cmdline mri_surfcluster --in CS-v-OTHERS.wls/osgm/sig.nii.gz --csd /Applications/freesurfer/average/mult-comp-cor/fsaverage/lh/cortex/fwhm12/pos/th20/mc-z.csd --mask CS-v-OTHERS.wls/mask.nii.gz --cwsig CS-v-OTHERS.wls/osgm/cache.th20.pos.sig.cluster.nii.gz --vwsig CS-v-OTHERS.wls/osgm/cache.th20.pos.sig.voxel.nii.gz --sum CS-v-OTHERS.wls/osgm/cache.th20.pos.sig.cluster.summary --ocn CS-v-OTHERS.wls/osgm/cache.th20.pos.sig.ocn.nii.gz --oannot CS-v-OTHERS.wls/osgm/cache.th20.pos.sig.ocn.annot --annot aparc --csdpdf CS-v-OTHERS.wls/osgm/cache.th20.pos.pdf.dat --cwpvalthresh .05 --o CS-v-OTHERS.wls/osgm/cache.th20.pos.sig.masked.nii.gz --no-fixmni --bonferroni 3 --surf white # cwd /Volumes/Data/CP1/fsfast/secondLevel/CPA.sm05.lh/CS-v-OTHERS # sysname Darwin # hostname megajoe.home # machine x86_64 # FixVertexAreaFlag 1 # FixSurfClusterArea 1 # # Input CS-v-OTHERS.wls/osgm/sig.nii.gz # Frame Number 0 # srcsubj fsaverage # hemi lh # surface white # annot aparc # SUBJECTS_DIR /Applications/freesurfer/subjects # SearchSpace_mm2 65416.6 # SearchSpace_vtx 148649 # Bonferroni 3 # Minimum Threshold 2 # Maximum Threshold infinity # Threshold Sign pos # AdjustThreshWhenOneTail 1 # CW PValue Threshold: 0.05 # Area Threshold 0 mm^2 # CSD thresh 2.000000 # CSD nreps 10000 # CSD simtype null-z # CSD contrast NA # CSD confint 90.000000 # Overall max 5.96965 at vertex 140670 # Overall min -3.06064 at vertex 162717 # NClusters 5 # Total Cortical Surface Area 65416.6 (mm^2) # FixMNI = 0 # # ClusterNo Max VtxMax Size(mm^2) MNIX MNIY MNIZ CWP CWPLow CWPHi NVtxs Annot 1 5.970 140670 2209.93 -5.9 40.9 -0.0 0.00030 0.00000 0.00060 4223 rostralanteriorcingulate 2 4.146 49359 1566.01 -4.0 -19.8 35.8 0.00030 0.00000 0.00060 3668 posteriorcingulate 3 3.860 111375 446.35 -44.6 -37.3 25.1 0.02558 0.02204 0.02911 1037 supramarginal 4 3.711 128614 652.01 -24.4 -26.8 -24.3 0.00150 0.00060 0.00240 1539 parahippocampal 5 3.647 25172 1334.99 -48.7 -50.3 17.3 0.00030 0.00000 0.00060 2700 inferiorparietal
On May 31, 2013, at 4:44 PM, Joseph Dien jdien07@mac.com wrote:
It looks like the corrected vertex p-values (ex: cache.th13.abs.sig.voxel.nii.gz) are only available for the surface-based lh and rh spaces. For the subcortical volume-based analysis I don't see the corresponding corrected voxel p-values being available?
On May 31, 2013, at 2:46 PM, Joseph Dien jdien07@mac.com wrote:
On May 31, 2013, at 12:11 PM, Douglas N Greve greve@nmr.mgh.harvard.edu wrote:
On 05/31/2013 01:49 AM, Joseph Dien wrote:
I was able to make more progress so I'm mostly good at this point but I have a remaining question:
I assume the contents of sig.nii.gz (which I assume are the vertex p-values) are not FWE corrected. Is it possible to get FWE-corrected vertex p-values? Or are only clusterwise corrections available?
There should be something like cache.th13.abs.sig.voxel.mgh which is corrected on a voxelwise basis (the th13 is just part of the name but it should be the same regardless of the threshold you choose) doug
Excellent! Thanks! :)
Thanks again for your patience!
Joe
On May 30, 2013, at 4:37 PM, Joseph Dien <jdien07@mac.com mailto:jdien07@mac.com> wrote:
Just to make sure I'm doing this right, I'm going to summarize what I've taken away from your answers and to ask some new questions. In order to present the results, I need two things:
- A set of histograms (with error bars) for each cluster figure to
show the % signal change for each of the four contrasts of interest. The cache.th20.pos.y.ocn.dat file only gives it for the condition where the cluster was significant so I can't use that. So I could use mri_label2vol to convert cache.th20.neg.sig.ocn.annot from the group level analysis to generate a mask for each cluster of interest. Then I could extract the value of the voxels from each subject's cespct file for each contrast, average them across the cluster ROI, then average them across each subject, to generate the histogram? This would suffice to give me the %age signal change? I would be doing these computations in Matlab using MRIread.
- A results table with the headings:
Cluster p (FWE corrected) Cluster size Peak Voxel p (FWE corrected) Peak Voxel T Peak Voxel Coords BA Anatomical Landmark
I can get the first two from the cache.th20.pos/neg.sig.cluster.summary files from the group level analysis. I can get the peak voxel coordinates from the summary files as well. I can use this to get the peak voxel p from the group level sig.nii.gz file. Is this FWE corrected? If not, how can I get this information? I can use these coordinates to get the peak voxel T by getting the value from the group level F.nii.gz file and taking its square root. How can I get the sign of the T statistic? I can use the Lancaster transform to convert the MNI305 peak voxel coordinates into the Atlas coordinates to look up the putative BA and landmarks (unless there is a better way with Freesurfer? I'm seeing some references to some BA labels in the forum but it doesn't look like this is a complete set yet?).
Sorry for all these questions! I got some nice results from FSFAST and would like to get them written up.
Cheers!
Joe
On May 29, 2013, at 10:53 PM, Douglas Greve <greve@nmr.mgh.harvard.edu mailto:greve@nmr.mgh.harvard.edu> wrote:
On 5/29/13 10:42 PM, Joseph Dien wrote: > > On May 29, 2013, at 11:40 AM, Douglas N Greve > <greve@NMR.MGH.HARVARD.EDU mailto:greve@NMR.MGH.HARVARD.EDU> wrote: > >> Hi Joe, >> >> On 05/29/2013 01:00 AM, Joseph Dien wrote: >>> I need to extract the beta weights from a cluster identified with >>> FS-Fast in order to compute percentage signal change. >>> >>> 1) I see a file called beta.nii.gz that appears to have the beta >>> weight information. It has a four dimensional structure and the >>> fourth dimension appears to be the beta weights. Is there an index >>> somewhere as to which beta weight is which? Or if not, how are they >>> organized? >> For the first level analysis, the first N beta weights correspond >> to the >> N conditions in the paradigm file. The rest are nuisance variables. >>> > > Ah, very good! In order to compute the percent signal change > statistic (I'm following the MarsBaR approach: > http://marsbar.sourceforge.net/faq.html#how-is-the-percent-signal-change-cal...) > I'm also going to need the beta weights for the session mean > regressors. How are the nuisance regressors organized? You can just use the meanfunc.nii.gz. Also, each contrasts is computed as the simple contrast (ces) and as a percent of the baseline at the voxel (cespct, cesvarpct). > >>> 2) In order to extract the cluster, it looks like I would >>> use mri_label2vol to convert cache.th20.neg.sig.ocn.annot into a >>> volume where the voxels are tagged with the number of the >>> corresponding cluster. >> Is that from a group analysis? >>> > > Yes, that's right. > >>> I could then use that to generate masks to extract the information I >>> need for each cluster from beta.nii.gz. >> If this is from a group analysis, then there should already be a file >> there (something.y.ocn.dat) that has a value for each subject in the >> rows and a value for each cluster in the columns. >>> > > I see it. Are these values already scaled as percent signal > change? If so, that would be wonderful! :) Only if you specified it when you ran isxconcat-sess. Note that the "non-scaled" values are actually scaled to percent of grand mean intensity. > >>> Is that correct? >>> >>> 3) The final information that I would need is the canonical hrf >>> shape >>> generated by FSFAST for a single event. I guess I could generate >>> that >>> by setting up a dummy analysis run with a single event of the >>> desired >>> duration and then look in the X variable in the resulting X.mat file? >> try this >> plot(X.runflac(1).flac.ev(2).tirf, X.runflac(1).flac.ev(2).Xirf) >>> > > Perfect! :) > >>> Sorry for all the questions! >>> >>> Joe >>> >>> >>> >>>
--------------------------------------------------------------------------------
Joseph Dien, Senior Research Scientist University of Maryland
E-mail: jdien07@mac.com Phone: 301-226-8848 Fax: 301-226-8811 http://joedien.com//
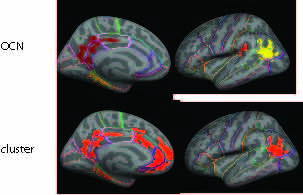
Ah never mind, I figured it out. tksurfer was automatically setting the range to go from 2-5 so cluster 1 was not getting displayed. So please convert this question to a user suggestion to automatically set the threshold setting to the full range when displaying ocn and cluster overlays (as the default threshold was also the reason the suparmarginal gyrus cluster was not being displayed).
Cheers!
Joe
On Jun 15, 2013, at 12:07 AM, Joseph Dien jdien07@mac.com wrote:
I'm getting some puzzling discrepancies when comparing the ocn and the cluster outputs. The summary file indicates there should be five significant clusters (see below). The cluster file only shows four of the clusters, although I'm guessing that the supramarginal one is not being displayed because it did not pass the three-space Bonferroni (so the cluster file only includes clusters that pass that additional correction)? What is really confusing me is that the ocn file does display the supramarginal cluster but does not show the rostral anterior cingulate cluster. How does this work? See attached images below.
This is with Freesurfer 5.20 on OS X 10.8.3.
Cheers!
Joe
tksurfer fsaverage lh inflated -aparc -overlay CPA.sm05.lh/CS-v-OTHERS/CS-v-OTHERS.wls/osgm/cache.th20.pos.sig.ocn.nii.gz tksurfer fsaverage lh inflated -aparc -overlay CPA.sm05.lh/CS-v-OTHERS/CS-v-OTHERS.wls/osgm/cache.th20.pos.sig.cluster.nii.gz
# Cluster Growing Summary (mri_surfcluster) # $Id: mri_surfcluster.c,v 1.51.2.3 2012/05/31 22:10:05 greve Exp $ # $Id: mrisurf.c,v 1.693.2.4 2012/11/07 22:38:00 nicks Exp $ # CreationTime 2013/05/26-22:53:59-GMT # cmdline mri_surfcluster --in CS-v-OTHERS.wls/osgm/sig.nii.gz --csd /Applications/freesurfer/average/mult-comp-cor/fsaverage/lh/cortex/fwhm12/pos/th20/mc-z.csd --mask CS-v-OTHERS.wls/mask.nii.gz --cwsig CS-v-OTHERS.wls/osgm/cache.th20.pos.sig.cluster.nii.gz --vwsig CS-v-OTHERS.wls/osgm/cache.th20.pos.sig.voxel.nii.gz --sum CS-v-OTHERS.wls/osgm/cache.th20.pos.sig.cluster.summary --ocn CS-v-OTHERS.wls/osgm/cache.th20.pos.sig.ocn.nii.gz --oannot CS-v-OTHERS.wls/osgm/cache.th20.pos.sig.ocn.annot --annot aparc --csdpdf CS-v-OTHERS.wls/osgm/cache.th20.pos.pdf.dat --cwpvalthresh .05 --o CS-v-OTHERS.wls/osgm/cache.th20.pos.sig.masked.nii.gz --no-fixmni --bonferroni 3 --surf white # cwd /Volumes/Data/CP1/fsfast/secondLevel/CPA.sm05.lh/CS-v-OTHERS # sysname Darwin # hostname megajoe.home # machine x86_64 # FixVertexAreaFlag 1 # FixSurfClusterArea 1 # # Input CS-v-OTHERS.wls/osgm/sig.nii.gz # Frame Number 0 # srcsubj fsaverage # hemi lh # surface white # annot aparc # SUBJECTS_DIR /Applications/freesurfer/subjects # SearchSpace_mm2 65416.6 # SearchSpace_vtx 148649 # Bonferroni 3 # Minimum Threshold 2 # Maximum Threshold infinity # Threshold Sign pos # AdjustThreshWhenOneTail 1 # CW PValue Threshold: 0.05 # Area Threshold 0 mm^2 # CSD thresh 2.000000 # CSD nreps 10000 # CSD simtype null-z # CSD contrast NA # CSD confint 90.000000 # Overall max 5.96965 at vertex 140670 # Overall min -3.06064 at vertex 162717 # NClusters 5 # Total Cortical Surface Area 65416.6 (mm^2) # FixMNI = 0 # # ClusterNo Max VtxMax Size(mm^2) MNIX MNIY MNIZ CWP CWPLow CWPHi NVtxs Annot 1 5.970 140670 2209.93 -5.9 40.9 -0.0 0.00030 0.00000 0.00060 4223 rostralanteriorcingulate 2 4.146 49359 1566.01 -4.0 -19.8 35.8 0.00030 0.00000 0.00060 3668 posteriorcingulate 3 3.860 111375 446.35 -44.6 -37.3 25.1 0.02558 0.02204 0.02911 1037 supramarginal 4 3.711 128614 652.01 -24.4 -26.8 -24.3 0.00150 0.00060 0.00240 1539 parahippocampal 5 3.647 25172 1334.99 -48.7 -50.3 17.3 0.00030 0.00000 0.00060 2700 inferiorparietal
<question5.jpg>
On May 31, 2013, at 4:44 PM, Joseph Dien jdien07@mac.com wrote:
It looks like the corrected vertex p-values (ex: cache.th13.abs.sig.voxel.nii.gz) are only available for the surface-based lh and rh spaces. For the subcortical volume-based analysis I don't see the corresponding corrected voxel p-values being available?
On May 31, 2013, at 2:46 PM, Joseph Dien jdien07@mac.com wrote:
On May 31, 2013, at 12:11 PM, Douglas N Greve greve@nmr.mgh.harvard.edu wrote:
On 05/31/2013 01:49 AM, Joseph Dien wrote:
I was able to make more progress so I'm mostly good at this point but I have a remaining question:
I assume the contents of sig.nii.gz (which I assume are the vertex p-values) are not FWE corrected. Is it possible to get FWE-corrected vertex p-values? Or are only clusterwise corrections available?
There should be something like cache.th13.abs.sig.voxel.mgh which is corrected on a voxelwise basis (the th13 is just part of the name but it should be the same regardless of the threshold you choose) doug
Excellent! Thanks! :)
Thanks again for your patience!
Joe
On May 30, 2013, at 4:37 PM, Joseph Dien <jdien07@mac.com mailto:jdien07@mac.com> wrote:
Just to make sure I'm doing this right, I'm going to summarize what I've taken away from your answers and to ask some new questions. In order to present the results, I need two things:
- A set of histograms (with error bars) for each cluster figure to
show the % signal change for each of the four contrasts of interest. The cache.th20.pos.y.ocn.dat file only gives it for the condition where the cluster was significant so I can't use that. So I could use mri_label2vol to convert cache.th20.neg.sig.ocn.annot from the group level analysis to generate a mask for each cluster of interest. Then I could extract the value of the voxels from each subject's cespct file for each contrast, average them across the cluster ROI, then average them across each subject, to generate the histogram? This would suffice to give me the %age signal change? I would be doing these computations in Matlab using MRIread.
- A results table with the headings:
Cluster p (FWE corrected) Cluster size Peak Voxel p (FWE corrected) Peak Voxel T Peak Voxel Coords BA Anatomical Landmark
I can get the first two from the cache.th20.pos/neg.sig.cluster.summary files from the group level analysis. I can get the peak voxel coordinates from the summary files as well. I can use this to get the peak voxel p from the group level sig.nii.gz file. Is this FWE corrected? If not, how can I get this information? I can use these coordinates to get the peak voxel T by getting the value from the group level F.nii.gz file and taking its square root. How can I get the sign of the T statistic? I can use the Lancaster transform to convert the MNI305 peak voxel coordinates into the Atlas coordinates to look up the putative BA and landmarks (unless there is a better way with Freesurfer? I'm seeing some references to some BA labels in the forum but it doesn't look like this is a complete set yet?).
Sorry for all these questions! I got some nice results from FSFAST and would like to get them written up.
Cheers!
Joe
On May 29, 2013, at 10:53 PM, Douglas Greve <greve@nmr.mgh.harvard.edu mailto:greve@nmr.mgh.harvard.edu> wrote:
> > On 5/29/13 10:42 PM, Joseph Dien wrote: >> >> On May 29, 2013, at 11:40 AM, Douglas N Greve >> <greve@NMR.MGH.HARVARD.EDU mailto:greve@NMR.MGH.HARVARD.EDU> wrote: >> >>> Hi Joe, >>> >>> On 05/29/2013 01:00 AM, Joseph Dien wrote: >>>> I need to extract the beta weights from a cluster identified with >>>> FS-Fast in order to compute percentage signal change. >>>> >>>> 1) I see a file called beta.nii.gz that appears to have the beta >>>> weight information. It has a four dimensional structure and the >>>> fourth dimension appears to be the beta weights. Is there an index >>>> somewhere as to which beta weight is which? Or if not, how are they >>>> organized? >>> For the first level analysis, the first N beta weights correspond >>> to the >>> N conditions in the paradigm file. The rest are nuisance variables. >>>> >> >> Ah, very good! In order to compute the percent signal change >> statistic (I'm following the MarsBaR approach: >> http://marsbar.sourceforge.net/faq.html#how-is-the-percent-signal-change-cal...) >> I'm also going to need the beta weights for the session mean >> regressors. How are the nuisance regressors organized? > You can just use the meanfunc.nii.gz. Also, each contrasts is > computed as the simple contrast (ces) and as a percent of the > baseline at the voxel (cespct, cesvarpct). >> >>>> 2) In order to extract the cluster, it looks like I would >>>> use mri_label2vol to convert cache.th20.neg.sig.ocn.annot into a >>>> volume where the voxels are tagged with the number of the >>>> corresponding cluster. >>> Is that from a group analysis? >>>> >> >> Yes, that's right. >> >>>> I could then use that to generate masks to extract the information I >>>> need for each cluster from beta.nii.gz. >>> If this is from a group analysis, then there should already be a file >>> there (something.y.ocn.dat) that has a value for each subject in the >>> rows and a value for each cluster in the columns. >>>> >> >> I see it. Are these values already scaled as percent signal >> change? If so, that would be wonderful! :) > Only if you specified it when you ran isxconcat-sess. Note that the > "non-scaled" values are actually scaled to percent of grand mean > intensity. >> >>>> Is that correct? >>>> >>>> 3) The final information that I would need is the canonical hrf >>>> shape >>>> generated by FSFAST for a single event. I guess I could generate >>>> that >>>> by setting up a dummy analysis run with a single event of the >>>> desired >>>> duration and then look in the X variable in the resulting X.mat file? >>> try this >>> plot(X.runflac(1).flac.ev(2).tirf, X.runflac(1).flac.ev(2).Xirf) >>>> >> >> Perfect! :) >> >>>> Sorry for all the questions! >>>> >>>> Joe >>>> >>>> >>>> >>>>
Joseph Dien, Senior Research Scientist University of Maryland
E-mail: jdien07@mac.com Phone: 301-226-8848 Fax: 301-226-8811 http://joedien.com//
Freesurfer mailing list Freesurfer@nmr.mgh.harvard.edu https://mail.nmr.mgh.harvard.edu/mailman/listinfo/freesurfer
The information in this e-mail is intended only for the person to whom it is addressed. If you believe this e-mail was sent to you in error and the e-mail contains patient information, please contact the Partners Compliance HelpLine at http://www.partners.org/complianceline . If the e-mail was sent to you in error but does not contain patient information, please contact the sender and properly dispose of the e-mail.
--------------------------------------------------------------------------------
Joseph Dien, Senior Research Scientist University of Maryland
E-mail: jdien07@mac.com Phone: 301-226-8848 Fax: 301-226-8811 http://joedien.com//
On 05/30/2013 04:37 PM, Joseph Dien wrote:
Just to make sure I'm doing this right, I'm going to summarize what I've taken away from your answers and to ask some new questions. In order to present the results, I need two things:
- A set of histograms (with error bars) for each cluster figure to
show the % signal change for each of the four contrasts of interest. The cache.th20.pos.y.ocn.dat file only gives it for the condition where the cluster was significant so I can't use that. So I could use mri_label2vol to convert cache.th20.neg.sig.ocn.annot from the group level analysis to generate a mask for each cluster of interest. Then I could extract the value of the voxels from each subject's cespct file for each contrast, average them across the cluster ROI, then average them across each subject, to generate the histogram? This would suffice to give me the %age signal change? I would be doing these computations in Matlab using MRIread.
I don't understand. If you don't have a cluster for a contrast, how are you defining the cluster? From another contrast?
- A results table with the headings:
Cluster p (FWE corrected) Cluster size Peak Voxel p (FWE corrected) Peak Voxel T Peak Voxel Coords BA Anatomical Landmark
I can get the first two from the cache.th20.pos/neg.sig.cluster.summary files from the group level analysis. I can get the peak voxel coordinates from the summary files as well. I can use this to get the peak voxel p from the group level sig.nii.gz file. Is this FWE corrected? If not, how can I get this information?
What do you mean? The cluster p-value is corrected, why do you need the max p and why does it need to be corrected?
I can use these coordinates to get the peak voxel T by getting the value from the group level F.nii.gz file and taking its square root. How can I get the sign of the T statistic?
Same as the sign of gamma.mgh
I can use the Lancaster transform to convert the MNI305 peak voxel coordinates into the Atlas coordinates to look up the putative BA and landmarks (unless there is a better way with Freesurfer? I'm seeing some references to some BA labels in the forum but it doesn't look like this is a complete set yet?).
Some of the BA labels are in FS, but not nearly all of them doug
Sorry for all these questions! I got some nice results from FSFAST and would like to get them written up.
Cheers!
Joe
On May 29, 2013, at 10:53 PM, Douglas Greve <greve@nmr.mgh.harvard.edu mailto:greve@nmr.mgh.harvard.edu> wrote:
On 5/29/13 10:42 PM, Joseph Dien wrote:
On May 29, 2013, at 11:40 AM, Douglas N Greve <greve@NMR.MGH.HARVARD.EDU mailto:greve@NMR.MGH.HARVARD.EDU> wrote:
Hi Joe,
On 05/29/2013 01:00 AM, Joseph Dien wrote:
I need to extract the beta weights from a cluster identified with FS-Fast in order to compute percentage signal change.
- I see a file called beta.nii.gz that appears to have the beta
weight information. It has a four dimensional structure and the fourth dimension appears to be the beta weights. Is there an index somewhere as to which beta weight is which? Or if not, how are they organized?
For the first level analysis, the first N beta weights correspond to the N conditions in the paradigm file. The rest are nuisance variables.
Ah, very good! In order to compute the percent signal change statistic (I'm following the MarsBaR approach: http://marsbar.sourceforge.net/faq.html#how-is-the-percent-signal-change-cal...) I'm also going to need the beta weights for the session mean regressors. How are the nuisance regressors organized?
You can just use the meanfunc.nii.gz. Also, each contrasts is computed as the simple contrast (ces) and as a percent of the baseline at the voxel (cespct, cesvarpct).
- In order to extract the cluster, it looks like I would
use mri_label2vol to convert cache.th20.neg.sig.ocn.annot into a volume where the voxels are tagged with the number of the corresponding cluster.
Is that from a group analysis?
Yes, that's right.
I could then use that to generate masks to extract the information I need for each cluster from beta.nii.gz.
If this is from a group analysis, then there should already be a file there (something.y.ocn.dat) that has a value for each subject in the rows and a value for each cluster in the columns.
I see it. Are these values already scaled as percent signal change? If so, that would be wonderful! :)
Only if you specified it when you ran isxconcat-sess. Note that the "non-scaled" values are actually scaled to percent of grand mean intensity.
Is that correct?
- The final information that I would need is the canonical hrf shape
generated by FSFAST for a single event. I guess I could generate that by setting up a dummy analysis run with a single event of the desired duration and then look in the X variable in the resulting X.mat file?
try this plot(X.runflac(1).flac.ev(2).tirf, X.runflac(1).flac.ev(2).Xirf)
Perfect! :)
Sorry for all the questions!
Joe
Joseph Dien, Senior Research Scientist University of Maryland
E-mail: jdien07@mac.com mailto:jdien07@mac.com mailto:jdien07@mac.com Phone: 301-226-8848 Fax: 301-226-8811 http://joedien.com//
Freesurfer mailing list Freesurfer@nmr.mgh.harvard.edu https://mail.nmr.mgh.harvard.edu/mailman/listinfo/freesurfer
-- Douglas N. Greve, Ph.D. MGH-NMR Center greve@nmr.mgh.harvard.edu mailto:greve@nmr.mgh.harvard.edu Phone Number: 617-724-2358 Fax: 617-726-7422
Bugs: surfer.nmr.mgh.harvard.edu/fswiki/BugReporting FileDrop: https://gate.nmr.mgh.harvard.edu/filedrop2 www.nmr.mgh.harvard.edu/facility/filedrop/index.html Outgoing: ftp://surfer.nmr.mgh.harvard.edu/transfer/outgoing/flat/greve/
Freesurfer mailing list Freesurfer@nmr.mgh.harvard.edu https://mail.nmr.mgh.harvard.edu/mailman/listinfo/freesurfer
The information in this e-mail is intended only for the person to whom it is addressed. If you believe this e-mail was sent to you in error and the e-mail contains patient information, please contact the Partners Compliance HelpLine at http://www.partners.org/complianceline . If the e-mail was sent to you in error but does not contain patient information, please contact the sender and properly dispose of the e-mail.
Joseph Dien, Senior Research Scientist University of Maryland
E-mail: jdien07@mac.com mailto:jdien07@mac.com Phone: 301-226-8848 Fax: 301-226-8811 http://joedien.com//
Freesurfer mailing list Freesurfer@nmr.mgh.harvard.edu mailto:Freesurfer@nmr.mgh.harvard.edu https://mail.nmr.mgh.harvard.edu/mailman/listinfo/freesurfer
The information in this e-mail is intended only for the person to whom it is addressed. If you believe this e-mail was sent to you in error and the e-mail contains patient information, please contact the Partners Compliance HelpLine at http://www.partners.org/complianceline . If the e-mail was sent to you in error but does not contain patient information, please contact the sender and properly dispose of the e-mail.
Joseph Dien, Senior Research Scientist University of Maryland
E-mail: jdien07@mac.com mailto:jdien07@mac.com Phone: 301-226-8848 Fax: 301-226-8811 http://joedien.com//
On May 31, 2013, at 12:09 PM, Douglas N Greve greve@nmr.mgh.harvard.edu wrote:
On 05/30/2013 04:37 PM, Joseph Dien wrote:
Just to make sure I'm doing this right, I'm going to summarize what I've taken away from your answers and to ask some new questions. In order to present the results, I need two things:
- A set of histograms (with error bars) for each cluster figure to
show the % signal change for each of the four contrasts of interest. The cache.th20.pos.y.ocn.dat file only gives it for the condition where the cluster was significant so I can't use that. So I could use mri_label2vol to convert cache.th20.neg.sig.ocn.annot from the group level analysis to generate a mask for each cluster of interest. Then I could extract the value of the voxels from each subject's cespct file for each contrast, average them across the cluster ROI, then average them across each subject, to generate the histogram? This would suffice to give me the %age signal change? I would be doing these computations in Matlab using MRIread.
I don't understand. If you don't have a cluster for a contrast, how are you defining the cluster? From another contrast?
Well, what the reviewer told me to do is if I present a figure with a significant cluster for one condition, I should use that as an ROI to calculate the %age signal change for all four conditions and present it as a bar chart as part of the figure. I think she wanted to be able to get a more qualitative sense of the data patterns.
- A results table with the headings:
Cluster p (FWE corrected) Cluster size Peak Voxel p (FWE corrected) Peak Voxel T Peak Voxel Coords BA Anatomical Landmark
I can get the first two from the cache.th20.pos/neg.sig.cluster.summary files from the group level analysis. I can get the peak voxel coordinates from the summary files as well. I can use this to get the peak voxel p from the group level sig.nii.gz file. Is this FWE corrected? If not, how can I get this information?
What do you mean? The cluster p-value is corrected, why do you need the max p and why does it need to be corrected?
Well, as I understand it, the drawback of clusterwise statistics is that while it assures you that the cluster passes muster as not being due to random chance (at 95% confidence), it doesn't provide any assurances at the voxel level (or in this case the vertex level) as it is likely that a cluster is composed of both signal and noise and you don't know which part is which. So if a cluster covers both BA44 and BA45 (for example), you can't be sure whether the activation involves BA44, BA45, or both. A voxelwise correction is more conservative but if it provides significance, it does allow for this kind of interpretation.
I can use these coordinates to get the peak voxel T by getting the value from the group level F.nii.gz file and taking its square root. How can I get the sign of the T statistic?
Same as the sign of gamma.mgh
Ah, great!
I can use the Lancaster transform to convert the MNI305 peak voxel coordinates into the Atlas coordinates to look up the putative BA and landmarks (unless there is a better way with Freesurfer? I'm seeing some references to some BA labels in the forum but it doesn't look like this is a complete set yet?).
Some of the BA labels are in FS, but not nearly all of them doug
No problem! I worked out that I can use the talairach.nii file made available by the Talairach Daemon folks.
Sorry for all these questions! I got some nice results from FSFAST and would like to get them written up.
Cheers!
Joe
On May 29, 2013, at 10:53 PM, Douglas Greve <greve@nmr.mgh.harvard.edu mailto:greve@nmr.mgh.harvard.edu> wrote:
On 5/29/13 10:42 PM, Joseph Dien wrote:
On May 29, 2013, at 11:40 AM, Douglas N Greve <greve@NMR.MGH.HARVARD.EDU mailto:greve@NMR.MGH.HARVARD.EDU> wrote:
Hi Joe,
On 05/29/2013 01:00 AM, Joseph Dien wrote:
I need to extract the beta weights from a cluster identified with FS-Fast in order to compute percentage signal change.
- I see a file called beta.nii.gz that appears to have the beta
weight information. It has a four dimensional structure and the fourth dimension appears to be the beta weights. Is there an index somewhere as to which beta weight is which? Or if not, how are they organized?
For the first level analysis, the first N beta weights correspond to the N conditions in the paradigm file. The rest are nuisance variables.
Ah, very good! In order to compute the percent signal change statistic (I'm following the MarsBaR approach: http://marsbar.sourceforge.net/faq.html#how-is-the-percent-signal-change-cal...) I'm also going to need the beta weights for the session mean regressors. How are the nuisance regressors organized?
You can just use the meanfunc.nii.gz. Also, each contrasts is computed as the simple contrast (ces) and as a percent of the baseline at the voxel (cespct, cesvarpct).
- In order to extract the cluster, it looks like I would
use mri_label2vol to convert cache.th20.neg.sig.ocn.annot into a volume where the voxels are tagged with the number of the corresponding cluster.
Is that from a group analysis?
Yes, that's right.
I could then use that to generate masks to extract the information I need for each cluster from beta.nii.gz.
If this is from a group analysis, then there should already be a file there (something.y.ocn.dat) that has a value for each subject in the rows and a value for each cluster in the columns.
I see it. Are these values already scaled as percent signal change? If so, that would be wonderful! :)
Only if you specified it when you ran isxconcat-sess. Note that the "non-scaled" values are actually scaled to percent of grand mean intensity.
Is that correct?
- The final information that I would need is the canonical hrf shape
generated by FSFAST for a single event. I guess I could generate that by setting up a dummy analysis run with a single event of the desired duration and then look in the X variable in the resulting X.mat file?
try this plot(X.runflac(1).flac.ev(2).tirf, X.runflac(1).flac.ev(2).Xirf)
Perfect! :)
Sorry for all the questions!
Joe
Joseph Dien, Senior Research Scientist University of Maryland
E-mail: jdien07@mac.com mailto:jdien07@mac.com mailto:jdien07@mac.com Phone: 301-226-8848 Fax: 301-226-8811 http://joedien.com//
Freesurfer mailing list Freesurfer@nmr.mgh.harvard.edu https://mail.nmr.mgh.harvard.edu/mailman/listinfo/freesurfer
-- Douglas N. Greve, Ph.D. MGH-NMR Center greve@nmr.mgh.harvard.edu mailto:greve@nmr.mgh.harvard.edu Phone Number: 617-724-2358 Fax: 617-726-7422
Bugs: surfer.nmr.mgh.harvard.edu/fswiki/BugReporting FileDrop: https://gate.nmr.mgh.harvard.edu/filedrop2 www.nmr.mgh.harvard.edu/facility/filedrop/index.html Outgoing: ftp://surfer.nmr.mgh.harvard.edu/transfer/outgoing/flat/greve/
Freesurfer mailing list Freesurfer@nmr.mgh.harvard.edu https://mail.nmr.mgh.harvard.edu/mailman/listinfo/freesurfer
The information in this e-mail is intended only for the person to whom it is addressed. If you believe this e-mail was sent to you in error and the e-mail contains patient information, please contact the Partners Compliance HelpLine at http://www.partners.org/complianceline . If the e-mail was sent to you in error but does not contain patient information, please contact the sender and properly dispose of the e-mail.
Joseph Dien, Senior Research Scientist University of Maryland
E-mail: jdien07@mac.com mailto:jdien07@mac.com Phone: 301-226-8848 Fax: 301-226-8811 http://joedien.com//
Freesurfer mailing list Freesurfer@nmr.mgh.harvard.edu mailto:Freesurfer@nmr.mgh.harvard.edu https://mail.nmr.mgh.harvard.edu/mailman/listinfo/freesurfer
The information in this e-mail is intended only for the person to whom it is addressed. If you believe this e-mail was sent to you in error and the e-mail contains patient information, please contact the Partners Compliance HelpLine at http://www.partners.org/complianceline . If the e-mail was sent to you in error but does not contain patient information, please contact the sender and properly dispose of the e-mail.
Joseph Dien, Senior Research Scientist University of Maryland
E-mail: jdien07@mac.com mailto:jdien07@mac.com Phone: 301-226-8848 Fax: 301-226-8811 http://joedien.com//
-- Douglas N. Greve, Ph.D. MGH-NMR Center greve@nmr.mgh.harvard.edu Phone Number: 617-724-2358 Fax: 617-726-7422
Bugs: surfer.nmr.mgh.harvard.edu/fswiki/BugReporting FileDrop: https://gate.nmr.mgh.harvard.edu/filedrop2 www.nmr.mgh.harvard.edu/facility/filedrop/index.html Outgoing: ftp://surfer.nmr.mgh.harvard.edu/transfer/outgoing/flat/greve/
Freesurfer mailing list Freesurfer@nmr.mgh.harvard.edu https://mail.nmr.mgh.harvard.edu/mailman/listinfo/freesurfer
--------------------------------------------------------------------------------
Joseph Dien, Senior Research Scientist University of Maryland
E-mail: jdien07@mac.com Phone: 301-226-8848 Fax: 301-226-8811 http://joedien.com//
On 05/31/2013 02:45 PM, Joseph Dien wrote:
On May 31, 2013, at 12:09 PM, Douglas N Greve <greve@nmr.mgh.harvard.edu mailto:greve@nmr.mgh.harvard.edu> wrote:
On 05/30/2013 04:37 PM, Joseph Dien wrote:
Just to make sure I'm doing this right, I'm going to summarize what I've taken away from your answers and to ask some new questions. In order to present the results, I need two things:
- A set of histograms (with error bars) for each cluster figure to
show the % signal change for each of the four contrasts of interest. The cache.th20.pos.y.ocn.dat file only gives it for the condition where the cluster was significant so I can't use that. So I could use mri_label2vol to convert cache.th20.neg.sig.ocn.annot from the group level analysis to generate a mask for each cluster of interest. Then I could extract the value of the voxels from each subject's cespct file for each contrast, average them across the cluster ROI, then average them across each subject, to generate the histogram? This would suffice to give me the %age signal change? I would be doing these computations in Matlab using MRIread.
I don't understand. If you don't have a cluster for a contrast, how are you defining the cluster? From another contrast?
Well, what the reviewer told me to do is if I present a figure with a significant cluster for one condition, I should use that as an ROI to calculate the %age signal change for all four conditions and present it as a bar chart as part of the figure. I think she wanted to be able to get a more qualitative sense of the data patterns.
If you have a cluster annotation (created by mri_glmfit-sim) then you can apply that to each contrast using mri_segstats with the --annot option.
- A results table with the headings:
Cluster p (FWE corrected) Cluster size Peak Voxel p (FWE corrected) Peak Voxel T Peak Voxel Coords BA Anatomical Landmark
I can get the first two from the cache.th20.pos/neg.sig.cluster.summary files from the group level analysis. I can get the peak voxel coordinates from the summary files as well. I can use this to get the peak voxel p from the group level sig.nii.gz file. Is this FWE corrected? If not, how can I get this information?
What do you mean? The cluster p-value is corrected, why do you need the max p and why does it need to be corrected?
Well, as I understand it, the drawback of clusterwise statistics is that while it assures you that the cluster passes muster as not being due to random chance (at 95% confidence), it doesn't provide any assurances at the voxel level (or in this case the vertex level) as it is likely that a cluster is composed of both signal and noise and you don't know which part is which. So if a cluster covers both BA44 and BA45 (for example), you can't be sure whether the activation involves BA44, BA45, or both. A voxelwise correction is more conservative but if it provides significance, it does allow for this kind of interpretation.
I can use these coordinates to get the peak voxel T by getting the value from the group level F.nii.gz file and taking its square root. How can I get the sign of the T statistic?
Same as the sign of gamma.mgh
Ah, great!
I can use the Lancaster transform to convert the MNI305 peak voxel coordinates into the Atlas coordinates to look up the putative BA and landmarks (unless there is a better way with Freesurfer? I'm seeing some references to some BA labels in the forum but it doesn't look like this is a complete set yet?).
Some of the BA labels are in FS, but not nearly all of them doug
No problem! I worked out that I can use the talairach.nii file made available by the Talairach Daemon folks.
Sorry for all these questions! I got some nice results from FSFAST and would like to get them written up.
Cheers!
Joe
On May 29, 2013, at 10:53 PM, Douglas Greve <greve@nmr.mgh.harvard.edu mailto:greve@nmr.mgh.harvard.edu mailto:greve@nmr.mgh.harvard.edu> wrote:
On 5/29/13 10:42 PM, Joseph Dien wrote:
On May 29, 2013, at 11:40 AM, Douglas N Greve <greve@NMR.MGH.HARVARD.EDU mailto:greve@NMR.MGH.HARVARD.EDU mailto:greve@NMR.MGH.HARVARD.EDU> wrote:
Hi Joe,
On 05/29/2013 01:00 AM, Joseph Dien wrote: > I need to extract the beta weights from a cluster identified with > FS-Fast in order to compute percentage signal change. > > 1) I see a file called beta.nii.gz that appears to have the beta > weight information. It has a four dimensional structure and the > fourth dimension appears to be the beta weights. Is there an index > somewhere as to which beta weight is which? Or if not, how are they > organized? For the first level analysis, the first N beta weights correspond to the N conditions in the paradigm file. The rest are nuisance variables. >
Ah, very good! In order to compute the percent signal change statistic (I'm following the MarsBaR approach: http://marsbar.sourceforge.net/faq.html#how-is-the-percent-signal-change-cal...)
I'm also going to need the beta weights for the session mean regressors. How are the nuisance regressors organized?
You can just use the meanfunc.nii.gz. Also, each contrasts is computed as the simple contrast (ces) and as a percent of the baseline at the voxel (cespct, cesvarpct).
> 2) In order to extract the cluster, it looks like I would > use mri_label2vol to convert cache.th20.neg.sig.ocn.annot into a > volume where the voxels are tagged with the number of the > corresponding cluster. Is that from a group analysis? >
Yes, that's right.
> I could then use that to generate masks to extract the information I > need for each cluster from beta.nii.gz. If this is from a group analysis, then there should already be a file there (something.y.ocn.dat) that has a value for each subject in the rows and a value for each cluster in the columns. >
I see it. Are these values already scaled as percent signal change? If so, that would be wonderful! :)
Only if you specified it when you ran isxconcat-sess. Note that the "non-scaled" values are actually scaled to percent of grand mean intensity.
> Is that correct? > > 3) The final information that I would need is the canonical hrf > shape > generated by FSFAST for a single event. I guess I could generate > that > by setting up a dummy analysis run with a single event of the > desired > duration and then look in the X variable in the resulting X.mat > file? try this plot(X.runflac(1).flac.ev(2).tirf, X.runflac(1).flac.ev(2).Xirf) >
Perfect! :)
> Sorry for all the questions! > > Joe > > > > > -------------------------------------------------------------------------------- > > Joseph Dien, > Senior Research Scientist > University of Maryland > > E-mail: jdien07@mac.com mailto:jdien07@mac.com > mailto:jdien07@mac.com > mailto:jdien07@mac.com > Phone: 301-226-8848 > Fax: 301-226-8811 > http://joedien.com// > > > > > > > > > > > > > > _______________________________________________ > Freesurfer mailing list > Freesurfer@nmr.mgh.harvard.edu > https://mail.nmr.mgh.harvard.edu/mailman/listinfo/freesurfer
-- Douglas N. Greve, Ph.D. MGH-NMR Center greve@nmr.mgh.harvard.edu mailto:greve@nmr.mgh.harvard.edu mailto:greve@nmr.mgh.harvard.edu Phone Number: 617-724-2358 Fax: 617-726-7422
Bugs: surfer.nmr.mgh.harvard.edu/fswiki/BugReporting FileDrop: https://gate.nmr.mgh.harvard.edu/filedrop2 www.nmr.mgh.harvard.edu/facility/filedrop/index.html http://www.nmr.mgh.harvard.edu/facility/filedrop/index.html Outgoing: ftp://surfer.nmr.mgh.harvard.edu/transfer/outgoing/flat/greve/
Freesurfer mailing list Freesurfer@nmr.mgh.harvard.edu https://mail.nmr.mgh.harvard.edu/mailman/listinfo/freesurfer
The information in this e-mail is intended only for the person to whom it is addressed. If you believe this e-mail was sent to you in error and the e-mail contains patient information, please contact the Partners Compliance HelpLine at http://www.partners.org/complianceline . If the e-mail was sent to you in error but does not contain patient information, please contact the sender and properly dispose of the e-mail.
Joseph Dien, Senior Research Scientist University of Maryland
E-mail: jdien07@mac.com mailto:jdien07@mac.com mailto:jdien07@mac.com Phone: 301-226-8848 Fax: 301-226-8811 http://joedien.com//
Freesurfer mailing list Freesurfer@nmr.mgh.harvard.edu mailto:Freesurfer@nmr.mgh.harvard.edu mailto:Freesurfer@nmr.mgh.harvard.edu https://mail.nmr.mgh.harvard.edu/mailman/listinfo/freesurfer
The information in this e-mail is intended only for the person to whom it is addressed. If you believe this e-mail was sent to you in error and the e-mail contains patient information, please contact the Partners Compliance HelpLine at http://www.partners.org/complianceline . If the e-mail was sent to you in error but does not contain patient information, please contact the sender and properly dispose of the e-mail.
Joseph Dien, Senior Research Scientist University of Maryland
E-mail: jdien07@mac.com mailto:jdien07@mac.com mailto:jdien07@mac.com Phone: 301-226-8848 Fax: 301-226-8811 http://joedien.com//
-- Douglas N. Greve, Ph.D. MGH-NMR Center greve@nmr.mgh.harvard.edu mailto:greve@nmr.mgh.harvard.edu Phone Number: 617-724-2358 Fax: 617-726-7422
Bugs: surfer.nmr.mgh.harvard.edu/fswiki/BugReporting FileDrop: https://gate.nmr.mgh.harvard.edu/filedrop2 www.nmr.mgh.harvard.edu/facility/filedrop/index.html Outgoing: ftp://surfer.nmr.mgh.harvard.edu/transfer/outgoing/flat/greve/
Freesurfer mailing list Freesurfer@nmr.mgh.harvard.edu https://mail.nmr.mgh.harvard.edu/mailman/listinfo/freesurfer
Joseph Dien, Senior Research Scientist University of Maryland
E-mail: jdien07@mac.com mailto:jdien07@mac.com Phone: 301-226-8848 Fax: 301-226-8811 http://joedien.com//
freesurfer@nmr.mgh.harvard.edu
-
 Douglas Greve
 -
Douglas N Greve
-
 Joseph Dien