
Dear Freesurfers,
I have performed a permutation test with the command:
mri_glmfit-sim --glmdir rh.fsgd_subj_gauss005 --sim mc-z 10000 THRESHOLD csd --sim-sign pos --seed 1297708255
And after that I have obtained the clusters with:
mri_surfcluster --subject CNTRL_MCI_RAFA_average –mask rh.fsgd_subj_gauss005/mask.mgh --sum rh.fsgd_subj_gauss005/contrast/clustsum.txt --in rh.fsgd_subj_gauss005/contrast/sig.mgh --cwsig rh.fsgd_subj_gauss005/contrast/cwsig.mgh --vwsig rh.fsgd_subj_gauss005/contrast/vwsig.mgh --sign pos --csd rh.fsgd_subj_gauss005/csd/csd.j001-contrast.csd
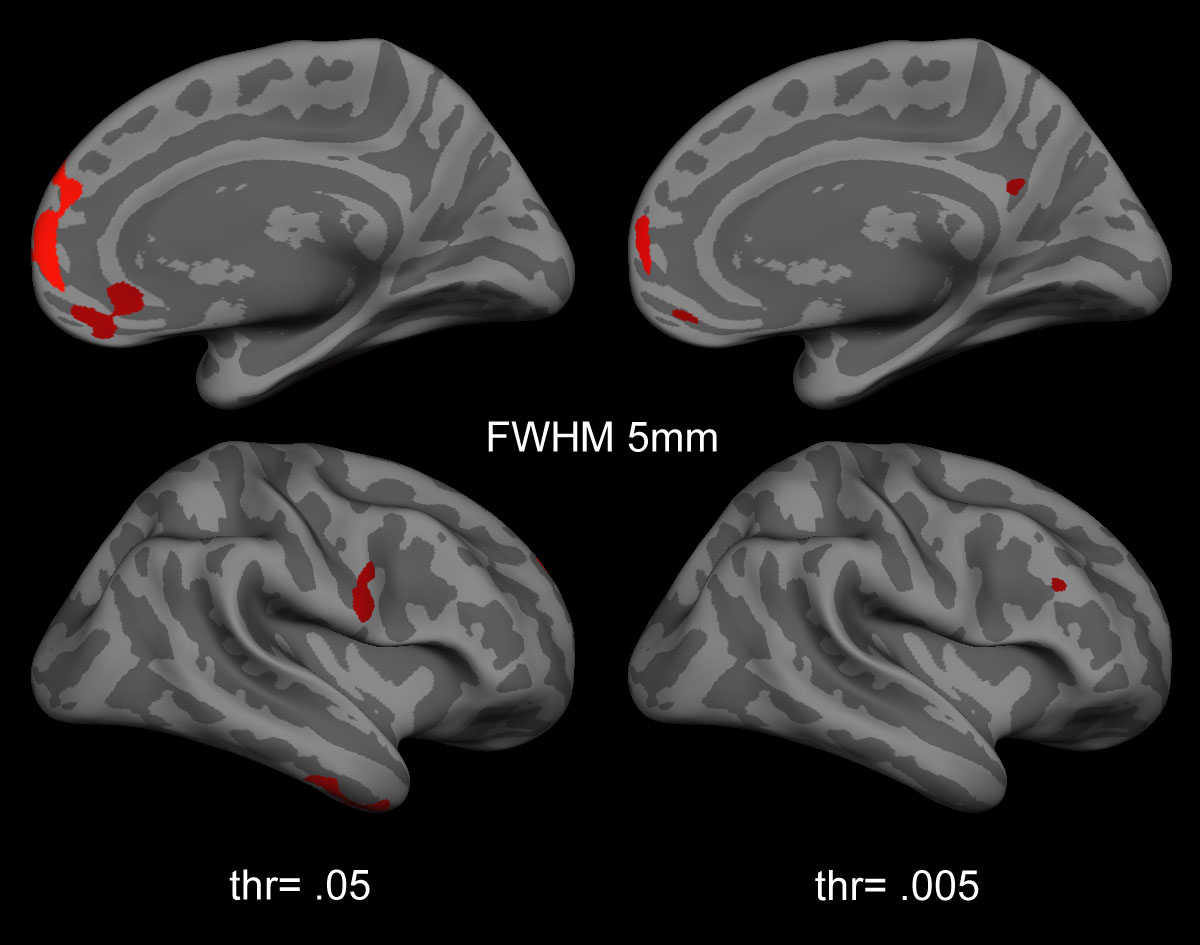
I’ve did it over the same dataset but with two different thresholds, THRESHOLD: 2.301 (pvalue=0.005) and 1.301 (pvalue=0.05). As far I know the cwsig.mgh resulting using the 1.3 threshold should be similar than the cwsig.mgh from the second thr, but with a more restrictive significative clusters (some coloured areas should disappear, in other words, clusters returned in the first case should be included in clusters returned by the 1.3 threshold). My results didn’t show that behaviour, some of the cwsig clusters can be contained in the other, but others don’t (see attached Figure). It is my reasoning correct? If so, why the images mismatching?
Thank you all in advance. Rafa.

It should be the case that the clusters in the 2.3 should be clusters in the 1.3, but there p-values will be different. It is possible that a cluster that is sig in the 2.3 is not sig in the 1.3, particularly small clusters like the two you have shown. Small clusters may be very likely at 1.3 under chance conditions.
doug
Rafa x wrote:
Dear Freesurfers,
I have performed a permutation test with the command:
mri_glmfit-sim --glmdir rh.fsgd_subj_gauss005 --sim mc-z 10000 THRESHOLD csd --sim-sign pos --seed 1297708255
And after that I have obtained the clusters with:
mri_surfcluster --subject CNTRL_MCI_RAFA_average –mask rh.fsgd_subj_gauss005/mask.mgh --sum rh.fsgd_subj_gauss005/contrast/clustsum.txt --in rh.fsgd_subj_gauss005/contrast/sig.mgh --cwsig rh.fsgd_subj_gauss005/contrast/cwsig.mgh --vwsig rh.fsgd_subj_gauss005/contrast/vwsig.mgh --sign pos --csd rh.fsgd_subj_gauss005/csd/csd.j001-contrast.csd
I’ve did it over the same dataset but with two different thresholds, THRESHOLD: 2.301 (pvalue=0.005) and 1.301 (pvalue=0.05). As far I know the cwsig.mgh resulting using the 1.3 threshold should be similar than the cwsig.mgh from the second thr, but with a more restrictive significative clusters (some coloured areas should disappear, in other words, clusters returned in the first case should be included in clusters returned by the 1.3 threshold). My results didn’t show that behaviour, some of the cwsig clusters can be contained in the other, but others don’t (see attached Figure). It is my reasoning correct? If so, why the images mismatching?
Thank you all in advance. Rafa.
Freesurfer mailing list Freesurfer@nmr.mgh.harvard.edu https://mail.nmr.mgh.harvard.edu/mailman/listinfo/freesurfer

This is not my understanding. It is completely dependent on the threshold used, which can be arbitrary. See Supplemental figure 7, page 16 of this document:
http://www.jneurosci.org/cgi/data/30/6/2268/DC1/1
This was the motivation for Smith & Nichols' TFCE:
http://www.ncbi.nlm.nih.gov/pubmed/18501637
On 02/22/2011 05:53 AM, Rafa x wrote:
Dear Freesurfers,
I have performed a permutation test with the command:
mri_glmfit-sim --glmdir rh.fsgd_subj_gauss005 --sim mc-z 10000 THRESHOLD csd --sim-sign pos --seed 1297708255
And after that I have obtained the clusters with:
mri_surfcluster --subject CNTRL_MCI_RAFA_average –mask rh.fsgd_subj_gauss005/mask.mgh --sum rh.fsgd_subj_gauss005/contrast/clustsum.txt --in rh.fsgd_subj_gauss005/contrast/sig.mgh --cwsig rh.fsgd_subj_gauss005/contrast/cwsig.mgh --vwsig rh.fsgd_subj_gauss005/contrast/vwsig.mgh --sign pos --csd rh.fsgd_subj_gauss005/csd/csd.j001-contrast.csd
I’ve did it over the same dataset but with two different thresholds, THRESHOLD: 2.301 (pvalue=0.005) and 1.301 (pvalue=0.05). As far I know the cwsig.mgh resulting using the 1.3 threshold should be similar than the cwsig.mgh from the second thr, but with a more restrictive significative clusters (some coloured areas should disappear, in other words, clusters returned in the first case should be included in clusters returned by the 1.3 threshold). My results didn’t show that behaviour, some of the cwsig clusters can be contained in the other, but others don’t (see attached Figure). It is my reasoning correct? If so, why the images mismatching?
Thank you all in advance. Rafa.
Freesurfer mailing list Freesurfer@nmr.mgh.harvard.edu https://mail.nmr.mgh.harvard.edu/mailman/listinfo/freesurfer
The information in this e-mail is intended only for the person to whom it is addressed. If you believe this e-mail was sent to you in error and the e-mail contains patient information, please contact the Partners Compliance HelpLine at http://www.partners.org/complianceline . If the e-mail was sent to you in error but does not contain patient information, please contact the sender and properly dispose of the e-mail.
freesurfer@nmr.mgh.harvard.edu
-
 Donna Dierker
 -
 Douglas N Greve
 -
 Rafa x