
Dear Freesurfer experts, I was wondering if you could help me in figuring out how to create a figure in tksurfer. A recent publication in PLoS One on William's Syndrome showed a figure with a color scale for the F-scores and reflected the F-values through colors that they obtained in ROI analyses. Does anyone have any suggestions for how they created this figure? I wrote the authors of the manuscript, but have not yet heard back. I would like to make a similar figure for some analyses I've recently run. I've attached a picture of the figure and the title of the article is Regional Brain Differences in Cortical Thickness, Surface Area and Subcortical Volume in Individuals with Williams Syndrome by Shashwath A. Meda, Jennifer R. Pryweller, Tricia A. Thornton-Wells
Thank you for your help! Best, Maria Jalbrzikowski

Hi Maria, I don't know exactly how they generated it. It might not even have been using the FS tools. If I were to do it in FS, I would create a segmentation by thresholding the continuous map into the ranges of F values I wanted. I would then create an annotation (mris_seg2annot) where I can control the RGB color that each segmentation gets. make sense? doug
On 02/24/2013 05:57 PM, Maria Jalbrzikowski wrote:
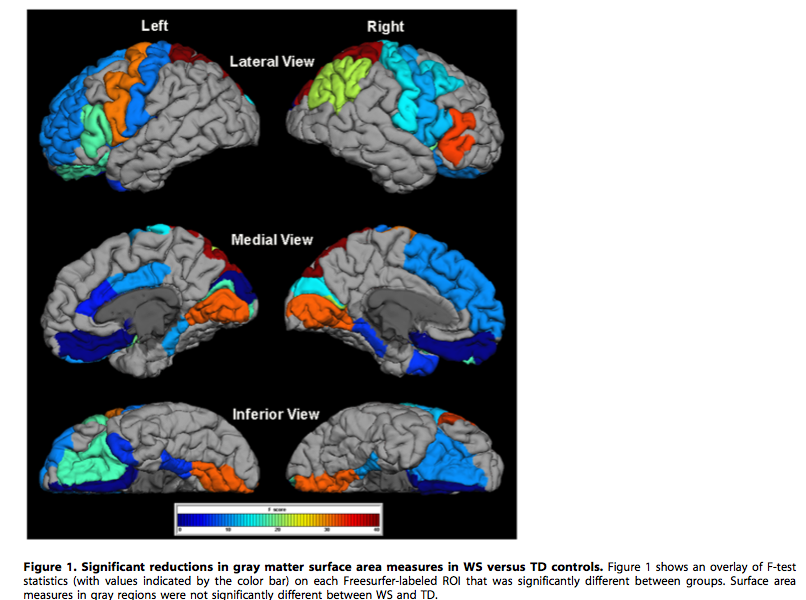
Dear Freesurfer experts, I was wondering if you could help me in figuring out how to create a figure in tksurfer. A recent publication in PLoS One on William's Syndrome showed a figure with a color scale for the F-scores and reflected the F-values through colors that they obtained in ROI analyses. Does anyone have any suggestions for how they created this figure? I wrote the authors of the manuscript, but have not yet heard back. I would like to make a similar figure for some analyses I've recently run. I've attached a picture of the figure and the title of the article is Regional Brain Differences in Cortical Thickness, Surface Area and Subcortical Volume in Individuals with Williams Syndrome by Shashwath A. Meda, Jennifer R. Pryweller, Tricia A. Thornton-Wells
Thank you for your help! Best, Maria Jalbrzikowski
-- Maria Jalbrzikowski, M.A. University of California, Los Angeles
Freesurfer mailing list Freesurfer@nmr.mgh.harvard.edu https://mail.nmr.mgh.harvard.edu/mailman/listinfo/freesurfer

Hi Maria,
We followed the steps laid out by Winkler here: http://brainder.org/2011/07/05/freesurfer-brains-in-arbitrary-colours/
It's actually quite easy, especially if you are are using parcellations as ROIs (which looks like what the authors did) and not vertex generated ROIs. You would have to decide on your F scale - RGB intensity scale arrangement. It would be different, say for t-scale that has positive and negative values. Otherwise, the steps are straight forward.
Hope this helps,
-David Vazquez National Science Foundation Graduate Research Fellow Cognitive Neuroscience Lab University California, Riverside
On Sun, Feb 24, 2013 at 2:57 PM, Maria Jalbrzikowski < mjalbrzikowski@gmail.com> wrote:
Dear Freesurfer experts, I was wondering if you could help me in figuring out how to create a figure in tksurfer. A recent publication in PLoS One on William's Syndrome showed a figure with a color scale for the F-scores and reflected the F-values through colors that they obtained in ROI analyses. Does anyone have any suggestions for how they created this figure? I wrote the authors of the manuscript, but have not yet heard back. I would like to make a similar figure for some analyses I've recently run. I've attached a picture of the figure and the title of the article is Regional Brain Differences in Cortical Thickness, Surface Area and Subcortical Volume in Individuals with Williams Syndrome by Shashwath A. Meda, Jennifer R. Pryweller, Tricia A. Thornton-Wells
Thank you for your help! Best, Maria Jalbrzikowski
-- Maria Jalbrzikowski, M.A. University of California, Los Angeles
Freesurfer mailing list Freesurfer@nmr.mgh.harvard.edu https://mail.nmr.mgh.harvard.edu/mailman/listinfo/freesurfer
The information in this e-mail is intended only for the person to whom it is addressed. If you believe this e-mail was sent to you in error and the e-mail contains patient information, please contact the Partners Compliance HelpLine at http://www.partners.org/complianceline . If the e-mail was sent to you in error but does not contain patient information, please contact the sender and properly dispose of the e-mail.
freesurfer@nmr.mgh.harvard.edu
-
 David Vazquez
 -
 Douglas N Greve
 -
 Maria Jalbrzikowski