
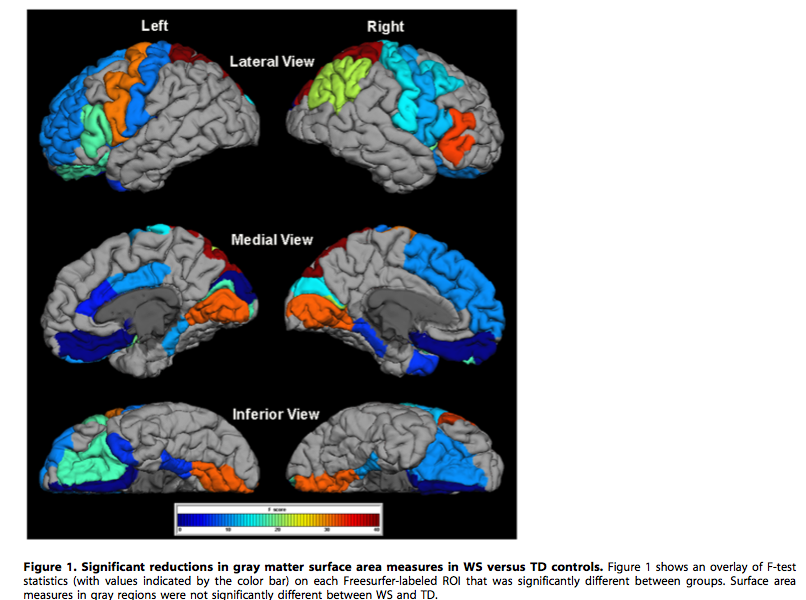
Dear Freesurfer experts, I was wondering if you could help me in figuring out how to create a figure in tksurfer. A recent publication in PLoS One on William's Syndrome showed a figure with a color scale for the F-scores and reflected the F-values through colors that they obtained in ROI analyses. Does anyone have any suggestions for how they created this figure? I wrote the authors of the manuscript, but have not yet heard back. I would like to make a similar figure for some analyses I've recently run. I've attached a picture of the figure and the title of the article is Regional Brain Differences in Cortical Thickness, Surface Area and Subcortical Volume in Individuals with Williams Syndrome by Shashwath A. Meda, Jennifer R. Pryweller, Tricia A. Thornton-Wells
Thank you for your help! Best, Maria Jalbrzikowski