
Hi Doug
I spoke with you at the Freesurfer tutorial last week about using mri_average to average my sulcal labels and get a probability map on fsaverage. You had suggested using "mri_concat" instead, which is a newer command. So, I performed the following command:
*mri_concat all files --o output.mgz --mean --keep-datatype*
I had to put --keep-datatype or else it tried to create an annot file.
This worked just fine.
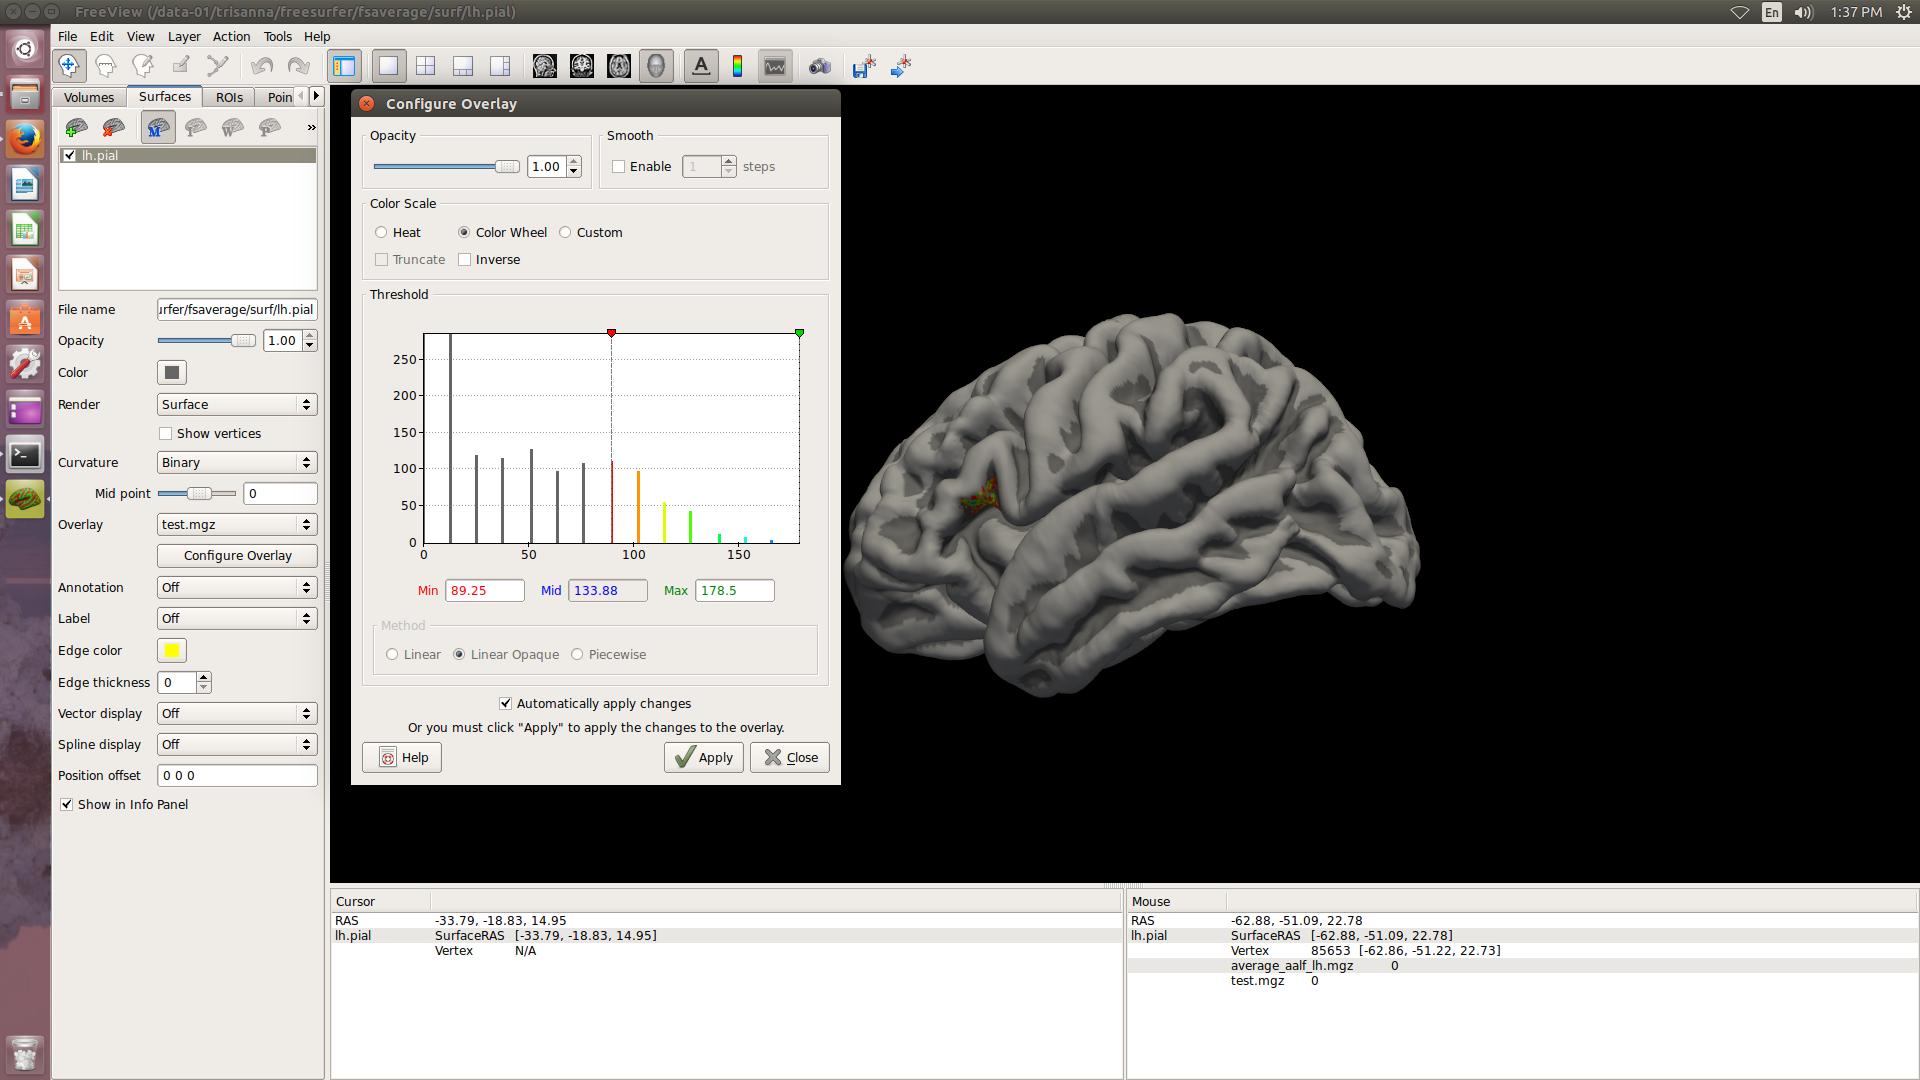
My question then is concerning *the min and max values *when this average is overlayed in Freeview. See the snapshot attached. The values seem to be based on 256 instead of percentage and this is what happens when I used "mri_average" without specifying the "-p". Is there a way to illustrate the values in percentage in a similar way with mri_concat?
Many thanks!
Trisanna
-- Ph.D. Candidate McGill University Integrated Program in Neuroscience Psychology