
Hi professor,
I am using Freesurfer for DTI data. When I run 'mri_segstats', I got the result that there was an obvious difference in left hippocampus, but no difference in right hippocampus. Then, I run segmentation of hippocampus subfields. The result showed there is no difference in total left or right hippocampus, and only in two right hippocampus subfields has significant difference. Why is there inconsistent result in two means? Thank you very much.
Sincerely, Zheng

Hi Zheng
no difference between what and what?
cheers Bruce On Fri, 17 Nov 2017, 郑凤莲 wrote:
Hi professor,
I am using Freesurfer for DTI data. When I run 'mri_segstats', I got the result that there was an obvious difference in left hippocampus, but no difference in right hippocampus. Then, I run segmentation of hippocampus subfields. The result showed there is no difference in total left or right hippocampus, and only in two right hippocampus subfields has significant difference. Why is there inconsistent result in two means? Thank you very much.
Sincerely, Zheng
Hi Bruce,
 I am sorry for this situation.
 In the first way, there was an statistical difference in left hippocampus, but no difference in
right hippocampus. In the second way, there was both no statistical difference in left or right hippocampus. I don't know what causes this result. Can you understand me this time?
Thanks, Zheng
At 2017-11-18 22:58:56, "Bruce Fischl" fischl@nmr.mgh.harvard.edu wrote:
Hi Zheng
no difference between what and what?
cheers Bruce On Fri, 17 Nov 2017, 郑凤莲 wrote:
Hi professor,
I am using Freesurfer for DTI data. When I run 'mri_segstats', I got the result that there wasan obvious difference in left hippocampus, but no difference in right hippocampus. Then, I run segmentation of hippocampus subfields. The result showed there is no difference in total left or right hippocampus, and only in two right hippocampus subfields has significant difference. Why is there inconsistent result in two means? Thank you very much.
Sincerely, Zheng
Hi Zheng
yes, I see. Maybe the effect is smaller than you have the power to see, or there is no effect? You would need to give us more details for us to help. Are you correcting for eTIV? What measure are you comparing?
cheers Bruce On Sun, 19 Nov 2017, 郑凤莲 wrote:
Hi Bruce,
I am sorry for this situation. In the first way, there was an statistical difference in left hippocampus, but no difference in right hippocampus. In the second way, there was both no statistical difference in left or right hippocampus. I don't know what causes this result. Can you understand me this time?
Thanks, Zheng
At 2017-11-18 22:58:56, "Bruce Fischl" fischl@nmr.mgh.harvard.edu wrote:
Hi Zheng
no difference between what and what?
cheers Bruce On Fri, 17 Nov 2017, 郑凤莲 wrote:
Hi professor,
I am using Freesurfer for DTI data. When I run 'mri_segstats', I got the result that there w
as
an obvious difference in left hippocampus, but no difference in right hippocampus. Then, I run segmentation of hippocampus subfields. The result showed there is no difference in total left or right hippocampus, and only in two right hippocampus subfields has significant difference. Why is there inconsistent result in two means? Thank you very much.
Sincerely, Zheng
Hi Bruce,
Thank you for your help.
I have  54 subjects, aged from 21 to 71 and only one group. I want to compare the change of
hippocampus volume with age. The results before and after doing the correction for eTIV are the same. Where is wrong? Or if there is no error, how can I explain it in discussion?
Thanks, Zheng
At 2017-11-20 04:55:49, "Bruce Fischl" fischl@nmr.mgh.harvard.edu wrote:
Hi Zheng
yes, I see. Maybe the effect is smaller than you have the power to see, or there is no effect? You would need to give us more details for us to help. Are you correcting for eTIV? What measure are you comparing?
cheers Bruce On Sun, 19 Nov 2017, 郑凤莲 wrote:
Hi Bruce,
I am sorry for this situation. In the first way, there was an statistical difference in left hippocampus, but no difference inright hippocampus. In the second way, there was both no statistical difference in left or right hippocampus. I don't know what causes this result. Can you understand me this time?
Thanks, Zheng
At 2017-11-18 22:58:56, "Bruce Fischl" fischl@nmr.mgh.harvard.edu wrote:
Hi Zheng
no difference between what and what?
cheers Bruce On Fri, 17 Nov 2017, 郑凤莲 wrote:
Hi professor,
I am using Freesurfer for DTI data. When I run 'mri_segstats', Igot the result that there w
as
an obvious difference in left hippocampus, but no difference in right hippocampus. Then, I run segmentation of hippocampus subfields. The result showed there is no difference in total left or right hippocampus, and only in two right hippocampus subfields has significant difference. Why is there inconsistent result in two means? Thank you very much.
Sincerely, Zheng
Hi Zheng
how uniform is your distribution? I'm hardly an expert on this, but I wouldn't expect very large effects until you get into the older end of that range. Have you scatter plotted your data? Bruce On Mon, 20 Nov 2017, 郑凤莲 wrote:
Hi Bruce,
Thank you for your help.
I have  54 subjects, aged from 21 to 71 and only one group. I want to compare the change of
hippocampus volume with age. The results before and after doing the correction for eTIV are the same. Where is wrong? Or if there is no error, how can I explain it in discussion?
Thanks, Zheng
At 2017-11-20 04:55:49, "Bruce Fischl" fischl@nmr.mgh.harvard.edu wrote:
Hi Zheng
yes, I see. Maybe the effect is smaller than you have the power to see, or there is no effect? You would need to give us more details for us to help. Are you correcting for eTIV? What measure are you comparing?
cheers Bruce On Sun, 19 Nov 2017, 郑凤莲 wrote:
Hi Bruce,
 I am sorry for this situation.
 In the first way, there was an statistical difference in left hippocampus, but no differe
nce
in
right hippocampus. In the second way, there was both no statistical difference in left or right hippocampus. I don't know what causes this result. Can you understand me this time?
Thanks, Zheng
At 2017-11-18 22:58:56, "Bruce Fischl" fischl@nmr.mgh.harvard.edu wrote:
Hi Zheng
no difference between what and what?
cheers Bruce On Fri, 17 Nov 2017, 郑凤莲 wrote:
Hi professor,
I am using Freesurfer for DTI data. When I run 'mri_segstats', I got the result that there w
as
an obvious difference in left hippocampus, but no difference in right hippocampus. Then, I run segmentation of hippocampus subfields. The result showed there is no difference in total left
or
right hippocampus, and only in two right hippocampus subfields has significant difference. Why
is
there inconsistent result in two means? Thank you very much.
Sincerely, Zheng
Hi Bruce,
My data is loss from 35 to 40. But the uniform of sex is not well from 40 to 55 and from 56 to 71. I did the correlation analysis between age and volume. I don't know how I can explain this problem. Thanks again.
Sincerely, Zheng
At 2017-11-20 09:35:45, "Bruce Fischl" fischl@nmr.mgh.harvard.edu wrote:
Hi Zheng
how uniform is your distribution? I'm hardly an expert on this, but I wouldn't expect very large effects until you get into the older end of that range. Have you scatter plotted your data? Bruce On Mon, 20 Nov 2017, 郑凤莲 wrote:
Hi Bruce,
Thank you for your help. I have 54 subjects, aged from 21 to 71 and only one group. I want to compare the change ofhippocampus volume with age. The results before and after doing the correction for eTIV are the same. Where is wrong? Or if there is no error, how can I explain it in discussion?
Thanks, Zheng
At 2017-11-20 04:55:49, "Bruce Fischl" fischl@nmr.mgh.harvard.edu wrote:
Hi Zheng
yes, I see. Maybe the effect is smaller than you have the power to see, or there is no effect? You would need to give us more details for us to help. Are you correcting for eTIV? What measure are you comparing?
cheers Bruce On Sun, 19 Nov 2017, 郑凤莲 wrote:
Hi Bruce,
I am sorry for this situation. In the first way, there was an statistical difference in left hippocampus, but no differencein
right hippocampus. In the second way, there was both no statistical difference in left or right hippocampus. I don't know what causes this result. Can you understand me this time?
Thanks, Zheng
At 2017-11-18 22:58:56, "Bruce Fischl" fischl@nmr.mgh.harvard.edu wrote:
Hi Zheng
no difference between what and what?
cheers Bruce On Fri, 17 Nov 2017, 郑凤莲 wrote:
Hi professor,
I am using Freesurfer for DTI data. When I run 'mri_segstats', Igot the result that there w
as
an obvious difference in left hippocampus, but no difference in right hippocampus. Then, I run segmentation of hippocampus subfields. The result showed there is no difference in total left
or
right hippocampus, and only in two right hippocampus subfields has significant difference. Why
is
there inconsistent result in two means? Thank you very much.
Sincerely, Zheng
Hi Zheng
I would scatter plot age vs. volume, coloring men and women differently (or different symbols) with and without eTIV correction to get an idea of what is going on
cheers Bruce
On Mon, 20 Nov 2017, 郑凤莲 wrote:
Hi Bruce, My data is loss from 35 to 40. But the uniform of sex is not well from 40 to 55 and from 56 to 71. I did the correlation analysis between age and volume. I don't know how I can explain this problem. Thanks again.
Sincerely, Zheng
At 2017-11-20 09:35:45, "Bruce Fischl" fischl@nmr.mgh.harvard.edu wrote:
Hi Zheng
how uniform is your distribution? I'm hardly an expert on this, but I wouldn't expect very large effects until you get into the older end of that range. Have you scatter plotted your data? Bruce On Mon, 20 Nov 2017, 郑凤莲 wrote:
Hi Bruce,
Thank you for your help. I have 54 subjects, aged from 21 to 71 and only one group. I want to compare the change of hippocampus volume with age. The results before and after doing the correction for eTIV are the same. Where is wrong? Or if there is no error, how can I explain it in discussion?
Thanks, Zheng
At 2017-11-20 04:55:49, "Bruce Fischl" fischl@nmr.mgh.harvard.edu wrote:
Hi Zheng
yes, I see. Maybe the effect is smaller than you have the power to see, or there is no effect? You would need to give us more details for us to help. Are you correcting for eTIV? What measure are you comparing?
cheers Bruce On Sun, 19 Nov 2017, 郑凤莲 wrote:
Hi Bruce,
I am sorry for this situation. In the first way, there was an statistical difference in left hippocampus, but no differe
nce
in
right hippocampus. In the second way, there was both no statistical difference in left or right hippocampus. I don't know what causes this result. Can you understand me this time?
Thanks, Zheng
At 2017-11-18 22:58:56, "Bruce Fischl" fischl@nmr.mgh.harvard.edu wrote:
Hi Zheng
no difference between what and what?
cheers Bruce On Fri, 17 Nov 2017, 郑凤莲 wrote:
> Hi professor, > > I am using Freesurfer for DTI data. When I run 'mri_segstats', I > got the result that there w
as
> an obvious difference in left hippocampus, but no difference in right hippocampus. Then, I
run
> segmentation of hippocampus subfields. The result showed there is no difference in total le
ft
or
> right hippocampus, and only in two right hippocampus subfields has significant difference.
Why
is
> there inconsistent result in two means? > Thank you very much. > > Sincerely, > Zheng > > > > > > >
Hi Bruce,
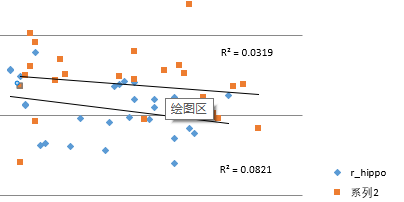
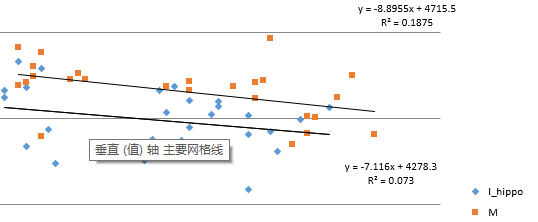
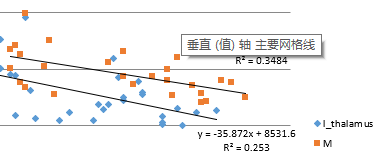
Thanks for your advice. There are a part of the result. Blue color stands women, and Red color stands men. The number of the data is not enough large. Are they ok? May I use them in my paper?
Thanks a lot ! Zheng
At 2017-11-20 10:15:49, "Bruce Fischl" fischl@nmr.mgh.harvard.edu wrote:
Hi Zheng
I would scatter plot age vs. volume, coloring men and women differently (or different symbols) with and without eTIV correction to get an idea of what is going on
cheers Bruce
On Mon, 20 Nov 2017, 郑凤莲 wrote:
Hi Bruce,
My data is loss from 35 to 40. But the uniform of sex is not well from 40 to 55 and from 56 to 71. I did the correlation analysis between age and volume. I don't know how I can explain this problem. Thanks again.
Sincerely, Zheng
At 2017-11-20 09:35:45, "Bruce Fischl" fischl@nmr.mgh.harvard.edu wrote:
Hi Zheng
how uniform is your distribution? I'm hardly an expert on this, but I wouldn't expect very large effects until you get into the older end of that range. Have you scatter plotted your data? Bruce On Mon, 20 Nov 2017, 郑凤莲 wrote:
Hi Bruce,
Thank you for your help. I have 54 subjects, aged from 21 to 71 and only one group. I want to compare the change ofhippocampus volume with age. The results before and after doing the correction for eTIV are the same. Where is wrong? Or if there is no error, how can I explain it in discussion?
Thanks, Zheng
At 2017-11-20 04:55:49, "Bruce Fischl" fischl@nmr.mgh.harvard.edu wrote:
Hi Zheng
yes, I see. Maybe the effect is smaller than you have the power to see, or there is no effect? You would need to give us more details for us to help. Are you correcting for eTIV? What measure are you comparing?
cheers Bruce On Sun, 19 Nov 2017, 郑凤莲 wrote:
Hi Bruce,
I am sorry for this situation. In the first way, there was an statistical difference in left hippocampus, but no difference
in
right hippocampus. In the second way, there was both no statistical difference in left or right hippocampus. I don't know what causes this result. Can you understand me this time?
Thanks, Zheng
At 2017-11-18 22:58:56, "Bruce Fischl" fischl@nmr.mgh.harvard.edu wrote: >Hi Zheng > >no difference between what and what? > >cheers >Bruce >On Fri, 17 Nov 2017, 郑凤莲 wrote: > >> Hi professor, >> >> I am using Freesurfer for DTI data. When I run 'mri_segstats', I >> got the result that there w as >> an obvious difference in left hippocampus, but no difference in right hippocampus. Then, I
run
>> segmentation of hippocampus subfields. The result showed there is no difference in total le
ft
or
>> right hippocampus, and only in two right hippocampus subfields has significant difference.
Why
is
>> there inconsistent result in two means? >> Thank you very much. >> >> Sincerely, >> Zheng >> >> >> >> >> >> >>
is this eTIV corrected? I would look at some of the outliers and make sure that the segmentations are accurate. Certainly the trend is in the correct (and depressing) direction.
cheers Bruce On Wed, 22 Nov 2017, 郑凤莲 wrote:
Hi Bruce,
Thanks for your advice. There are a part of the result. Blue color stands women, and Red color stands men. The number of the data is not enough large. Are they ok? May I use them in my paper? [IMAGE][IMAGE][IMAGE]
Thanks a lot ! Zheng
At 2017-11-20 10:15:49, "Bruce Fischl" fischl@nmr.mgh.harvard.edu wrote:
Hi Zheng
I would scatter plot age vs. volume, coloring men and women differently (or different symbols) with and without eTIV correction to get an idea of what is going on
cheers Bruce
On Mon, 20 Nov 2017, 郑凤莲 wrote:
Hi Bruce, My data is loss from 35 to 40. But the uniform of sex is not well from 40 to 55 and from 56 to 71. I did the correlation analysis between age and volume. I don't know how I can explain this problem. Thanks again.
Sincerely, Zheng
At 2017-11-20 09:35:45, "Bruce Fischl" fischl@nmr.mgh.harvard.edu wrote:
Hi Zheng
how uniform is your distribution? I'm hardly an expert on this, but I wouldn't expect very large effects until you get into the older end of that range. Have you scatter plotted your data? Bruce On Mon, 20 Nov 2017, 郑凤莲 wrote:
Hi Bruce,
Thank you for your help. I have 54 subjects, aged from 21 to 71 and only one group. I want to compare the change o
f
hippocampus volume with age. The results before and after doing the correction for eTIV are th
e
same. Where is wrong? Or if there is no error, how can I explain it in discussion?
Thanks, Zheng
At 2017-11-20 04:55:49, "Bruce Fischl" fischl@nmr.mgh.harvard.edu wrote:
Hi Zheng
yes, I see. Maybe the effect is smaller than you have the power to see, or there is no effect? You would need to give us more details for us to help. Are you correcting for eTIV? What measure are you comparing?
cheers Bruce On Sun, 19 Nov 2017, 郑凤莲 wrote:
> Hi Bruce, > > I am sorry for this situation. > In the first way, there was an statistical difference in left hippocampus, but no diff
ere
nce
in
> right hippocampus. In the second way, there was both no statistical difference in left or > right hippocampus. I don't know what causes this result. > Can you understand me this time? > > Thanks, > Zheng > > > > > At 2017-11-18 22:58:56, "Bruce Fischl" fischl@nmr.mgh.harvard.edu wrote: > >Hi Zheng > > > >no difference between what and what? > > > >cheers > >Bruce > >On Fri, 17 Nov 2017, 郑凤莲 wrote: > > > >> Hi professor, > >> > >> I am using Freesurfer for DTI data. When I run 'mri_segstats', I > >> got the result that there w > as > >> an obvious difference in left hippocampus, but no difference in right hippocampus. Then,
I
run
> >> segmentation of hippocampus subfields. The result showed there is no difference in total
le
ft
or
> >> right hippocampus, and only in two right hippocampus subfields has significant differenc
e.
Why
is
> >> there inconsistent result in two means? > >> Thank you very much. > >> > >> Sincerely, > >> Zheng > >> > >> > >> > >> > >> > >> > >> > > > > > > >
Hi Bruce,
Thanks for your quick reply. These results are not correted by eTIV, If eTIV are corrected, I can only get the p value and scatter plot, I can't get the line trend. Do you know how to get the line trend with eTIV corrected as these results?
Thanks, Zheng
在 2017-11-22 10:14:16,"Bruce Fischl" fischl@nmr.mgh.harvard.edu 写道:
is this eTIV corrected? I would look at some of the outliers and make sure that the segmentations are accurate. Certainly the trend is in the correct (and depressing) direction.
cheers Bruce On Wed, 22 Nov 2017, 郑凤莲 wrote:
Hi Bruce,
Thanks for your advice. There are a part of the result. Blue color stands women, and Red colorstands men. The number of the data is not enough large. Are they ok? May I use them in my paper? [IMAGE][IMAGE][IMAGE]
Thanks a lot ! Zheng
At 2017-11-20 10:15:49, "Bruce Fischl" fischl@nmr.mgh.harvard.edu wrote:
Hi Zheng
I would scatter plot age vs. volume, coloring men and women differently (or different symbols) with and without eTIV correction to get an idea of what is going on
cheers Bruce
On Mon, 20 Nov 2017, 郑凤莲 wrote:
Hi Bruce,
My data is loss from 35 to 40. But the uniform of sex is not well from 40 to 55 and from 56 to 71. I did the correlation analysis between age and volume. I don't know how I can explain this problem. Thanks again.
Sincerely, Zheng
At 2017-11-20 09:35:45, "Bruce Fischl" fischl@nmr.mgh.harvard.edu wrote:
Hi Zheng
how uniform is your distribution? I'm hardly an expert on this, but I wouldn't expect very large effects until you get into the older end of that range. Have you scatter plotted your data? Bruce On Mon, 20 Nov 2017, 郑凤莲 wrote:
Hi Bruce,
Thank you for your help. I have 54 subjects, aged from 21 to 71 and only one group. I want to compare the change of
hippocampus volume with age. The results before and after doing the correction for eTIV are th
e
same. Where is wrong? Or if there is no error, how can I explain it in discussion?
Thanks, Zheng
At 2017-11-20 04:55:49, "Bruce Fischl" fischl@nmr.mgh.harvard.edu wrote: >Hi Zheng > >yes, I see. Maybe the effect is smaller than you have the power to see, or >there is no effect? You would need to give us more details for us to help. >Are you correcting for eTIV? What measure are you comparing? > >cheers >Bruce > On Sun, 19 Nov 2017, 郑凤莲 wrote: > >> Hi Bruce, >> >> I am sorry for this situation. >> In the first way, there was an statistical difference in left hippocampus, but no diff
ere
nce
in >> right hippocampus. In the second way, there was both no statistical difference in left or >> right hippocampus. I don't know what causes this result. >> Can you understand me this time? >> >> Thanks, >> Zheng >> >> >> >> >> At 2017-11-18 22:58:56, "Bruce Fischl" fischl@nmr.mgh.harvard.edu wrote: >> >Hi Zheng >> > >> >no difference between what and what? >> > >> >cheers >> >Bruce >> >On Fri, 17 Nov 2017, 郑凤莲 wrote: >> > >> >> Hi professor, >> >> >> >> I am using Freesurfer for DTI data. When I run 'mri_segstats', I >> >> got the result that there w >> as >> >> an obvious difference in left hippocampus, but no difference in right hippocampus. Then,
I
run
>> >> segmentation of hippocampus subfields. The result showed there is no difference in total
le
ft
or >> >> right hippocampus, and only in two right hippocampus subfields has significant differenc
e.
Why
is >> >> there inconsistent result in two means? >> >> Thank you very much. >> >> >> >> Sincerely, >> >> Zheng >> >> >> >> >> >> >> >> >> >> >> >> >> >> >> >> >> >> >> >> >>
you would include it as a nuisance variable in the glm On Wed, 22 Nov 2017, 郑凤莲 wrote:
Hi Bruce,
Thanks for your quick reply. These results are not correted by eTIV, If eTIV are corrected, I can only get the p value and scatter plot, I can't get the line trend. Do you know how to get the line trend with eTIV corrected as these results?
Thanks, Zheng
在 2017-11-22 10:14:16,"Bruce Fischl" fischl@nmr.mgh.harvard.edu 写道:
is this eTIV corrected? I would look at some of the outliers and make sure that the segmentations are accurate. Certainly the trend is in the correct (and depressing) direction.
cheers Bruce On Wed, 22 Nov 2017, 郑凤莲 wrote:
Hi Bruce,
Thanks for your advice. There are a part of the result. Blue color stands women, and Red colo
r
stands men. The number of the data is not enough large. Are they ok? May I use them in my paper? [IMAGE][IMAGE][IMAGE]
Thanks a lot ! Zheng
At 2017-11-20 10:15:49, "Bruce Fischl" fischl@nmr.mgh.harvard.edu wrote:
Hi Zheng
I would scatter plot age vs. volume, coloring men and women differently (or different symbols) with and without eTIV correction to get an idea of what is going on
cheers Bruce
On Mon, 20 Nov 2017, 郑凤莲 wrote:
Hi Bruce, My data is loss from 35 to 40. But the uniform of sex is not well from 40 to 55 and from 56
to
- I did the correlation analysis between age and volume. I don't know how I can explain this
problem. Thanks again.
Sincerely, Zheng
At 2017-11-20 09:35:45, "Bruce Fischl" fischl@nmr.mgh.harvard.edu wrote:
Hi Zheng
how uniform is your distribution? I'm hardly an expert on this, but I wouldn't expect very large effects until you get into the older end of that range. Have you scatter plotted your data? Bruce On Mon, 20 Nov 2017, 郑凤莲 wrote:
> > Hi Bruce, > > Thank you for your help. > I have 54 subjects, aged from 21 to 71 and only one group. I want to compare the chang
e o
f
> hippocampus volume with age. The results before and after doing the correction for eTIV are
th
e
> same. Where is wrong? Or if there is no error, how can I explain it in discussion? > > Thanks, > Zheng > > > > > > At 2017-11-20 04:55:49, "Bruce Fischl" fischl@nmr.mgh.harvard.edu wrote: > >Hi Zheng > > > >yes, I see. Maybe the effect is smaller than you have the power to see, or > >there is no effect? You would need to give us more details for us to help. > >Are you correcting for eTIV? What measure are you comparing? > > > >cheers > >Bruce > > On Sun, 19 Nov 2017, 郑凤莲 wrote: > > > >> Hi Bruce, > >> > >> I am sorry for this situation. > >> In the first way, there was an statistical difference in left hippocampus, but no d
iff
ere
nce
> in > >> right hippocampus. In the second way, there was both no statistical difference in left o
r
> >> right hippocampus. I don't know what causes this result. > >> Can you understand me this time? > >> > >> Thanks, > >> Zheng > >> > >> > >> > >> > >> At 2017-11-18 22:58:56, "Bruce Fischl" fischl@nmr.mgh.harvard.edu wrote: > >> >Hi Zheng > >> > > >> >no difference between what and what? > >> > > >> >cheers > >> >Bruce > >> >On Fri, 17 Nov 2017, 郑凤莲 wrote: > >> > > >> >> Hi professor, > >> >> > >> >> I am using Freesurfer for DTI data. When I run 'mri_segstats', I > >> >> got the result that there w > >> as > >> >> an obvious difference in left hippocampus, but no difference in right hippocampus. Th
en,
I
run
> >> >> segmentation of hippocampus subfields. The result showed there is no difference in to
tal
le
ft
> or > >> >> right hippocampus, and only in two right hippocampus subfields has significant differ
enc
e.
Why
> is > >> >> there inconsistent result in two means? > >> >> Thank you very much. > >> >> > >> >> Sincerely, > >> >> Zheng > >> >> > >> >> > >> >> > >> >> > >> >> > >> >> > >> >> > >> > >> > >> > >> > >> > >> > >> > > > > > > >
Hi Bruce, Thank you very much. I will try it. And I have another question. I also want to study the relation between age and the whole brain volume, gray matter volume and white matter volume. The whole brain volume is the same as eTIV, is right?
Thanks, Zheng
At 2017-11-22 10:29:43, "Bruce Fischl" fischl@nmr.mgh.harvard.edu wrote:
you would include it as a nuisance variable in the glm On Wed, 22 Nov 2017, 郑凤莲 wrote:
Hi Bruce,
Thanks for your quick reply. These results are not correted by eTIV, If eTIV are corrected, Ican only get the p value and scatter plot, I can't get the line trend. Do you know how to get the line trend with eTIV corrected as these results?
Thanks, Zheng
在 2017-11-22 10:14:16,"Bruce Fischl" fischl@nmr.mgh.harvard.edu 写道:
is this eTIV corrected? I would look at some of the outliers and make sure that the segmentations are accurate. Certainly the trend is in the correct (and depressing) direction.
cheers Bruce On Wed, 22 Nov 2017, 郑凤莲 wrote:
Hi Bruce,
Thanks for your advice. There are a part of the result. Blue color stands women, and Red color
stands men. The number of the data is not enough large. Are they ok? May I use them in my paper? [IMAGE][IMAGE][IMAGE]
Thanks a lot ! Zheng
At 2017-11-20 10:15:49, "Bruce Fischl" fischl@nmr.mgh.harvard.edu wrote:
Hi Zheng
I would scatter plot age vs. volume, coloring men and women differently (or different symbols) with and without eTIV correction to get an idea of what is going on
cheers Bruce
On Mon, 20 Nov 2017, 郑凤莲 wrote:
Hi Bruce,
My data is loss from 35 to 40. But the uniform of sex is not well from 40 to 55 and from 56
to
- I did the correlation analysis between age and volume. I don't know how I can explain this
problem. Thanks again.
Sincerely, Zheng
At 2017-11-20 09:35:45, "Bruce Fischl" fischl@nmr.mgh.harvard.edu wrote: >Hi Zheng > >how uniform is your distribution? I'm hardly an expert on this, but I >wouldn't expect very large effects until you get into the older end of >that range. Have you scatter plotted your data? >Bruce >On Mon, 20 Nov 2017, 郑凤莲 >wrote: > >> >> Hi Bruce, >> >> Thank you for your help. >> I have 54 subjects, aged from 21 to 71 and only one group. I want to compare the chang
e o
f
>> hippocampus volume with age. The results before and after doing the correction for eTIV are
th
e
>> same. Where is wrong? Or if there is no error, how can I explain it in discussion? >> >> Thanks, >> Zheng >> >> >> >> >> >> At 2017-11-20 04:55:49, "Bruce Fischl" fischl@nmr.mgh.harvard.edu wrote: >> >Hi Zheng >> > >> >yes, I see. Maybe the effect is smaller than you have the power to see, or >> >there is no effect? You would need to give us more details for us to help. >> >Are you correcting for eTIV? What measure are you comparing? >> > >> >cheers >> >Bruce >> > On Sun, 19 Nov 2017, 郑凤莲 wrote: >> > >> >> Hi Bruce, >> >> >> >> I am sorry for this situation. >> >> In the first way, there was an statistical difference in left hippocampus, but no d
iff
ere
nce >> in >> >> right hippocampus. In the second way, there was both no statistical difference in left o
r
>> >> right hippocampus. I don't know what causes this result. >> >> Can you understand me this time? >> >> >> >> Thanks, >> >> Zheng >> >> >> >> >> >> >> >> >> >> At 2017-11-18 22:58:56, "Bruce Fischl" fischl@nmr.mgh.harvard.edu wrote: >> >> >Hi Zheng >> >> > >> >> >no difference between what and what? >> >> > >> >> >cheers >> >> >Bruce >> >> >On Fri, 17 Nov 2017, 郑凤莲 wrote: >> >> > >> >> >> Hi professor, >> >> >> >> >> >> I am using Freesurfer for DTI data. When I run 'mri_segstats', I >> >> >> got the result that there w >> >> as >> >> >> an obvious difference in left hippocampus, but no difference in right hippocampus. Th
en,
I
run >> >> >> segmentation of hippocampus subfields. The result showed there is no difference in to
tal
le
ft >> or >> >> >> right hippocampus, and only in two right hippocampus subfields has significant differ
enc
e.
Why >> is >> >> >> there inconsistent result in two means? >> >> >> Thank you very much. >> >> >> >> >> >> Sincerely, >> >> >> Zheng >> >> >> >> >> >> >> >> >> >> >> >> >> >> >> >> >> >> >> >> >> >> >> >> >> >> >> >> >> >> >> >> >> >> >> >> >> >> >> >> >> >>
no, eTIV is the estimated volume of the intracranial vault, so it included sulcal CSF. I think we include a whole brain volume in the aseg.stats file that you can use, although I don't remember what it's called
cheers Bruce On Wed, 22 Nov 2017, 郑凤莲 wrote:
Hi Bruce, Thank you very much. I will try it. And I have another question. I also want to study the relation between age and the whole brain volume, gray matter volume and white matter volume. The whole brain volume is the same as eTIV, is right?
Thanks, Zheng
At 2017-11-22 10:29:43, "Bruce Fischl" fischl@nmr.mgh.harvard.edu wrote:
you would include it as a nuisance variable in the glm On Wed, 22 Nov 2017, 郑凤莲 wrote:
Hi Bruce,
Thanks for your quick reply. These results are not correted by eTIV, If eTIV are corrected,
I
can only get the p value and scatter plot, I can't get the line trend. Do you know how to get the line trend with eTIV corrected as these results?
Thanks, Zheng
在 2017-11-22 10:14:16,"Bruce Fischl" fischl@nmr.mgh.harvard.edu 写道:
is this eTIV corrected? I would look at some of the outliers and make sure that the segmentations are accurate. Certainly the trend is in the correct (and depressing) direction.
cheers Bruce On Wed, 22 Nov 2017, 郑凤莲 wrote:
Hi Bruce,
Thanks for your advice. There are a part of the result. Blue color stands women, and Red c
olo
r
stands men. The number of the data is not enough large. Are they ok? May I use them in my paper? [IMAGE][IMAGE][IMAGE]
Thanks a lot ! Zheng
At 2017-11-20 10:15:49, "Bruce Fischl" fischl@nmr.mgh.harvard.edu wrote:
Hi Zheng
I would scatter plot age vs. volume, coloring men and women differently (or different symbols) with and without eTIV correction to get an idea of what is going on
cheers Bruce
On Mon, 20 Nov 2017, 郑凤莲 wrote:
> Hi Bruce, > > My data is loss from 35 to 40. But the uniform of sex is not well from 40 to 55 and from
56
to
> 71. I did the correlation analysis between age and volume. I don't know how I can explain t
his
> problem. > Thanks again. > > Sincerely, > Zheng > > > > > > At 2017-11-20 09:35:45, "Bruce Fischl" fischl@nmr.mgh.harvard.edu wrote: > >Hi Zheng > > > >how uniform is your distribution? I'm hardly an expert on this, but I > >wouldn't expect very large effects until you get into the older end of > >that range. Have you scatter plotted your data? > >Bruce > >On Mon, 20 Nov 2017, 郑凤莲 > >wrote: > > > >> > >> Hi Bruce, > >> > >> Thank you for your help. > >> I have 54 subjects, aged from 21 to 71 and only one group. I want to compare the ch
ang
e o
f
> >> hippocampus volume with age. The results before and after doing the correction for eTIV
are
th
e
> >> same. Where is wrong? Or if there is no error, how can I explain it in discussion? > >> > >> Thanks, > >> Zheng > >> > >> > >> > >> > >> > >> At 2017-11-20 04:55:49, "Bruce Fischl" fischl@nmr.mgh.harvard.edu wrote: > >> >Hi Zheng > >> > > >> >yes, I see. Maybe the effect is smaller than you have the power to see, or > >> >there is no effect? You would need to give us more details for us to help. > >> >Are you correcting for eTIV? What measure are you comparing? > >> > > >> >cheers > >> >Bruce > >> > On Sun, 19 Nov 2017, 郑凤莲 wrote: > >> > > >> >> Hi Bruce, > >> >> > >> >> I am sorry for this situation. > >> >> In the first way, there was an statistical difference in left hippocampus, but n
o d
iff
ere
> nce > >> in > >> >> right hippocampus. In the second way, there was both no statistical difference in lef
t o
r
> >> >> right hippocampus. I don't know what causes this result. > >> >> Can you understand me this time? > >> >> > >> >> Thanks, > >> >> Zheng > >> >> > >> >> > >> >> > >> >> > >> >> At 2017-11-18 22:58:56, "Bruce Fischl" fischl@nmr.mgh.harvard.edu wrote: > >> >> >Hi Zheng > >> >> > > >> >> >no difference between what and what? > >> >> > > >> >> >cheers > >> >> >Bruce > >> >> >On Fri, 17 Nov 2017, 郑凤莲 wrote: > >> >> > > >> >> >> Hi professor, > >> >> >> > >> >> >> I am using Freesurfer for DTI data. When I run 'mri_segstats', I > >> >> >> got the result that there w > >> >> as > >> >> >> an obvious difference in left hippocampus, but no difference in right hippocampus.
Th
en,
I
> run > >> >> >> segmentation of hippocampus subfields. The result showed there is no difference in
to
tal
le
> ft > >> or > >> >> >> right hippocampus, and only in two right hippocampus subfields has significant dif
fer
enc
e.
> Why > >> is > >> >> >> there inconsistent result in two means? > >> >> >> Thank you very much. > >> >> >> > >> >> >> Sincerely, > >> >> >> Zheng > >> >> >> > >> >> >> > >> >> >> > >> >> >> > >> >> >> > >> >> >> > >> >> >> > >> >> > >> >> > >> >> > >> >> > >> >> > >> >> > >> >> > >> > >> > >> > >> > >> > >> > >> > > > > > > >
Hi Bruce,
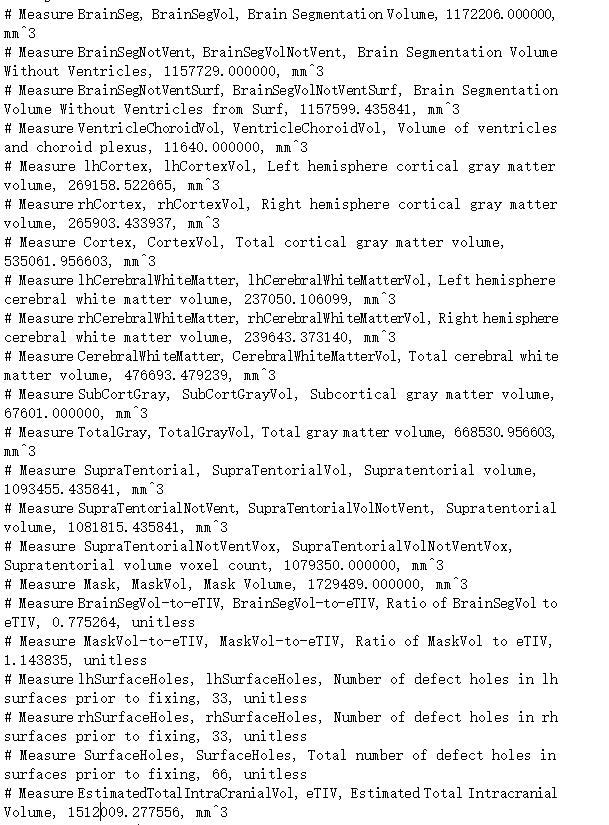
There is aseg.stats. Is it brain segmentation volume?
And in QDEC, I study the relationship between age and the cortical thickness, volume and surface area. The eTIV for volume and surface area should be set in Nuisance Factors, but for thickness, it's not need. Is right?
Thanks, Zheng
At 2017-11-22 11:07:36, "Bruce Fischl" fischl@nmr.mgh.harvard.edu wrote:
no, eTIV is the estimated volume of the intracranial vault, so it included sulcal CSF. I think we include a whole brain volume in the aseg.stats file that you can use, although I don't remember what it's called
cheers Bruce On Wed, 22 Nov 2017, 郑凤莲 wrote:
Hi Bruce, Thank you very much. I will try it. And I have another question. I also want to study the relation between age and the whole brain volume, gray matter volume and white matter volume. The whole brain volume is the same as eTIV, is right?
Thanks, Zheng
At 2017-11-22 10:29:43, "Bruce Fischl" fischl@nmr.mgh.harvard.edu wrote:
you would include it as a nuisance variable in the glm On Wed, 22 Nov 2017, 郑凤莲 wrote:
Hi Bruce,
Thanks for your quick reply. These results are not correted by eTIV, If eTIV are corrected,I
can only get the p value and scatter plot, I can't get the line trend. Do you know how to get the line trend with eTIV corrected as these results?
Thanks, Zheng
在 2017-11-22 10:14:16,"Bruce Fischl" fischl@nmr.mgh.harvard.edu 写道:
is this eTIV corrected? I would look at some of the outliers and make sure that the segmentations are accurate. Certainly the trend is in the correct (and depressing) direction.
cheers Bruce On Wed, 22 Nov 2017, 郑凤莲 wrote:
Hi Bruce,
Thanks for your advice. There are a part of the result. Blue color stands women, and Red colo
r
stands men. The number of the data is not enough large. Are they ok? May I use them in my paper? [IMAGE][IMAGE][IMAGE]
Thanks a lot ! Zheng
At 2017-11-20 10:15:49, "Bruce Fischl" fischl@nmr.mgh.harvard.edu wrote: >Hi Zheng > >I would scatter plot age vs. volume, coloring men and women differently >(or different symbols) with and without eTIV correction to get an idea of >what is going on > >cheers >Bruce > > >On Mon, 20 Nov >2017, 郑凤莲 wrote: > >> Hi Bruce, >> >> My data is loss from 35 to 40. But the uniform of sex is not well from 40 to 55 and from
56
to
>> 71. I did the correlation analysis between age and volume. I don't know how I can explain t
his
>> problem. >> Thanks again. >> >> Sincerely, >> Zheng >> >> >> >> >> >> At 2017-11-20 09:35:45, "Bruce Fischl" fischl@nmr.mgh.harvard.edu wrote: >> >Hi Zheng >> > >> >how uniform is your distribution? I'm hardly an expert on this, but I >> >wouldn't expect very large effects until you get into the older end of >> >that range. Have you scatter plotted your data? >> >Bruce >> >On Mon, 20 Nov 2017, 郑凤莲 >> >wrote: >> > >> >> >> >> Hi Bruce, >> >> >> >> Thank you for your help. >> >> I have 54 subjects, aged from 21 to 71 and only one group. I want to compare the ch
ang
e o
f >> >> hippocampus volume with age. The results before and after doing the correction for eTIV
are
th
e >> >> same. Where is wrong? Or if there is no error, how can I explain it in discussion? >> >> >> >> Thanks, >> >> Zheng >> >> >> >> >> >> >> >> >> >> >> >> At 2017-11-20 04:55:49, "Bruce Fischl" fischl@nmr.mgh.harvard.edu wrote: >> >> >Hi Zheng >> >> > >> >> >yes, I see. Maybe the effect is smaller than you have the power to see, or >> >> >there is no effect? You would need to give us more details for us to help. >> >> >Are you correcting for eTIV? What measure are you comparing? >> >> > >> >> >cheers >> >> >Bruce >> >> > On Sun, 19 Nov 2017, 郑凤莲 wrote: >> >> > >> >> >> Hi Bruce, >> >> >> >> >> >> I am sorry for this situation. >> >> >> In the first way, there was an statistical difference in left hippocampus, but n
o d
iff
ere >> nce >> >> in >> >> >> right hippocampus. In the second way, there was both no statistical difference in lef
t o
r
>> >> >> right hippocampus. I don't know what causes this result. >> >> >> Can you understand me this time? >> >> >> >> >> >> Thanks, >> >> >> Zheng >> >> >> >> >> >> >> >> >> >> >> >> >> >> >> At 2017-11-18 22:58:56, "Bruce Fischl" fischl@nmr.mgh.harvard.edu wrote: >> >> >> >Hi Zheng >> >> >> > >> >> >> >no difference between what and what? >> >> >> > >> >> >> >cheers >> >> >> >Bruce >> >> >> >On Fri, 17 Nov 2017, 郑凤莲 wrote: >> >> >> > >> >> >> >> Hi professor, >> >> >> >> >> >> >> >> I am using Freesurfer for DTI data. When I run 'mri_segstats', I >> >> >> >> got the result that there w >> >> >> as >> >> >> >> an obvious difference in left hippocampus, but no difference in right hippocampus.
Th
en,
I >> run >> >> >> >> segmentation of hippocampus subfields. The result showed there is no difference in
to
tal
le >> ft >> >> or >> >> >> >> right hippocampus, and only in two right hippocampus subfields has significant dif
fer
enc
e. >> Why >> >> is >> >> >> >> there inconsistent result in two means? >> >> >> >> Thank you very much. >> >> >> >> >> >> >> >> Sincerely, >> >> >> >> Zheng >> >> >> >> >> >> >> >> >> >> >> >> >> >> >> >> >> >> >> >> >> >> >> >> >> >> >> >> >> >> >> >> >> >> >> >> >> >> >> >> >> >> >> >> >> >> >> >> >> >> >> >> >> >> >> >> >> >> >> >> >> >> >> >> >> >> >> >> >> >>
Hi Bruce,
Could tell me which is the whole brain volume,please? I'm not sure which is right. I need your help.
Thanks very much. Zheng
At 2017-11-22 11:07:36, "Bruce Fischl" fischl@nmr.mgh.harvard.edu wrote:
no, eTIV is the estimated volume of the intracranial vault, so it included sulcal CSF. I think we include a whole brain volume in the aseg.stats file that you can use, although I don't remember what it's called
cheers Bruce On Wed, 22 Nov 2017, 郑凤莲 wrote:
Hi Bruce, Thank you very much. I will try it. And I have another question. I also want to study the relation between age and the whole brain volume, gray matter volume and white matter volume. The whole brain volume is the same as eTIV, is right?
Thanks, Zheng
At 2017-11-22 10:29:43, "Bruce Fischl" fischl@nmr.mgh.harvard.edu wrote:
you would include it as a nuisance variable in the glm On Wed, 22 Nov 2017, 郑凤莲 wrote:
Hi Bruce,
Thanks for your quick reply. These results are not correted by eTIV, If eTIV are corrected,I
can only get the p value and scatter plot, I can't get the line trend. Do you know how to get the line trend with eTIV corrected as these results?
Thanks, Zheng
在 2017-11-22 10:14:16,"Bruce Fischl" fischl@nmr.mgh.harvard.edu 写道:
is this eTIV corrected? I would look at some of the outliers and make sure that the segmentations are accurate. Certainly the trend is in the correct (and depressing) direction.
cheers Bruce On Wed, 22 Nov 2017, 郑凤莲 wrote:
Hi Bruce,
Thanks for your advice. There are a part of the result. Blue color stands women, and Red colo
r
stands men. The number of the data is not enough large. Are they ok? May I use them in my paper? [IMAGE][IMAGE][IMAGE]
Thanks a lot ! Zheng
At 2017-11-20 10:15:49, "Bruce Fischl" fischl@nmr.mgh.harvard.edu wrote: >Hi Zheng > >I would scatter plot age vs. volume, coloring men and women differently >(or different symbols) with and without eTIV correction to get an idea of >what is going on > >cheers >Bruce > > >On Mon, 20 Nov >2017, 郑凤莲 wrote: > >> Hi Bruce, >> >> My data is loss from 35 to 40. But the uniform of sex is not well from 40 to 55 and from
56
to
>> 71. I did the correlation analysis between age and volume. I don't know how I can explain t
his
>> problem. >> Thanks again. >> >> Sincerely, >> Zheng >> >> >> >> >> >> At 2017-11-20 09:35:45, "Bruce Fischl" fischl@nmr.mgh.harvard.edu wrote: >> >Hi Zheng >> > >> >how uniform is your distribution? I'm hardly an expert on this, but I >> >wouldn't expect very large effects until you get into the older end of >> >that range. Have you scatter plotted your data? >> >Bruce >> >On Mon, 20 Nov 2017, 郑凤莲 >> >wrote: >> > >> >> >> >> Hi Bruce, >> >> >> >> Thank you for your help. >> >> I have 54 subjects, aged from 21 to 71 and only one group. I want to compare the ch
ang
e o
f >> >> hippocampus volume with age. The results before and after doing the correction for eTIV
are
th
e >> >> same. Where is wrong? Or if there is no error, how can I explain it in discussion? >> >> >> >> Thanks, >> >> Zheng >> >> >> >> >> >> >> >> >> >> >> >> At 2017-11-20 04:55:49, "Bruce Fischl" fischl@nmr.mgh.harvard.edu wrote: >> >> >Hi Zheng >> >> > >> >> >yes, I see. Maybe the effect is smaller than you have the power to see, or >> >> >there is no effect? You would need to give us more details for us to help. >> >> >Are you correcting for eTIV? What measure are you comparing? >> >> > >> >> >cheers >> >> >Bruce >> >> > On Sun, 19 Nov 2017, 郑凤莲 wrote: >> >> > >> >> >> Hi Bruce, >> >> >> >> >> >> I am sorry for this situation. >> >> >> In the first way, there was an statistical difference in left hippocampus, but n
o d
iff
ere >> nce >> >> in >> >> >> right hippocampus. In the second way, there was both no statistical difference in lef
t o
r
>> >> >> right hippocampus. I don't know what causes this result. >> >> >> Can you understand me this time? >> >> >> >> >> >> Thanks, >> >> >> Zheng >> >> >> >> >> >> >> >> >> >> >> >> >> >> >> At 2017-11-18 22:58:56, "Bruce Fischl" fischl@nmr.mgh.harvard.edu wrote: >> >> >> >Hi Zheng >> >> >> > >> >> >> >no difference between what and what? >> >> >> > >> >> >> >cheers >> >> >> >Bruce >> >> >> >On Fri, 17 Nov 2017, 郑凤莲 wrote: >> >> >> > >> >> >> >> Hi professor, >> >> >> >> >> >> >> >> I am using Freesurfer for DTI data. When I run 'mri_segstats', I >> >> >> >> got the result that there w >> >> >> as >> >> >> >> an obvious difference in left hippocampus, but no difference in right hippocampus.
Th
en,
I >> run >> >> >> >> segmentation of hippocampus subfields. The result showed there is no difference in
to
tal
le >> ft >> >> or >> >> >> >> right hippocampus, and only in two right hippocampus subfields has significant dif
fer
enc
e. >> Why >> >> is >> >> >> >> there inconsistent result in two means? >> >> >> >> Thank you very much. >> >> >> >> >> >> >> >> Sincerely, >> >> >> >> Zheng >> >> >> >> >> >> >> >> >> >> >> >> >> >> >> >> >> >> >> >> >> >> >> >> >> >> >> >> >> >> >> >> >> >> >> >> >> >> >> >> >> >> >> >> >> >> >> >> >> >> >> >> >> >> >> >> >> >> >> >> >> >> >> >> >> >> >> >> >> >>
Sorry, I don’t remember. You can search on the wiki or maybe someone else will chime in Bruce
On Nov 22, 2017, at 8:30 PM, 郑凤莲 13181786167@163.com wrote:
Hi Bruce,
Could tell me which is the whole brain volume,please? I'm not sure which is right. I need your help.Thanks very much. Zheng
At 2017-11-22 11:07:36, "Bruce Fischl" fischl@nmr.mgh.harvard.edu wrote:
no, eTIV is the estimated volume of the intracranial vault, so it included sulcal CSF. I think we include a whole brain volume in the aseg.stats file that you can use, although I don't remember what it's called
cheers Bruce On Wed, 22 Nov 2017, 郑凤莲 wrote:
Hi Bruce, Thank you very much. I will try it. And I have another question. I also want to study the relation between age and the whole brain volume, gray matter volume and white matter volume. The whole brain volume is the same as eTIV, is right?
Thanks, Zheng
At 2017-11-22 10:29:43, "Bruce Fischl" fischl@nmr.mgh.harvard.edu wrote:
you would include it as a nuisance variable in the glm On Wed, 22 Nov 2017, 郑凤莲 wrote:
Hi Bruce,
Thanks for your quick reply. These results are not correted by eTIV, If eTIV are corrected,I
can only get the p value and scatter plot, I can't get the line trend. Do you know how to get the line trend with eTIV corrected as these results?
Thanks, Zheng
在 2017-11-22 10:14:16,"Bruce Fischl" fischl@nmr.mgh.harvard.edu 写道:
is this eTIV corrected? I would look at some of the outliers and make sure that the segmentations are accurate. Certainly the trend is in the correct (and depressing) direction.
cheers Bruce On Wed, 22 Nov 2017, 郑凤莲 wrote:
> Hi Bruce, > > Thanks for your advice. There are a part of the result. Blue color stands women, and Red c
olo
r
> stands men. > The number of the data is not enough large. Are they ok? May I use them in my paper? > [IMAGE][IMAGE][IMAGE] > > > Thanks a lot ! > Zheng > > > > > At 2017-11-20 10:15:49, "Bruce Fischl" fischl@nmr.mgh.harvard.edu wrote: > >Hi Zheng > > > >I would scatter plot age vs. volume, coloring men and women differently > >(or different symbols) with and without eTIV correction to get an idea of > >what is going on > > > >cheers > >Bruce > > > > > >On Mon, 20 Nov > >2017, 郑凤莲 wrote: > > > >> Hi Bruce, > >> > >> My data is loss from 35 to 40. But the uniform of sex is not well from 40 to 55 and from
56
to
> >> 71. I did the correlation analysis between age and volume. I don't know how I can explain t
his
> >> problem. > >> Thanks again. > >> > >> Sincerely, > >> Zheng > >> > >> > >> > >> > >> > >> At 2017-11-20 09:35:45, "Bruce Fischl" fischl@nmr.mgh.harvard.edu wrote: > >> >Hi Zheng > >> > > >> >how uniform is your distribution? I'm hardly an expert on this, but I > >> >wouldn't expect very large effects until you get into the older end of > >> >that range. Have you scatter plotted your data? > >> >Bruce > >> >On Mon, 20 Nov 2017, 郑凤莲 > >> >wrote: > >> > > >> >> > >> >> Hi Bruce, > >> >> > >> >> Thank you for your help. > >> >> I have 54 subjects, aged from 21 to 71 and only one group. I want to compare the ch
ang
e o
> f > >> >> hippocampus volume with age. The results before and after doing the correction for eTIV
are
th
> e > >> >> same. Where is wrong? Or if there is no error, how can I explain it in discussion? > >> >> > >> >> Thanks, > >> >> Zheng > >> >> > >> >> > >> >> > >> >> > >> >> > >> >> At 2017-11-20 04:55:49, "Bruce Fischl" fischl@nmr.mgh.harvard.edu wrote: > >> >> >Hi Zheng > >> >> > > >> >> >yes, I see. Maybe the effect is smaller than you have the power to see, or > >> >> >there is no effect? You would need to give us more details for us to help. > >> >> >Are you correcting for eTIV? What measure are you comparing? > >> >> > > >> >> >cheers > >> >> >Bruce > >> >> > On Sun, 19 Nov 2017, 郑凤莲 wrote: > >> >> > > >> >> >> Hi Bruce, > >> >> >> > >> >> >> I am sorry for this situation. > >> >> >> In the first way, there was an statistical difference in left hippocampus, but n
o d
iff
> ere > >> nce > >> >> in > >> >> >> right hippocampus. In the second way, there was both no statistical difference in lef
t o
r
> >> >> >> right hippocampus. I don't know what causes this result. > >> >> >> Can you understand me this time? > >> >> >> > >> >> >> Thanks, > >> >> >> Zheng > >> >> >> > >> >> >> > >> >> >> > >> >> >> > >> >> >> At 2017-11-18 22:58:56, "Bruce Fischl" fischl@nmr.mgh.harvard.edu wrote: > >> >> >> >Hi Zheng > >> >> >> > > >> >> >> >no difference between what and what? > >> >> >> > > >> >> >> >cheers > >> >> >> >Bruce > >> >> >> >On Fri, 17 Nov 2017, 郑凤莲 wrote: > >> >> >> > > >> >> >> >> Hi professor, > >> >> >> >> > >> >> >> >> I am using Freesurfer for DTI data. When I run 'mri_segstats', I > >> >> >> >> got the result that there w > >> >> >> as > >> >> >> >> an obvious difference in left hippocampus, but no difference in right hippocampus.
Th
en,
> I > >> run > >> >> >> >> segmentation of hippocampus subfields. The result showed there is no difference in
to
tal
> le > >> ft > >> >> or > >> >> >> >> right hippocampus, and only in two right hippocampus subfields has significant dif
fer
enc
> e. > >> Why > >> >> is > >> >> >> >> there inconsistent result in two means? > >> >> >> >> Thank you very much. > >> >> >> >> > >> >> >> >> Sincerely, > >> >> >> >> Zheng > >> >> >> >> > >> >> >> >> > >> >> >> >> > >> >> >> >> > >> >> >> >> > >> >> >> >> > >> >> >> >> > >> >> >> > >> >> >> > >> >> >> > >> >> >> > >> >> >> > >> >> >> > >> >> >> > >> >> > >> >> > >> >> > >> >> > >> >> > >> >> > >> >> > >> > >> > >> > >> > >> > >> > >> > > > > > > >
Freesurfer mailing list Freesurfer@nmr.mgh.harvard.edu https://mail.nmr.mgh.harvard.edu/mailman/listinfo/freesurfer
Hi Bruce, It's OK. Thank you very much for your reply ! I will find it in other way.
Sincerely, Zheng
At 2017-11-23 11:37:37, "Bruce Fischl" fischl@nmr.mgh.harvard.edu wrote:
Sorry, I don’t remember. You can search on the wiki or maybe someone else will chime in Bruce
On Nov 22, 2017, at 8:30 PM, 郑凤莲 13181786167@163.com wrote:
Hi Bruce,
Could tell me which is the whole brain volume,please? I'm not sure which is right. I need your help.
Thanks very much. Zheng
At 2017-11-22 11:07:36, "Bruce Fischl" fischl@nmr.mgh.harvard.edu wrote:
no, eTIV is the estimated volume of the intracranial vault, so it included sulcal CSF. I think we include a whole brain volume in the aseg.stats file that you can use, although I don't remember what it's called
cheers Bruce On Wed, 22 Nov 2017, 郑凤莲 wrote:
Hi Bruce, Thank you very much. I will try it. And I have another question. I also want to study the relation between age and the whole brain volume, gray matter volume and white matter volume. The whole brain volume is the same as eTIV, is right?
Thanks, Zheng
At 2017-11-22 10:29:43, "Bruce Fischl" fischl@nmr.mgh.harvard.edu wrote:
you would include it as a nuisance variable in the glm On Wed, 22 Nov 2017, 郑凤莲 wrote:
Hi Bruce,
Thanks for your quick reply. These results are not correted by eTIV, If eTIV are corrected,I
can only get the p value and scatter plot, I can't get the line trend. Do you know how to get the line trend with eTIV corrected as these results?
Thanks, Zheng
在 2017-11-22 10:14:16,"Bruce Fischl" fischl@nmr.mgh.harvard.edu 写道:
is this eTIV corrected? I would look at some of the outliers and make sure that the segmentations are accurate. Certainly the trend is in the correct (and depressing) direction.
cheers Bruce On Wed, 22 Nov 2017, 郑凤莲 wrote:
Hi Bruce,
Thanks for your advice. There are a part of the result. Blue color stands women, and Red colo
r
stands men. The number of the data is not enough large. Are they ok? May I use them in my paper? [IMAGE][IMAGE][IMAGE]
Thanks a lot ! Zheng
At 2017-11-20 10:15:49, "Bruce Fischl" fischl@nmr.mgh.harvard.edu wrote: >Hi Zheng > >I would scatter plot age vs. volume, coloring men and women differently >(or different symbols) with and without eTIV correction to get an idea of >what is going on > >cheers >Bruce > > >On Mon, 20 Nov >2017, 郑凤莲 wrote: > >> Hi Bruce, >> >> My data is loss from 35 to 40. But the uniform of sex is not well from 40 to 55 and from
56
to
>> 71. I did the correlation analysis between age and volume. I don't know how I can explain t
his
>> problem. >> Thanks again. >> >> Sincerely, >> Zheng >> >> >> >> >> >> At 2017-11-20 09:35:45, "Bruce Fischl" fischl@nmr.mgh.harvard.edu wrote: >> >Hi Zheng >> > >> >how uniform is your distribution? I'm hardly an expert on this, but I >> >wouldn't expect very large effects until you get into the older end of >> >that range. Have you scatter plotted your data? >> >Bruce >> >On Mon, 20 Nov 2017, 郑凤莲 >> >wrote: >> > >> >> >> >> Hi Bruce, >> >> >> >> Thank you for your help. >> >> I have 54 subjects, aged from 21 to 71 and only one group. I want to compare the ch
ang
e o
f >> >> hippocampus volume with age. The results before and after doing the correction for eTIV
are
th
e >> >> same. Where is wrong? Or if there is no error, how can I explain it in discussion? >> >> >> >> Thanks, >> >> Zheng >> >> >> >> >> >> >> >> >> >> >> >> At 2017-11-20 04:55:49, "Bruce Fischl" fischl@nmr.mgh.harvard.edu wrote: >> >> >Hi Zheng >> >> > >> >> >yes, I see. Maybe the effect is smaller than you have the power to see, or >> >> >there is no effect? You would need to give us more details for us to help. >> >> >Are you correcting for eTIV? What measure are you comparing? >> >> > >> >> >cheers >> >> >Bruce >> >> > On Sun, 19 Nov 2017, 郑凤莲 wrote: >> >> > >> >> >> Hi Bruce, >> >> >> >> >> >> I am sorry for this situation. >> >> >> In the first way, there was an statistical difference in left hippocampus, but n
o d
iff
ere >> nce >> >> in >> >> >> right hippocampus. In the second way, there was both no statistical difference in lef
t o
r
>> >> >> right hippocampus. I don't know what causes this result. >> >> >> Can you understand me this time? >> >> >> >> >> >> Thanks, >> >> >> Zheng >> >> >> >> >> >> >> >> >> >> >> >> >> >> >> At 2017-11-18 22:58:56, "Bruce Fischl" fischl@nmr.mgh.harvard.edu wrote: >> >> >> >Hi Zheng >> >> >> > >> >> >> >no difference between what and what? >> >> >> > >> >> >> >cheers >> >> >> >Bruce >> >> >> >On Fri, 17 Nov 2017, 郑凤莲 wrote: >> >> >> > >> >> >> >> Hi professor, >> >> >> >> >> >> >> >> I am using Freesurfer for DTI data. When I run 'mri_segstats', I >> >> >> >> got the result that there w >> >> >> as >> >> >> >> an obvious difference in left hippocampus, but no difference in right hippocampus.
Th
en,
I >> run >> >> >> >> segmentation of hippocampus subfields. The result showed there is no difference in
to
tal
le >> ft >> >> or >> >> >> >> right hippocampus, and only in two right hippocampus subfields has significant dif
fer
enc
e. >> Why >> >> is >> >> >> >> there inconsistent result in two means? >> >> >> >> Thank you very much. >> >> >> >> >> >> >> >> Sincerely, >> >> >> >> Zheng >> >> >> >> >> >> >> >> >> >> >> >> >> >> >> >> >> >> >> >> >> >> >> >> >> >> >> >> >> >> >> >> >> >> >> >> >> >> >> >> >> >> >> >> >> >> >> >> >> >> >> >> >> >> >> >> >> >> >> >> >> >> >> >> >> >> >> >> >> >>
_______________________________________________ Freesurfer mailing list Freesurfer@nmr.mgh.harvard.edu https://mail.nmr.mgh.harvard.edu/mailman/listinfo/freesurfer
Hi Bruce,
I am sorry for asking you question as this, but I really don't know how to do it? It seems that GLM is suitable for there are two groups or more. But I only have one group, If I want to get the line trend with eTIV corrected for the relationship between age and volume, what should I do? The picture is my result, but it doesn't corrected by eTIV. I appreciate your help, please.
Thanks a lot! Zheng
At 2017-11-22 10:29:43, "Bruce Fischl" fischl@nmr.mgh.harvard.edu wrote:
you would include it as a nuisance variable in the glm On Wed, 22 Nov 2017, 郑凤莲 wrote:
Hi Bruce,
Thanks for your quick reply. These results are not correted by eTIV, If eTIV are corrected, Ican only get the p value and scatter plot, I can't get the line trend. Do you know how to get the line trend with eTIV corrected as these results?
Thanks, Zheng
在 2017-11-22 10:14:16,"Bruce Fischl" fischl@nmr.mgh.harvard.edu 写道:
is this eTIV corrected? I would look at some of the outliers and make sure that the segmentations are accurate. Certainly the trend is in the correct (and depressing) direction.
cheers Bruce On Wed, 22 Nov 2017, 郑凤莲 wrote:
Hi Bruce,
Thanks for your advice. There are a part of the result. Blue color stands women, and Red color
stands men. The number of the data is not enough large. Are they ok? May I use them in my paper? [IMAGE][IMAGE][IMAGE]
Thanks a lot ! Zheng
At 2017-11-20 10:15:49, "Bruce Fischl" fischl@nmr.mgh.harvard.edu wrote:
Hi Zheng
I would scatter plot age vs. volume, coloring men and women differently (or different symbols) with and without eTIV correction to get an idea of what is going on
cheers Bruce
On Mon, 20 Nov 2017, 郑凤莲 wrote:
Hi Bruce,
My data is loss from 35 to 40. But the uniform of sex is not well from 40 to 55 and from 56
to
- I did the correlation analysis between age and volume. I don't know how I can explain this
problem. Thanks again.
Sincerely, Zheng
At 2017-11-20 09:35:45, "Bruce Fischl" fischl@nmr.mgh.harvard.edu wrote: >Hi Zheng > >how uniform is your distribution? I'm hardly an expert on this, but I >wouldn't expect very large effects until you get into the older end of >that range. Have you scatter plotted your data? >Bruce >On Mon, 20 Nov 2017, 郑凤莲 >wrote: > >> >> Hi Bruce, >> >> Thank you for your help. >> I have 54 subjects, aged from 21 to 71 and only one group. I want to compare the chang
e o
f
>> hippocampus volume with age. The results before and after doing the correction for eTIV are
th
e
>> same. Where is wrong? Or if there is no error, how can I explain it in discussion? >> >> Thanks, >> Zheng >> >> >> >> >> >> At 2017-11-20 04:55:49, "Bruce Fischl" fischl@nmr.mgh.harvard.edu wrote: >> >Hi Zheng >> > >> >yes, I see. Maybe the effect is smaller than you have the power to see, or >> >there is no effect? You would need to give us more details for us to help. >> >Are you correcting for eTIV? What measure are you comparing? >> > >> >cheers >> >Bruce >> > On Sun, 19 Nov 2017, 郑凤莲 wrote: >> > >> >> Hi Bruce, >> >> >> >> I am sorry for this situation. >> >> In the first way, there was an statistical difference in left hippocampus, but no d
iff
ere
nce >> in >> >> right hippocampus. In the second way, there was both no statistical difference in left o
r
>> >> right hippocampus. I don't know what causes this result. >> >> Can you understand me this time? >> >> >> >> Thanks, >> >> Zheng >> >> >> >> >> >> >> >> >> >> At 2017-11-18 22:58:56, "Bruce Fischl" fischl@nmr.mgh.harvard.edu wrote: >> >> >Hi Zheng >> >> > >> >> >no difference between what and what? >> >> > >> >> >cheers >> >> >Bruce >> >> >On Fri, 17 Nov 2017, 郑凤莲 wrote: >> >> > >> >> >> Hi professor, >> >> >> >> >> >> I am using Freesurfer for DTI data. When I run 'mri_segstats', I >> >> >> got the result that there w >> >> as >> >> >> an obvious difference in left hippocampus, but no difference in right hippocampus. Th
en,
I
run >> >> >> segmentation of hippocampus subfields. The result showed there is no difference in to
tal
le
ft >> or >> >> >> right hippocampus, and only in two right hippocampus subfields has significant differ
enc
e.
Why >> is >> >> >> there inconsistent result in two means? >> >> >> Thank you very much. >> >> >> >> >> >> Sincerely, >> >> >> Zheng >> >> >> >> >> >> >> >> >> >> >> >> >> >> >> >> >> >> >> >> >> >> >> >> >> >> >> >> >> >> >> >> >> >> >> >> >> >> >> >> >> >>

Dear Zheng, You can build a GLM with a single group, and then look at the residuals. Or, even easier: just divide the volumes of each subject by his/her ICV (the answers won’t be identical, but should definitely be quite similar). Cheers, /Eugenio
-- Juan Eugenio Iglesias ERC Senior Research Fellow Translational Imaging Group University College London http://www.jeiglesias.com http://cmictig.cs.ucl.ac.uk/
From: freesurfer-bounces@nmr.mgh.harvard.edu on behalf of 郑凤莲 13181786167@163.com Reply-To: Freesurfer support list freesurfer@nmr.mgh.harvard.edu Date: Friday, 1 December 2017 at 12:55 To: Freesurfer support list freesurfer@nmr.mgh.harvard.edu Subject: Re: [Freesurfer] hippocampus subfields
Hi Bruce,
I am sorry for asking you question as this, but I really don't know how to do it? It seems that GLM is suitable for there are two groups or more. But I only have one group, If I want to get the line trend with eTIV corrected for the relationship between age and volume, what should I do? The picture is my result, but it doesn't corrected by eTIV. I appreciate your help, please. [cid:image001.png@01D36AA7.7A149BD0]
Thanks a lot! Zheng
At 2017-11-22 10:29:43, "Bruce Fischl" fischl@nmr.mgh.harvard.edu wrote:
you would include it as a nuisance variable in the glm
On Wed, 22 Nov 2017,
郑凤莲 wrote:
Hi Bruce,
Thanks for your quick reply. These results are not correted by eTIV, If eTIV are corrected, I
can only get the p value and scatter plot, I can't get the line trend. Do you know how to get the
line trend with eTIV corrected as these results?
Thanks,
Zheng
在 2017-11-22 10:14:16,"Bruce Fischl" fischl@nmr.mgh.harvard.edu 写道:
is this eTIV corrected? I would look at some of the outliers and make
sure that the segmentations are accurate. Certainly the trend is in the
correct (and depressing) direction.
cheers
Bruce
On Wed, 22 Nov 2017, 郑凤莲 wrote:
Hi Bruce,
Thanks for your advice. There are a part of the result. Blue color stands women, and Red colo
r
stands men.
The number of the data is not enough large. Are they ok? May I use them in my paper?
[IMAGE][IMAGE][IMAGE]
Thanks a lot !
Zheng
At 2017-11-20 10:15:49, "Bruce Fischl" fischl@nmr.mgh.harvard.edu wrote:
Hi Zheng
I would scatter plot age vs. volume, coloring men and women differently
(or different symbols) with and without eTIV correction to get an idea of
what is going on
cheers
Bruce
On Mon, 20 Nov
2017, 郑凤莲 wrote:
Hi Bruce,
My data is loss from 35 to 40. But the uniform of sex is not well from 40 to 55 and from 56
to
- I did the correlation analysis between age and volume. I don't know how I can explain this
problem.
Thanks again.
Sincerely,
Zheng
At 2017-11-20 09:35:45, "Bruce Fischl" fischl@nmr.mgh.harvard.edu wrote:
>Hi Zheng
>
>how uniform is your distribution? I'm hardly an expert on this, but I
>wouldn't expect very large effects until you get into the older end of
>that range. Have you scatter plotted your data?
>Bruce
>On Mon, 20 Nov 2017, 郑凤莲
>wrote:
>
>>
>> Hi Bruce,
>>
>> Thank you for your help.
>> I have 54 subjects, aged from 21 to 71 and only one group. I want to compare the chang
e o
f
>> hippocampus volume with age. The results before and after doing the correction for eTIV are
th
e
>> same. Where is wrong? Or if there is no error, how can I explain it in discussion?
>>
>> Thanks,
>> Zheng
>>
>>
>>
>>
>>
>> At 2017-11-20 04:55:49, "Bruce Fischl" fischl@nmr.mgh.harvard.edu wrote:
>> >Hi Zheng
>> >
>> >yes, I see. Maybe the effect is smaller than you have the power to see, or
>> >there is no effect? You would need to give us more details for us to help.
>> >Are you correcting for eTIV? What measure are you comparing?
>> >
>> >cheers
>> >Bruce
>> > On Sun, 19 Nov 2017, 郑凤莲 wrote:
>> >
>> >> Hi Bruce,
>> >>
>> >> I am sorry for this situation.
>> >> In the first way, there was an statistical difference in left hippocampus, but no d
iff
ere
nce
>> in
>> >> right hippocampus. In the second way, there was both no statistical difference in left o
r
>> >> right hippocampus. I don't know what causes this result.
>> >> Can you understand me this time?
>> >>
>> >> Thanks,
>> >> Zheng
>> >>
>> >>
>> >>
>> >>
>> >> At 2017-11-18 22:58:56, "Bruce Fischl" fischl@nmr.mgh.harvard.edu wrote:
>> >> >Hi Zheng
>> >> >
>> >> >no difference between what and what?
>> >> >
>> >> >cheers
>> >> >Bruce
>> >> >On Fri, 17 Nov 2017, 郑凤莲 wrote:
>> >> >
>> >> >> Hi professor,
>> >> >>
>> >> >> I am using Freesurfer for DTI data. When I run 'mri_segstats', I
>> >> >> got the result that there w
>> >> as
>> >> >> an obvious difference in left hippocampus, but no difference in right hippocampus. Th
en,
I
run
>> >> >> segmentation of hippocampus subfields. The result showed there is no difference in to
tal
le
ft
>> or
>> >> >> right hippocampus, and only in two right hippocampus subfields has significant differ
enc
e.
Why
>> is
>> >> >> there inconsistent result in two means?
>> >> >> Thank you very much.
>> >> >>
>> >> >> Sincerely,
>> >> >> Zheng
>> >> >>
>> >> >>
>> >> >>
>> >> >>
>> >> >>
>> >> >>
>> >> >>
>> >>
>> >>
>> >>
>> >>
>> >>
>> >>
>> >>
>>
>>
>>
>>
>>
>>
>>
freesurfer@nmr.mgh.harvard.edu
-
 Bruce Fischl
 -
 Iglesias Gonzalez, Eugenio
 -
 郑凤莲
郑凤莲