
External Email - Use Caution
Hi,
I am using Monte-Carlo simulations (for cortical thickness and volume - behavioral analysis) for clusterwise correction for multiple comparisons.
My results are either significant at (i) CFT < 0.001 and CWT < 0.1 (i.e., CWT = 0.07) (smoothing 12 mm) for cortical thickness-behavior analysis - with maxima at -4.3 (CFT) or (ii) CFT < 0.05 and CWT < 0.001 (i.e., CWT = 0.0002) (smoothing 10 mm) for cortical volume-behavior - with maxima at -4.53 (CFT)
Both the clusters in (i) (lateral orbital frontal) and (ii) (rostral middle) are within the frontal cortex, but not overlapping ! Also, although maxima is at (i) -4.3 and (ii) -4.53, still the clusters do not survive recommended thresholds suggested in https://www.ncbi.nlm.nih.gov/pubmed/29288131 And the FPR in this paper at strong CWT (i..e, 0.001) and liberal CFT (i..e, 0.05) is not calculated.
So I was wondering if there is any recommendation from the experts regarding these results, or none of these make sense because I never get CFT < 0.001 and CWT < 0.05 (at-least).
Any help would be really appreciated.
External Email - Use Caution
Hi,
I have follow-up concerns. I also ran PALM as following to check my results:
palm -i y.mgh -s fsaverage/surf/lh.white fsaverage/surf/lh.white.avg.area.mgh -d X.csv -t C1.csv -m mask.mgh -o plm -C 1.95996 -Cstat extent -twotail -n 5000
Interestingly, I get identical results (visually) between PALM (CFT = 0.05 i.e., 1.95996) and MCZ (CFT = 0.05 and CWT = 0.001). Outputs from both PALM and MCZ overlap (looks like almost completely).
I have following few concerns (in addition to my previous questions from previous email): (1). Summary result file from MCZ gets automatically saved after running mri_glmfit-sim. And, to save summary result file from PALM I ran mri_binarize, mris_calc and mri_surfcluster commands (by looking at previous discussions in FreeSurfer forum). However, summary file from MCZ gives me two large clusters - with peaks within middle temporal and rostral middle frontal, whereas summary file from PALM gives me two large clusters of very similar size as of MCZ, but peaks within fusiform and lateral orbitofrontal. It seems that both MCZ and PALM give two clusters based on maxima using their other scheme - that's why although cluster sizes and overall maps are similar but peaks differ - causing different names in corresponding summary files despite the fact that I am using same annotation file for both. Below I am attaching both the summary results from PALM and MCZ. Could you help me in figuring out the way to generate correct and reportable summary file? If both are correct in their own way, I would really appreciate any explanation and preferable option here?
(2). If both of the above options are correct and as I get consistent results from MCZ and PALM, then MCZ results clearly tell whether the correlation is negative or positive (by looking at the cache*.summary and cache*.cluster.mgh files. But I could not find a way from PALM results to make sure the correlation is negative or positive. All the outputs e.g., *.fwep.mgz and *.tstat.mgz show positive maps always. Could you help in finding the directionality of correlations from PALM option above?
(3). Again, as my results are consistent between MCZ and PALM, and for MCZ I provide flag --2spaces (for Bonf. Correction of hemispheres) so I assume that the above PALM command does not perform Bonf Correction, so I applied Bonf Correction in mri_surfcluster command using the flag --bonferroni 2. Could you please confirm is that's the correct way?
Thanks a lot for all your help.
Following is the summary file from PALM:
…..
…..
# SearchSpace_mm2 76467.1
# SearchSpace_vtx 149953
# Bonferroni 2
# Minimum Threshold 1e-12
# Maximum Threshold 0.05
# Threshold Sign abs
# AdjustThreshWhenOneTail 1
# Area Threshold 0 mm^2
# Overall max 0.998 at vertex 66
# Overall min 0 at vertex 0
# NClusters 2
# FixMNI = 0
#
# ClusterNo Max VtxMax Size(mm^2) MNIX MNIY MNIZ NVtxs WghtVtx Annot
1 0.042 11 2023.40 -35.1 -23.3 -22.8 3523 147.97 fusiform
2 0.044 9 1923.92 -26.3 23.8 -6.0 3442 151.45 lateralorbitofrontal
Following is the summary file from MCZ:
…..
…..
# SearchSpace_mm2 76467.1
# SearchSpace_vtx 149953
# Bonferroni 2
# Minimum Threshold 1.3
# Maximum Threshold infinity
# Threshold Sign abs
# AdjustThreshWhenOneTail 1
# CW PValue Threshold: 0.001
# Area Threshold 0 mm^2
# CSD thresh 1.300000
# CSD nreps 10000
# CSD simtype null-z
# CSD contrast NA
# CSD confint 90.000000
# Overall max 1.1597 at vertex 125047
# Overall min -4.53083 at vertex 110270
# NClusters 2
# FixMNI = 0
#
# ClusterNo Max VtxMax Size(mm^2) MNIX MNIY MNIZ CWP CWPLow CWPHi NVtxs WghtVtx Annot
1 -3.405 136882 2024.82 -48.2 -1.6 -33.0 0.00020 0.00000 0.00040 3526 -6733.96 middletemporal
2 -4.531 110270 1924.64 -17.2 57.8 -13.3 0.00020 0.00000 0.00040 3444 -6888.13 rostralmiddlefrontal
On Mon, Jan 6, 2020 at 2:58 PM Martin Juneja mj70481@gmail.com wrote:
Hi,
I am using Monte-Carlo simulations (for cortical thickness and volume - behavioral analysis) for clusterwise correction for multiple comparisons.
My results are either significant at (i) CFT < 0.001 and CWT < 0.1 (i.e., CWT = 0.07) (smoothing 12 mm) for cortical thickness-behavior analysis - with maxima at -4.3 (CFT) or (ii) CFT < 0.05 and CWT < 0.001 (i.e., CWT = 0.0002) (smoothing 10 mm) for cortical volume-behavior - with maxima at -4.53 (CFT)
Both the clusters in (i) (lateral orbital frontal) and (ii) (rostral middle) are within the frontal cortex, but not overlapping ! Also, although maxima is at (i) -4.3 and (ii) -4.53, still the clusters do not survive recommended thresholds suggested in https://www.ncbi.nlm.nih.gov/pubmed/29288131 And the FPR in this paper at strong CWT (i..e, 0.001) and liberal CFT (i..e, 0.05) is not calculated.
So I was wondering if there is any recommendation from the experts regarding these results, or none of these make sense because I never get CFT < 0.001 and CWT < 0.05 (at-least).
Any help would be really appreciated.

sorry, I'm not sure I'm following. It looks like you did two analyses, one with 10mm smoothing and CFT=.05, the other with 12mm and CFT=.001. You get a cluster for each in the same area, but they are not overlapping. Is that right?
On 1/6/2020 2:58 PM, Martin Juneja wrote:
External Email - Use Caution
Hi,
I am using Monte-Carlo simulations (for cortical thickness and volume - behavioral analysis) for clusterwise correction for multiple comparisons.
My results are either significant at (i) CFT < 0.001 and CWT < 0.1 (i.e., CWT = 0.07) (smoothing 12 mm) for cortical thickness-behavior analysis - with maxima at -4.3 (CFT) or (ii) CFT < 0.05 and CWT < 0.001 (i.e., CWT = 0.0002) (smoothing 10 mm) for cortical volume-behavior - with maxima at -4.53 (CFT)
Both the clusters in (i) (lateral orbital frontal) and (ii) (rostral middle) are within the frontal cortex, but not overlapping ! Also, although maxima is at (i) -4.3 and (ii) -4.53, still the clusters do not survive recommended thresholds suggested in https://www.ncbi.nlm.nih.gov/pubmed/29288131 And the FPR in this paper at strong CWT (i..e, 0.001) and liberal CFT (i..e, 0.05) is not calculated.
So I was wondering if there is any recommendation from the experts regarding these results, or none of these make sense because I never get CFT < 0.001 and CWT < 0.05 (at-least).
Any help would be really appreciated.
_______________________________________________ Freesurfer mailing list Freesurfer@nmr.mgh.harvard.edumailto:Freesurfer@nmr.mgh.harvard.edu https://mail.nmr.mgh.harvard.edu/mailman/listinfo/freesurfer
External Email - Use Caution
Dear Dough,
Thanks for your reply. Below, I am summarizing my concerns from previous emails:
*Q1. *I was wondering which of the following two options is better than the other (or neither may be !): (i) CFT < 0.001 and CWT < 0.1 (i.e., CWT = 0.07) (smoothing 12 mm) for cortical thickness-behavior analysis (using MCZ) or (ii) CFT < 0.05 and CWT < 0.001 (i.e., CWT = 0.0002) (smoothing 10 mm) for cortical volume-behavior (using MCZ)
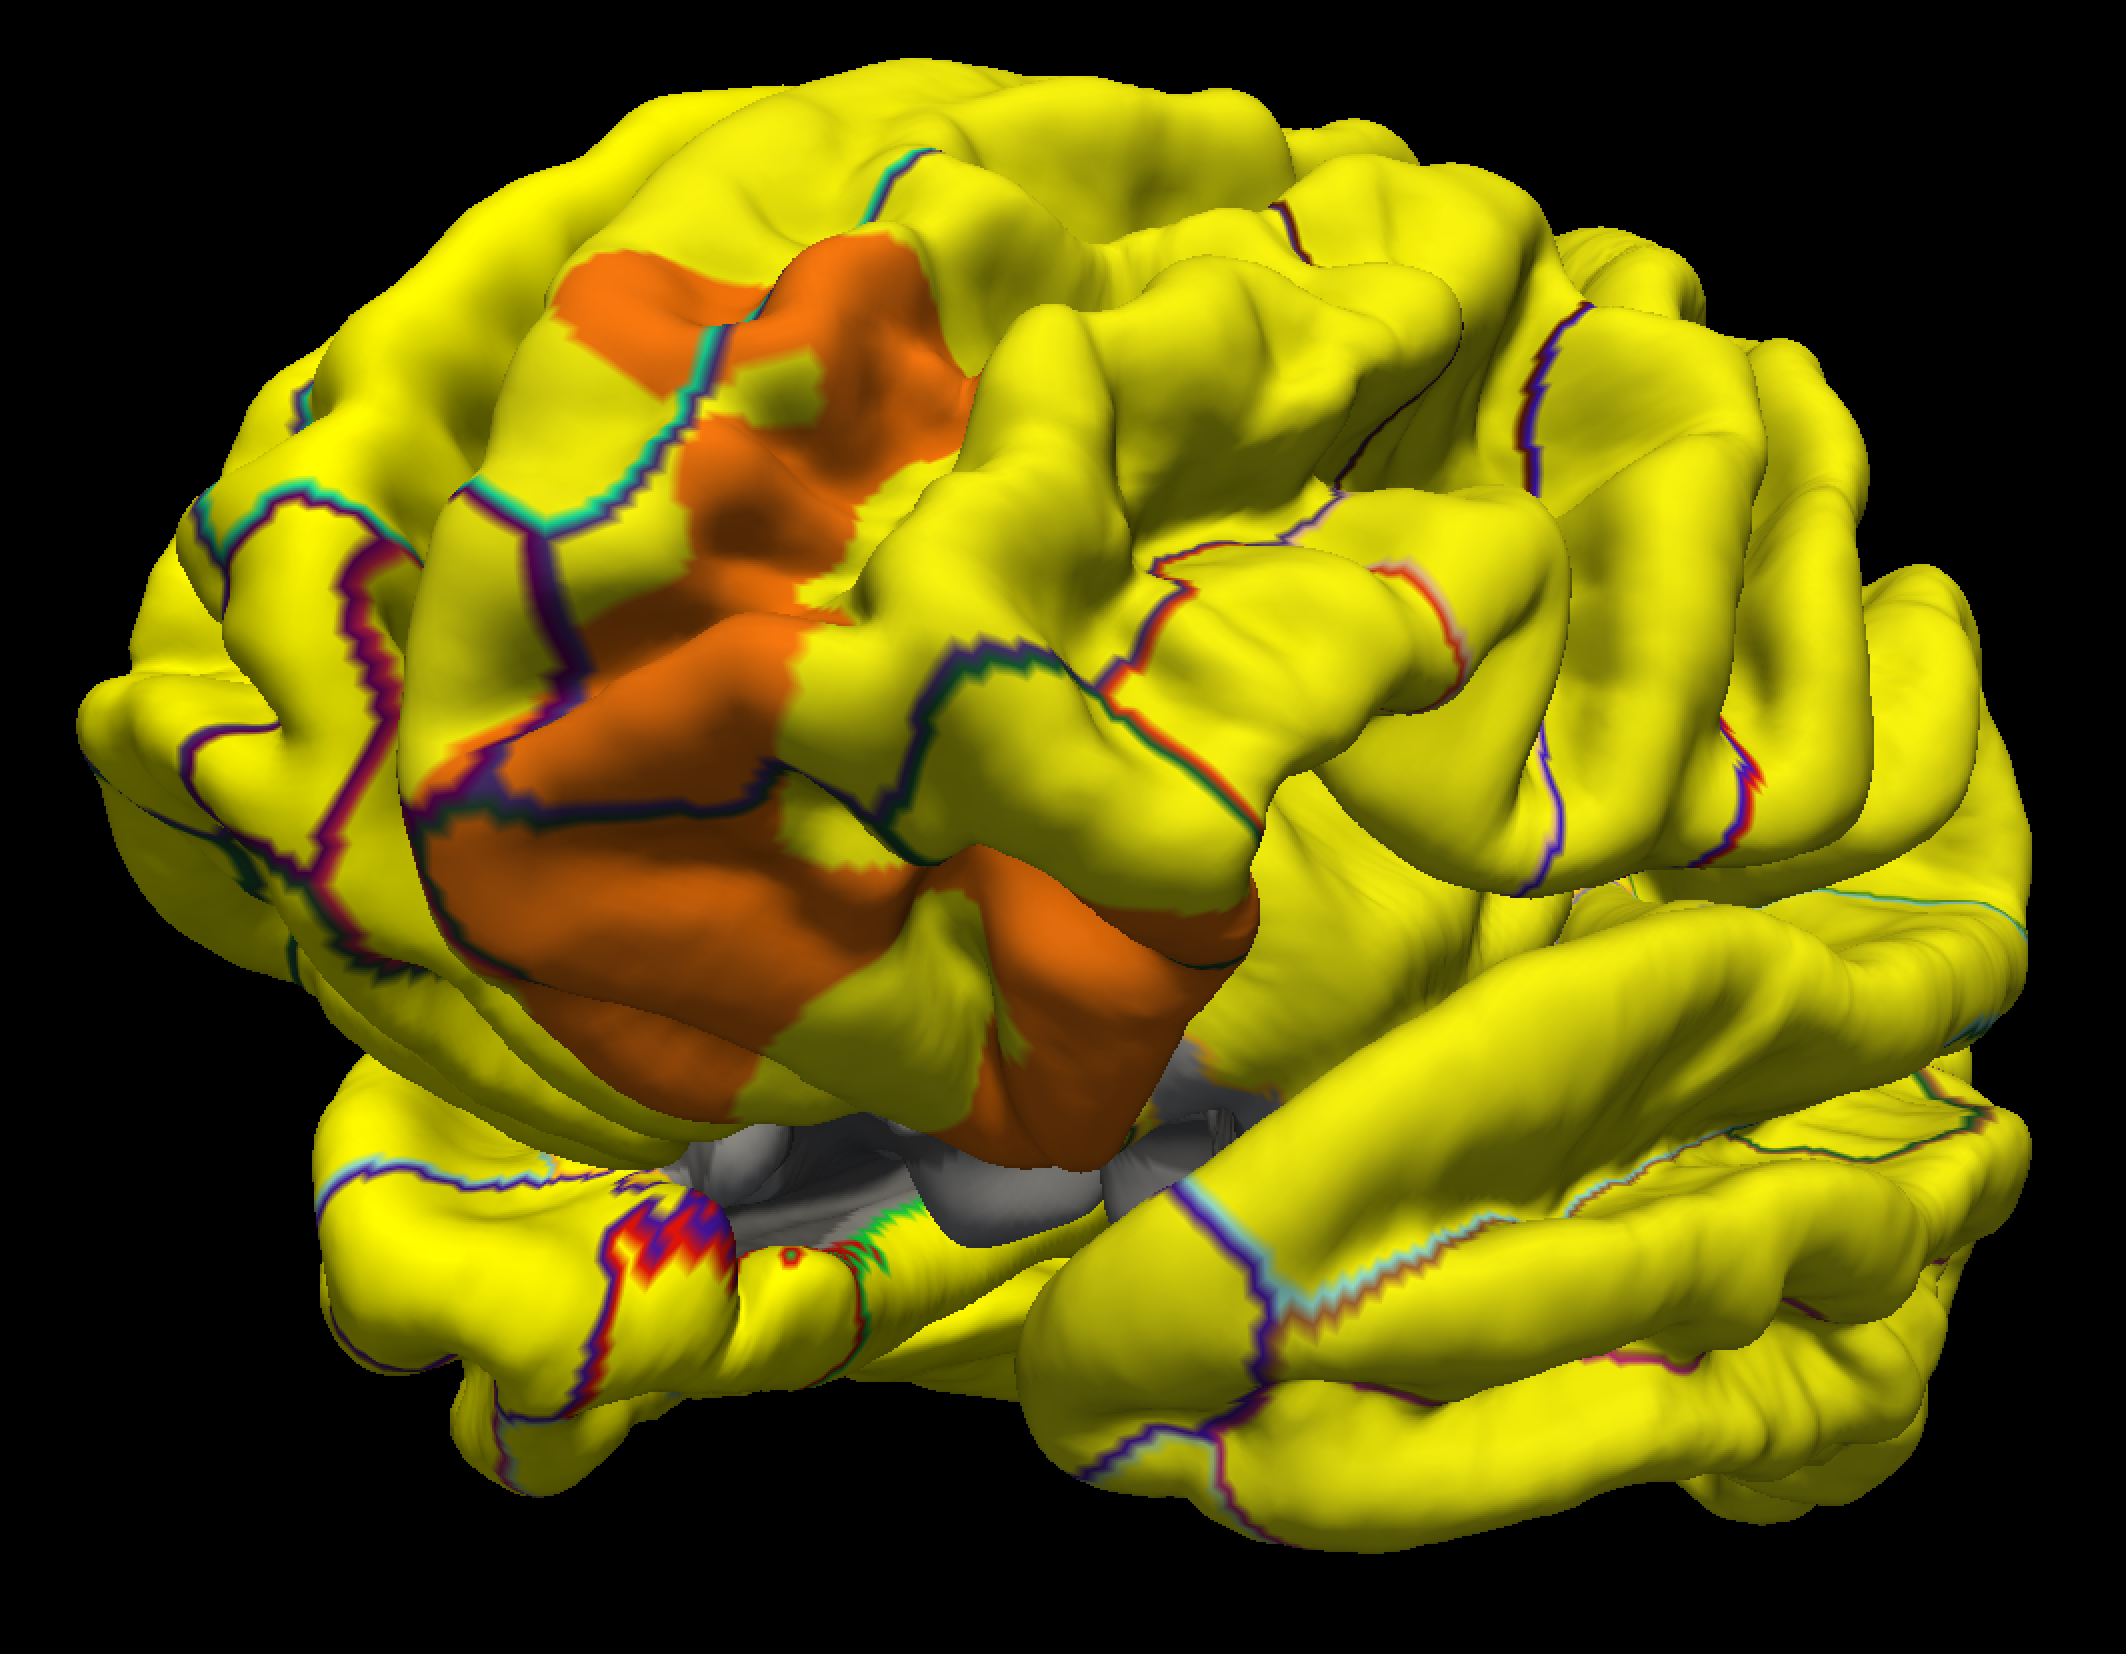
*Q2. *I tried 3rd option using PALM (most recommended !). I found that one of the two clusters I found is very identical (visually) between PALM (CFT = 0.05) and MCZ (CFT = 0.05 and CWT = 0.001) for cortical volume -behavior association at smoothing 12 mm. However, the second cluster survives with MCZ (CFT = 0.05 and CWT = 0.001), but not for PALM (CFT = 0.05). I am attaching a screen shot here showing that one cluster which is common between MCZ (CFT = 0.05 and CWT = 0.001) and PALM (CFT = 0.05, 10,000 permutations). I have following three concerns:
(a). Could you please confirm if PALM (CFT = 0.05, 10,000 permutations) with following command is the best approach here (compared to MCZ)? palm -i y.mgh -s fsaverage/surf/lh.white fsaverage/surf/lh.white.avg.area.mgh -d X.csv -t C1.csv -m mask.mgh -o plm -C 1.95996 -Cstat extent -twotail -n 10000
If that's correct, then to save summary result file from PALM, I ran mri_binarize, mris_calc and mri_surfcluster commands (by looking at previous discussions in FreeSurfer forum). My concern is that the PALM summary file gives one big cluster with peak within the orbitofrontal gyrus, but visually it shows that it extends to fusiform and temporal regions. Could you help me in figuring out the way to generate summary file in such a way that I get summary of each region (using Desikan atlas) where ever results extend (as opposed to the one I am getting now i.e., based on where the peak is, and because there is only one peak so I get summary of one big cluster around that peak)?
(b). The MCZ results clearly tell whether the correlation is negative or positive (by looking at the cache*.summary and cache*.cluster.mgh files). But I could not find a way from PALM results to make sure the correlation is negative or positive. All the outputs e.g., *.fwep.mgz and *.tstat.mgz show positive maps always. Could you help in finding the directionality of correlations from PALM results?
(c). For MCZ I provide flag --2spaces (for Bonf. Correction of hemispheres) so I assume that the above PALM command does not perform Bonf Correction, and if so then I applied Bonf. Correction in mri_surfcluster command using the flag --bonferroni 2. Could you please confirm is that's the correct way?
Thanks.
External Email - Use Caution
Dear Dough,
Thanks for your reply. Below, I am summarizing my concerns from previous emails:
*Q1. *I was wondering which of the following two options is better than the other (or neither may be !): (i) CFT < 0.001 and CWT < 0.1 (i.e., CWT = 0.07) (smoothing 12 mm) for cortical thickness-behavior analysis (using MCZ) or (ii) CFT < 0.05 and CWT < 0.001 (i.e., CWT = 0.0002) (smoothing 10 mm) for cortical volume-behavior (using MCZ)
*Q2. *I tried 3rd option using PALM (most recommended !). I found that one of the two clusters I found is very identical (visually) between PALM (CFT = 0.05) and MCZ (CFT = 0.05 and CWT = 0.001) for cortical volume -behavior association at smoothing 12 mm. However, the second cluster survives with MCZ (CFT = 0.05 and CWT = 0.001), but not for PALM (CFT = 0.05). I have following three concerns:
(a). Could you please confirm if PALM (CFT = 0.05, 10,000 permutations) with following command is the best approach here (compared to MCZ)? palm -i y.mgh -s fsaverage/surf/lh.white fsaverage/surf/lh.white.avg.area.mgh -d X.csv -t C1.csv -m mask.mgh -o plm -C 1.95996 -Cstat extent -twotail -n 10000
If that's correct, then to save summary result file from PALM, I ran mri_binarize, mris_calc and mri_surfcluster commands (by looking at previous discussions in FreeSurfer forum). My concern is that the PALM summary file gives one big cluster with peak within the orbitofrontal gyrus, but visually it shows that it extends to fusiform and temporal regions. Could you help me in figuring out the way to generate summary file in such a way that I get summary of each region (using Desikan atlas) where ever results extend (as opposed to the one I am getting now i.e., based on where the peak is, and because there is only one peak so I get summary of one big cluster around that peak)?
(b). The MCZ results clearly tell whether the correlation is negative or positive (by looking at the cache*.summary and cache*.cluster.mgh files). But I could not find a way from PALM results to make sure the correlation is negative or positive. All the outputs e.g., *.fwep.mgz and *.tstat.mgz show positive maps always. Could you help in finding the directionality of correlations from PALM results?
(c). For MCZ I provide flag --2spaces (for Bonf. Correction of hemispheres) so I assume that the above PALM command does not perform Bonf Correction, and if so then I applied Bonf. Correction in mri_surfcluster command using the flag --bonferroni 2. Could you please confirm is that's the correct way?
Thanks.
On Fri, Jan 10, 2020 at 10:43 AM Greve, Douglas N.,Ph.D. < DGREVE@mgh.harvard.edu> wrote:
sorry, I'm not sure I'm following. It looks like you did two analyses, one with 10mm smoothing and CFT=.05, the other with 12mm and CFT=.001. You get a cluster for each in the same area, but they are not overlapping. Is that right?
On 1/6/2020 2:58 PM, Martin Juneja wrote:
External Email - Use CautionHi,
I am using Monte-Carlo simulations (for cortical thickness and volume - behavioral analysis) for clusterwise correction for multiple comparisons.
My results are either significant at (i) CFT < 0.001 and CWT < 0.1 (i.e., CWT = 0.07) (smoothing 12 mm) for cortical thickness-behavior analysis - with maxima at -4.3 (CFT) or (ii) CFT < 0.05 and CWT < 0.001 (i.e., CWT = 0.0002) (smoothing 10 mm) for cortical volume-behavior - with maxima at -4.53 (CFT)
Both the clusters in (i) (lateral orbital frontal) and (ii) (rostral middle) are within the frontal cortex, but not overlapping ! Also, although maxima is at (i) -4.3 and (ii) -4.53, still the clusters do not survive recommended thresholds suggested in https://www.ncbi.nlm.nih.gov/pubmed/29288131 And the FPR in this paper at strong CWT (i..e, 0.001) and liberal CFT (i..e, 0.05) is not calculated.
So I was wondering if there is any recommendation from the experts regarding these results, or none of these make sense because I never get CFT < 0.001 and CWT < 0.05 (at-least).
Any help would be really appreciated.
Freesurfer mailing listFreesurfer@nmr.mgh.harvard.eduhttps://mail.nmr.mgh.harvard.edu/mailman/listinfo/freesurfer
Freesurfer mailing list Freesurfer@nmr.mgh.harvard.edu https://mail.nmr.mgh.harvard.edu/mailman/listinfo/freesurfer
Hi, sorry for the delay.
On 1/10/2020 1:42 PM, Martin Juneja wrote:
External Email - Use Caution
Dear Dough,
Thanks for your reply. Below, I am summarizing my concerns from previous emails:
Q1. I was wondering which of the following two options is better than the other (or neither may be !): (i) CFT < 0.001 and CWT < 0.1 (i.e., CWT = 0.07) (smoothing 12 mm) for cortical thickness-behavior analysis (using MCZ) or (ii) CFT < 0.05 and CWT < 0.001 (i.e., CWT = 0.0002) (smoothing 10 mm) for cortical volume-behavior (using MCZ) You should definitely not use CFT<.05 with MCZ, it will create a lot of false positives
Q2. I tried 3rd option using PALM (most recommended !). I found that one of the two clusters I found is very identical (visually) between PALM (CFT = 0.05) and MCZ (CFT = 0.05 and CWT = 0.001) for cortical volume -behavior association at smoothing 12 mm. However, the second cluster survives with MCZ (CFT = 0.05 and CWT = 0.001), but not for PALM (CFT = 0.05). I have following three concerns:
(a). Could you please confirm if PALM (CFT = 0.05, 10,000 permutations) with following command is the best approach here (compared to MCZ)? palm -i y.mgh -s fsaverage/surf/lh.white fsaverage/surf/lh.white.avg.area.mgh -d X.csv -t C1.csv -m mask.mgh -o plm -C 1.95996 -Cstat extent -twotail -n 10000 This is a good approach, thought there is no way to know what the "best" CFT is going to be.
If that's correct, then to save summary result file from PALM, I ran mri_binarize, mris_calc and mri_surfcluster commands (by looking at previous discussions in FreeSurfer forum). My concern is that the PALM summary file gives one big cluster with peak within the orbitofrontal gyrus, but visually it shows that it extends to fusiform and temporal regions. Could you help me in figuring out the way to generate summary file in such a way that I get summary of each region (using Desikan atlas) where ever results extend (as opposed to the one I am getting now i.e., based on where the peak is, and because there is only one peak so I get summary of one big cluster around that peak)? Not sure what you mean here. The summary file is a summary of the clusters, which don't follow aparc boundaries. Do you want the fraction of the cluster that is in a given ROI?
(b). The MCZ results clearly tell whether the correlation is negative or positive (by looking at the cache*.summary and cache*.cluster.mgh files). But I could not find a way from PALM results to make sure the correlation is negative or positive. All the outputs e.g., *.fwep.mgz and *.tstat.mgz show positive maps always. Could you help in finding the directionality of correlations from PALM results? Not sure, you'll have to ask Anderson Winkler
(c). For MCZ I provide flag --2spaces (for Bonf. Correction of hemispheres) so I assume that the above PALM command does not perform Bonf Correction, and if so then I applied Bonf. Correction in mri_surfcluster command using the flag --bonferroni 2. Could you please confirm is that's the correct way? Not sure. You can just multiply the p-values that you get out of PALM by 2
Thanks.
On Fri, Jan 10, 2020 at 10:43 AM Greve, Douglas N.,Ph.D. <DGREVE@mgh.harvard.edumailto:DGREVE@mgh.harvard.edu> wrote: sorry, I'm not sure I'm following. It looks like you did two analyses, one with 10mm smoothing and CFT=.05, the other with 12mm and CFT=.001. You get a cluster for each in the same area, but they are not overlapping. Is that right?
On 1/6/2020 2:58 PM, Martin Juneja wrote:
External Email - Use Caution
Hi,
I am using Monte-Carlo simulations (for cortical thickness and volume - behavioral analysis) for clusterwise correction for multiple comparisons.
My results are either significant at (i) CFT < 0.001 and CWT < 0.1 (i.e., CWT = 0.07) (smoothing 12 mm) for cortical thickness-behavior analysis - with maxima at -4.3 (CFT) or (ii) CFT < 0.05 and CWT < 0.001 (i.e., CWT = 0.0002) (smoothing 10 mm) for cortical volume-behavior - with maxima at -4.53 (CFT)
Both the clusters in (i) (lateral orbital frontal) and (ii) (rostral middle) are within the frontal cortex, but not overlapping ! Also, although maxima is at (i) -4.3 and (ii) -4.53, still the clusters do not survive recommended thresholds suggested in https://www.ncbi.nlm.nih.gov/pubmed/29288131 And the FPR in this paper at strong CWT (i..e, 0.001) and liberal CFT (i..e, 0.05) is not calculated.
So I was wondering if there is any recommendation from the experts regarding these results, or none of these make sense because I never get CFT < 0.001 and CWT < 0.05 (at-least).
Any help would be really appreciated.
_______________________________________________ Freesurfer mailing list Freesurfer@nmr.mgh.harvard.edumailto:Freesurfer@nmr.mgh.harvard.edu https://mail.nmr.mgh.harvard.edu/mailman/listinfo/freesurfer
_______________________________________________ Freesurfer mailing list Freesurfer@nmr.mgh.harvard.edumailto:Freesurfer@nmr.mgh.harvard.edu https://mail.nmr.mgh.harvard.edu/mailman/listinfo/freesurfer
_______________________________________________ Freesurfer mailing list Freesurfer@nmr.mgh.harvard.edumailto:Freesurfer@nmr.mgh.harvard.edu https://mail.nmr.mgh.harvard.edu/mailman/listinfo/freesurfer
freesurfer@nmr.mgh.harvard.edu
-
 Greve, Douglas N.,Ph.D.
 -
 Martin Juneja